-
Články
- Vzdělávání
- Časopisy
Top články
Nové číslo
- Témata
- Kongresy
- Videa
- Podcasty
Nové podcasty
Reklama- Kariéra
Doporučené pozice
Reklama- Praxe
Host Transcriptional Response to Influenza and Other Acute Respiratory Viral Infections – A Prospective Cohort Study
Gene expression profiling of human blood cells might uncover the complex dynamics of host response to ARIs such as pandemic H1N1. However, only limited data are available on the system level response to naturally acquired infections. To understand the molecular bases and network orchestration of host responses, we prospectively enrolled 1610 healthy adults in the fall of 2009 and 2010, followed the subjects with influenza-like illness (N = 133) for 3 weeks, and examined changes in their peripheral blood gene expression. We discovered distinct phases of the host response spanning 6 days after infection, and identified genes that differentiate influenza from non-influenza virus infection. We then moved the focus from gene expression patterns to gene co-expression patterns. We detected gene modules that are related to core features of regulatory networks and found a substantial increase in the connectivity of the influenza responsive genes. Finally, we identified a molecular signature that correlated significantly with antibody response to pH1N1 virus. Taken together, our findings offer insights into the molecular mechanisms underlying host response to influenza virus infection, and provide a valuable foundation for investigation of the global coordinated responses to ARIs. Molecular correlates of the immune response suggest targets for intervention and improved vaccines.
Published in the journal: . PLoS Pathog 11(6): e32767. doi:10.1371/journal.ppat.1004869
Category: Research Article
doi: https://doi.org/10.1371/journal.ppat.1004869Summary
Gene expression profiling of human blood cells might uncover the complex dynamics of host response to ARIs such as pandemic H1N1. However, only limited data are available on the system level response to naturally acquired infections. To understand the molecular bases and network orchestration of host responses, we prospectively enrolled 1610 healthy adults in the fall of 2009 and 2010, followed the subjects with influenza-like illness (N = 133) for 3 weeks, and examined changes in their peripheral blood gene expression. We discovered distinct phases of the host response spanning 6 days after infection, and identified genes that differentiate influenza from non-influenza virus infection. We then moved the focus from gene expression patterns to gene co-expression patterns. We detected gene modules that are related to core features of regulatory networks and found a substantial increase in the connectivity of the influenza responsive genes. Finally, we identified a molecular signature that correlated significantly with antibody response to pH1N1 virus. Taken together, our findings offer insights into the molecular mechanisms underlying host response to influenza virus infection, and provide a valuable foundation for investigation of the global coordinated responses to ARIs. Molecular correlates of the immune response suggest targets for intervention and improved vaccines.
Introduction
Influenza viruses are highly contagious respiratory pathogens that cause about three to five million cases of severe illness, and about 250 000 to 500 000 deaths worldwide each year [1]. In the US, influenza affects an estimated 5% to 20% of the population yearly [2], and is responsible for an average of 3.1 million hospitalized days, and 31.4 million outpatient visits. Direct medical costs are estimated to be at least $10.4 billion annually [3]. A new influenza virus appeared in Mexico and the United States in April 2009 and caused extensive outbreaks of influenza in the population. The virus was promptly identified as a swine-like influenza A (H1N1) virus and shown to be a triple reassortant virus containing genes from swine, human, and avian influenza A viruses [4]. Pandemic swine influenza (pH1N1) peaked in the United States in October 2009, with minimal activity during the subsequent winter period of influenza and reappeared during the winter of 2010–2011. Our recent studies showed that preexisting antibody to the seasonal A/H1N1 virus reduced pH1N1 influenza virus infection and illness in healthy young adults [5, 6].
Complex coordinated responses are triggered in the host following an acute respiratory viral infection. Many aspects of host-pathogen interactions after influenza infection have been studied [7–12]. Blood transcriptome profiling provides a ‘snap shot’ of the systematic host immune networks, as blood circulates throughout the body, carrying naive and educated immune cells, whose transcriptional activity can be influenced by environmental stimuli such as a respiratory virus illness [13]. Transcriptional signatures have been described in the context of ARIs caused by different etiological agents, including influenza, rhinovirus (HRV), and respiratory syncytial virus (RSV), as well as by influenza vaccination [14–23]. These studies have shown that blood gene expression signatures are distinctive for individuals with infection-induced ARI. ARI gene expression signatures show highly significant enrichment for transcripts encoding proteins involved in interferon signaling and pattern recognition induced innate immunity responses [14, 16].
Transcriptome analysis in influenza-infected mouse lungs has revealed distinct phases of the host response extending over at least a two month period after infection [20]. In previously reported studies in humans with ARI, transcriptional profiling was only performed on RNA samples collected either at a single timepoint of peak symptoms, or within the initial 2 to 3 days of hospitalization. The dynamic changes over the entire time course of naturally acquired infection and illness in humans are less clear. Experimentally induced influenza infection has been used to obtain information about changes in temporal gene expression [14, 21]. Huang et al made important observations about the differences in response between asymptomatic and symptomatic individuals. These studies, however, were limited by sample size and could not contrast other common respiratory virus agents with influenza. Menachery et al reported a contrasting gene signature between pH1N1 and coronavirus infected airway epithelial cells [22]. The genes they investigated were limited to interferon-stimulated genes. Studies to characterize the temporal dynamics of the systemic transcriptional response to ARI in humans are necessary to better understand the biology of infection, the host response and occurrence of disease. Furthermore, serum antibody responses to influenza virus infection have large inter-individual variation [5, 6]. Several influenza vaccine studies showed genes that play a role in antigen presentation and T cell recognition are associated with influenza vaccine-induced antibodies [19, 23–25]. Whether the same sets of genes contribute to the variation in antibody response to naturally acquired influenza infection is not known.
Approaches to uncover the modular organization and function of transcriptional systems have shown promise in facilitating functional interpretation and discovering biological networks. These models have been successfully applied in several biological contexts [26–28]. Weighted Gene Co-expression Network Analysis (WGCNA) group sets of genes with similar transcriptional patterns together to form a transcriptional module. Since the probability for multiple transcripts to follow a complex pattern of expression across all the samples by chance is low, such sets of genes should constitute coherent and biologically meaningful transcriptional units [29, 30]. Recently developed differential co-expression analysis goes beyond identification of differentially expressed genes (DEGs) or pathways to identify differential co-expression pattern [31–33]. Under the premise that pairwise correlations between gene expression levels result from regulatory relationships among the genes, major changes in co-expression patterns between two conditions may indicate dysfunctional regulatory systems in disease.
The clinical, virological and immunological results of our prospective study of ARI in a young adult population that included influenza and other known pathogenic viruses have been reported [5, 6]. Using genome wide transcript profiling we provide evidence in this report for three distinct phases of response among those persons with ARI: a) acute systemic activation of the innate response; b) recovery with extensive cell repair and proliferation; and 3) restoration of baseline gene expression patterns. These results provide new transcriptional correlates for the evolution of ARI. The results indicate a central role for interferon and innate immunity in the acute phase of the illness. The recovery phase has not been well characterized previously and suggests new avenues for understanding the restoration of biological system equilibrium after infection and illness.
Results
Etiology and demographics of the subjects with ARIs
1610 healthy adults were prospectively enrolled before the influenza seasons of 2009–10 and 2010–11. Of these, 142 (8.8%) who subsequently developed a moderate influenza-like illness were enrolled for follow up; none met the criteria for severe respiratory disease. Of the 142 enrolled ill subjects, 133 reported for all scheduled study visits and had technically adequate gene expression data (vide infra). Table 1 summarizes the infection and demographic data for these 133 subjects. Viral culture and RT-PCR for respiratory viruses indicated that 64 were infected with influenza A virus, and 9 were infected with influenza B virus. Infection with a rhinovirus, respiratory syncytial virus (RSVA/RSVB), coronavirus (OC43, 229E, NL63, HKU1), or enterovirus (Entero) was also detected in a number of the subjects with influenza-like symptoms. There were 24 individuals with an influenza-like illness for whom no virus was identified. The subjects were predominantly European-Americans (80.5%), consistent with the study area population.
Tab. 1. Viral infections and demographic information of the 133 subjects with influenza-like illness enrolled at Texas A&M University in Fall 2009 and 2010 from whom microarray expression data were available. 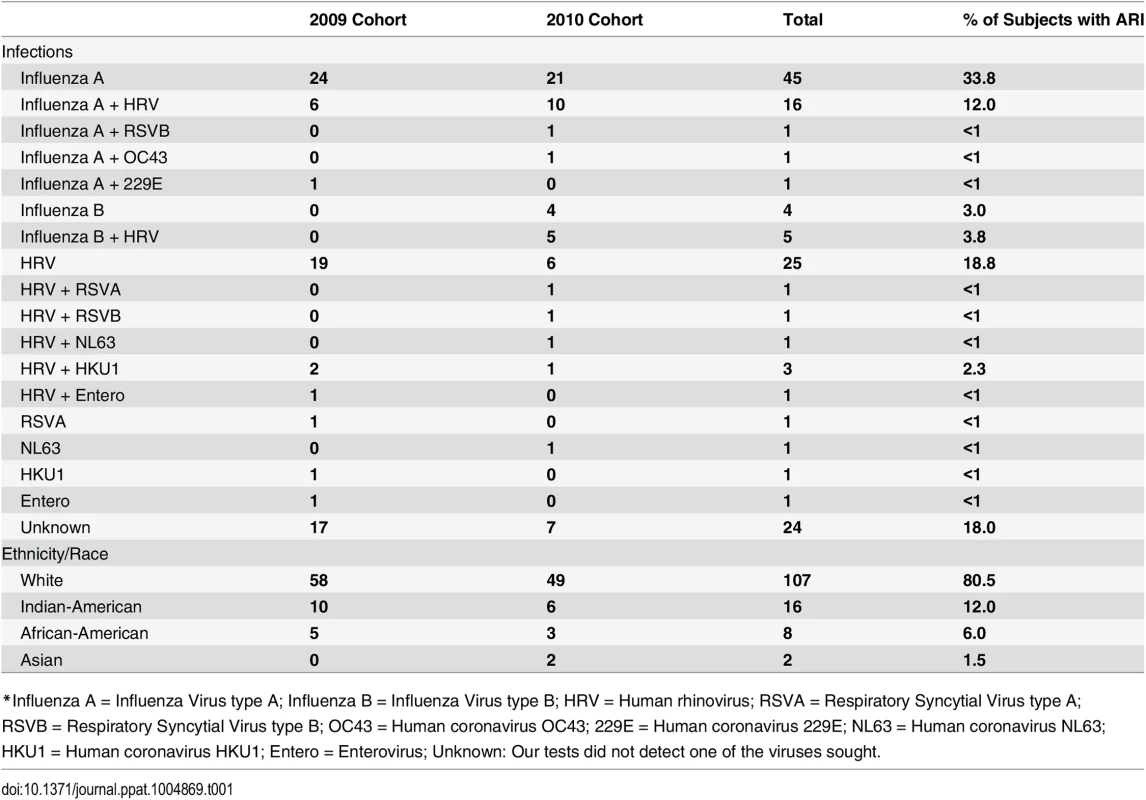
*Influenza A = Influenza Virus type A; Influenza B = Influenza Virus type B; HRV = Human rhinovirus; RSVA = Respiratory Syncytial Virus type A; RSVB = Respiratory Syncytial Virus type B; OC43 = Human coronavirus OC43; 229E = Human coronavirus 229E; NL63 = Human coronavirus NL63; HKU1 = Human coronavirus HKU1; Entero = Enterovirus; Unknown: Our tests did not detect one of the viruses sought. Global gene expression profile for influenza infection in adults
We analyzed the global gene expression profiles of peripheral whole blood in the 133 adults with an ARI at up to seven time points before, during, and after the occurrence of illness (Fig 1A and 1B). Because the subjects were enrolled prospectively we had control samples taken from the same subject before occurrence of illness (baseline samples). A total of 890 microarray analyses were completed. Samples which failed QC were excluded from the analyses (N = 10), leaving 880 high quality arrays from which the subsequent analysis was conducted. Differential expression analyses for each day, compared to the baseline were then stratified by viral agent. We first analyzed the gene expression profiles in 49 subjects from whom an influenza virus infection was identified. The 24 subjects with influenza A virus infection in the 2009 cohort were used as a discovery group, and the consistency of differential expressed genes was assessed in another 21 influenza A virus infected subjects and 4 influenza B virus infected subjects in the 2010 cohort as a validation group. After performing significance testing with corrections for multiple tests, we detected highly significant expression differences in thousands of transcripts during the period of influenza illness (days 0, 2, 4, 6) in both discovery and validation groups. In contrast, once the subject had clinically recovered there were no significant expression differences detected (day 21, and spring samples).
Fig. 1. Study design and analysis scheme. 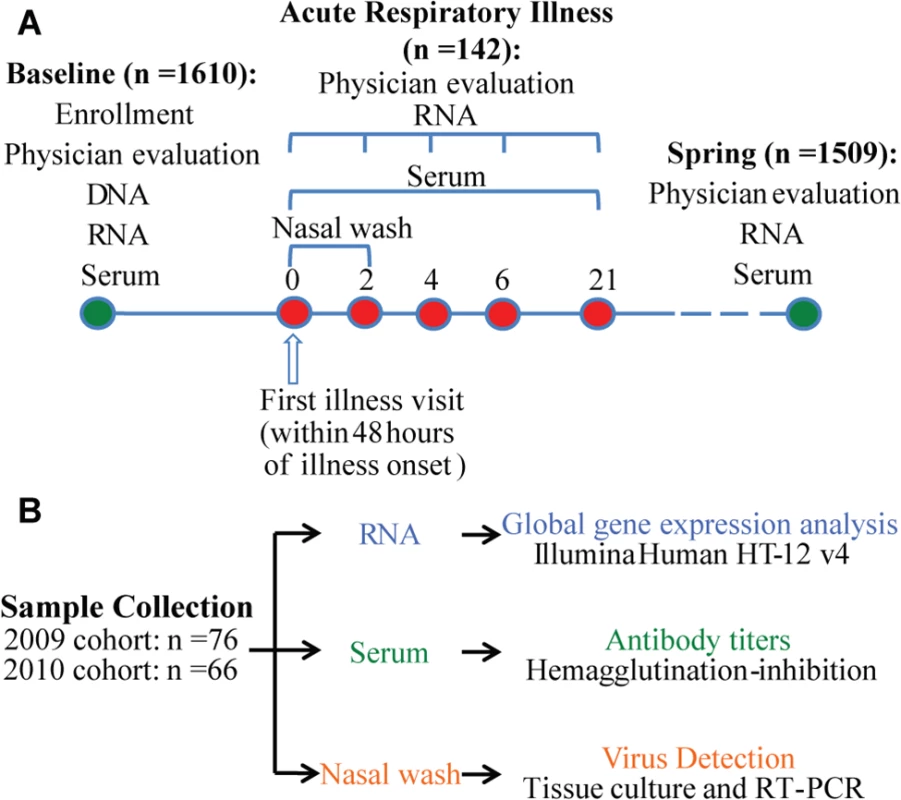
(A) 1610 individuals were enrolled before the influenza season in 2009 and 2010. Peripheral blood samples and nasal secretion samples were collected from each subject at the beginning of enrollment for influenza antibody tests. Genomic DNA and whole blood RNA were obtained from blood samples. Those subjects who became ill with influenza-like symptoms (N = 142) were seen within 48 hours of onset and 2, 4, and 6 days later for repeat evaluation, specimen collections, and medical care and 21 days later for collection of convalescent specimens. Nasal wash samples were collected for virus detection on day 0 and day 2. 1509 of the enrolled subjects completed the study and were called back in the spring of the next year for collecting whole blood RNA, serum and nasal wash samples. (B) Sample size and data generation. A robust and dynamic host transcriptional response to influenza virus infection still present after cell composition changes were taken into account
Since blood is a complex tissue, changes in transcript abundance can be attributed to either transcriptional regulation or changes in the composition of leukocyte populations. To “deconvolute” these two phenomena, we computed a cell score derived from the expression profile of each sample using a composite of lymphocyte, neutrophil or monocyte specific transcripts. We found that lymphocyte lineagespecific transcripts were depressed in the acute phase of influenza virus infection, increased above baseline in the recovery phase, and then returned to baseline on day 21 (Fig 2A). An opposite change in neutrophil score was observed (Fig 2B). Expression levels of monocyte markers were increased in the acute phase and returned to baseline on day 6 (Fig 2C). These changes in established lineage markers of the broad cell populations probably track the changes in cell composition in the peripheral blood. The changes in lymphocyte and neutrophil proportions we predicted “in silico” are consistent with the changes described in experimental human challenges with influenza virus [34, 35]. Changes in lineage composition could explain part of the differential gene expression observed during the infection. We therefore recomputed the differential expression analysis using the lymphocyte and neutrophil scores as covariates in a series of contrasts focusing on days 0 to day 6 compared to baseline. Although the p-values were slightly increased, the rank ordering of genes showing highly specific differential expression was nearly identical (Tables 2–5). This indicates that while cell composition does affect estimates of total transcript abundance, the most important component of the differential expression arises from changes in transcript abundance within those populations. On a global scale, changes in the host transcriptomes were observed from the first day of illness through day 6 evaluations. A total of 4,706 differentially expressed genes (DEGs) (BH-corrected P values <0.05 in both cohorts) were identified over the course of 6 days of influenza virus illness (S1A Fig). 2119 transcripts, corresponding to 1421 genes, were responsive to the infectious stimulus on day 0 (day 1 or 2 of illness). The number of DEGs peaked at day 4. On day 6, only a small number (N = 46) of DEGs were newly detected (i.e. DEGs that first appeared on day 6 and were not detected at any time before). 738 out of the 1140 DEGs with |log2 Fold-Change| > 0.3 were first detected on day 0 (S1B Fig).
Fig. 2. A robust and dynamic host transcriptional response to influenza virus infection. 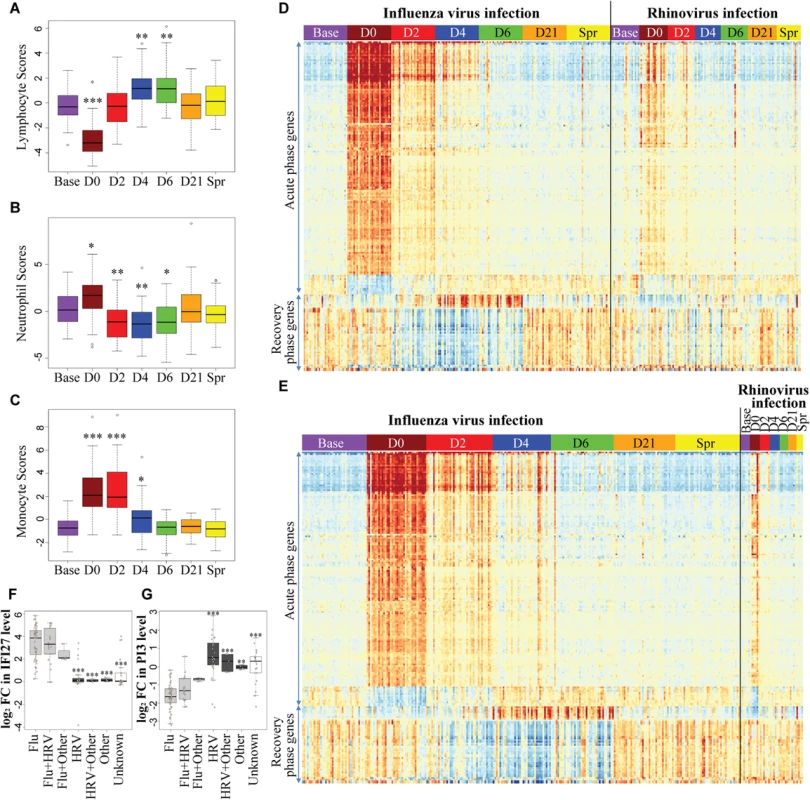
(A-C) Peripheral blood cell composition was altered by influenza virus infection. Cell scores for (A) lymphocyte, (B) neutrophil and (C) monocyte were computed for each sample from influenza-infected individuals, by taking the PC1 of normalized expression levels of the lineage-specific gene sets (See S3 Table for the list of lineage specific genes). One-way analysis of variance (ANOVA) was used to determine whether there are significant differences between each illness day and baseline. (D-E) Heatmaps demonstrating the time course of the genes showing the most significant pattern of differential expression compared to baseline in patients with influenza virus and/or rhinovirus infection. (D) 2009 Cohort, (E) 2010 Cohort. Each column corresponds to an individual RNA sample and each row represents the mean-centered, normalized expression values for each of the differentially expressed genes (BH-corrected P values <0.05, |log2 FC| >1 in both 2009 and 2010 cohorts). Samples were grouped by day and subjects were grouped by infections status (influenza virus infection group includes influenza A, influenza B, influenza A +rhinovirus and influenza B +rhinovirus infections). The transcript order was determined by hierarchical clustering and the order was the same in the two heatmaps. There are three clear phases of transcriptional regulation in response to infection– 1) an acute phase seen on the first day of illness that persisted for 2–4 days; 2) a recovery phase that peaked on day 4 and day 6 after virus infection; 3) restoration of baseline gene expression patterns by day 21. A full list of the 202 transcript probes in the heatmaps and their corresponding genes is provided in S1 Table. (F-G) Expression changes of (F) IFI27 and (G) PI3 discriminate between infections with influenza virus and rhinovirus. Fold Changes of IFI27 and PI3 were measured in paired day 0 –baseline samples from patients with ARI. Subjects were grouped by infections status. Enterovirus, HKU1, NL63, and RSV infections were grouped together as “Other” virus. One-way ANOVA was used to determine whether there are any significant differences between influenza virus infection groups (Grey) and each non-influenza virus group (Black). ***, P <0.001; **, P <0.005; *, P <0.01. Tab. 2. Top upregulated genes in the acute phase of influenza virus infection. 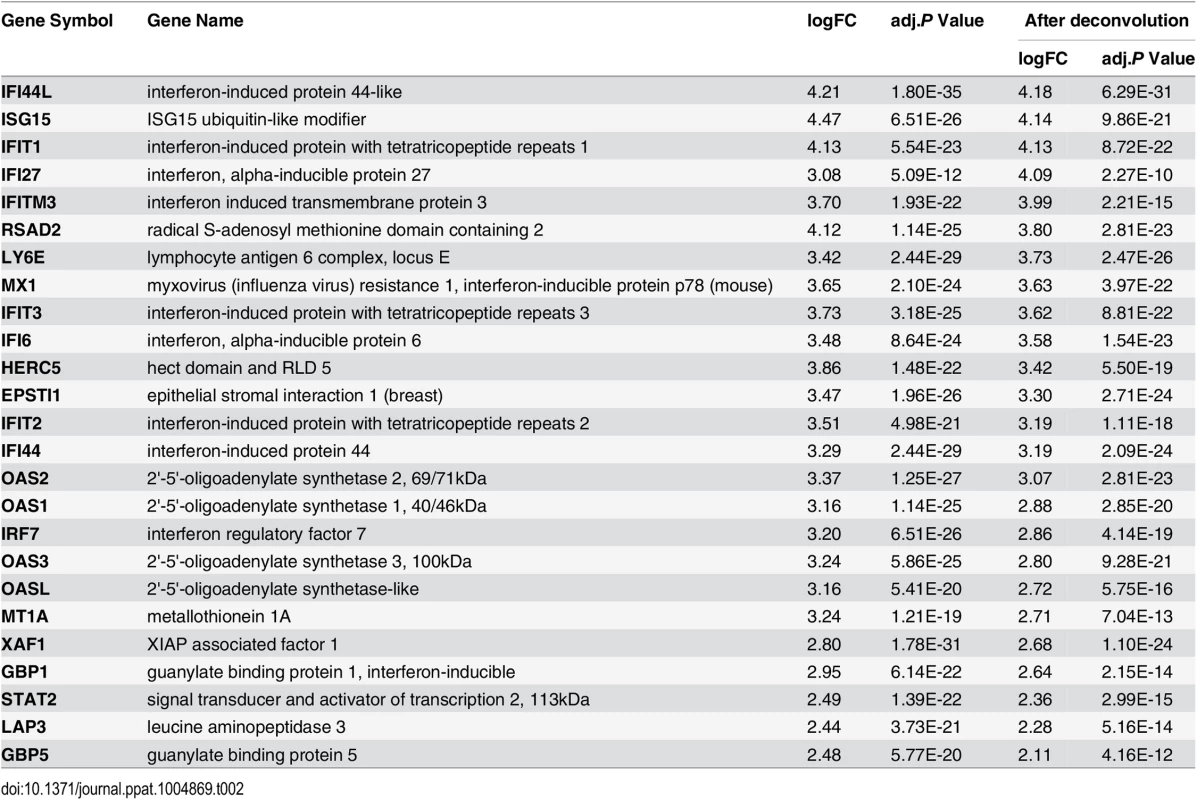
Tab. 3. Top downregulated genes in the acute phase of influenza virus infection. 
Tab. 4. Top upregulated genes in the recovery phase of influenza virus infection. 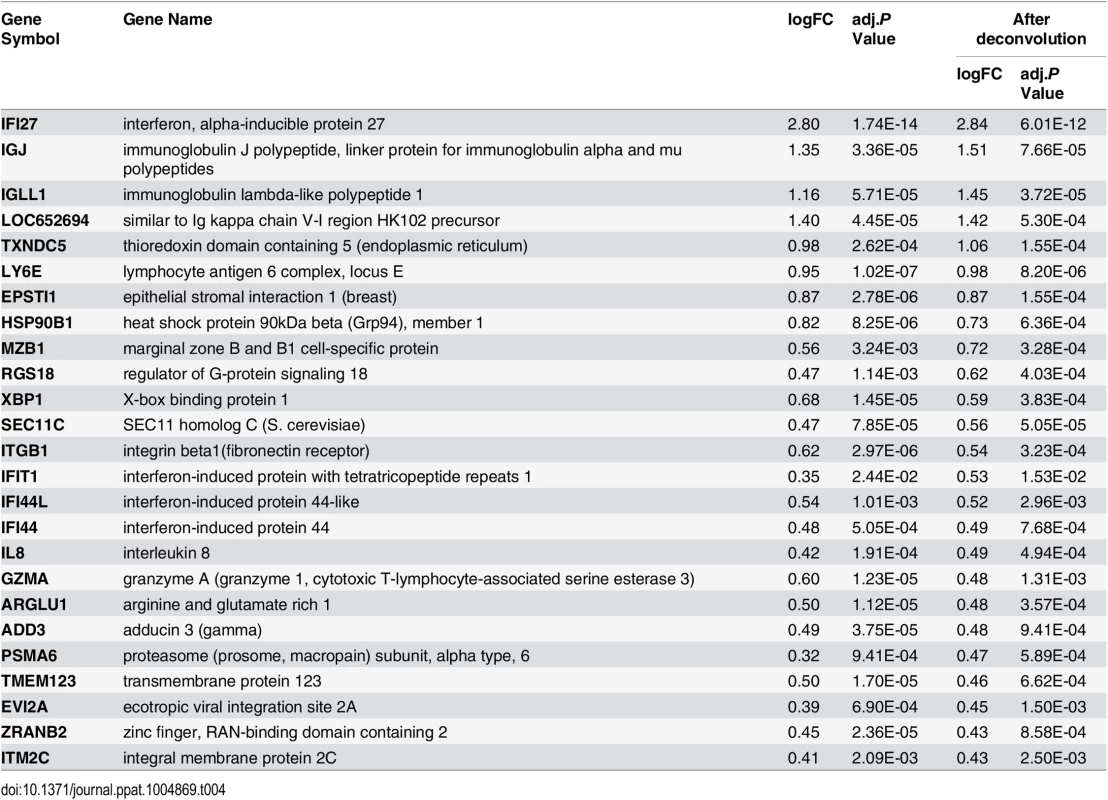
Tab. 5. Top downregulated genes in the recovery phase of influenza virus infection. 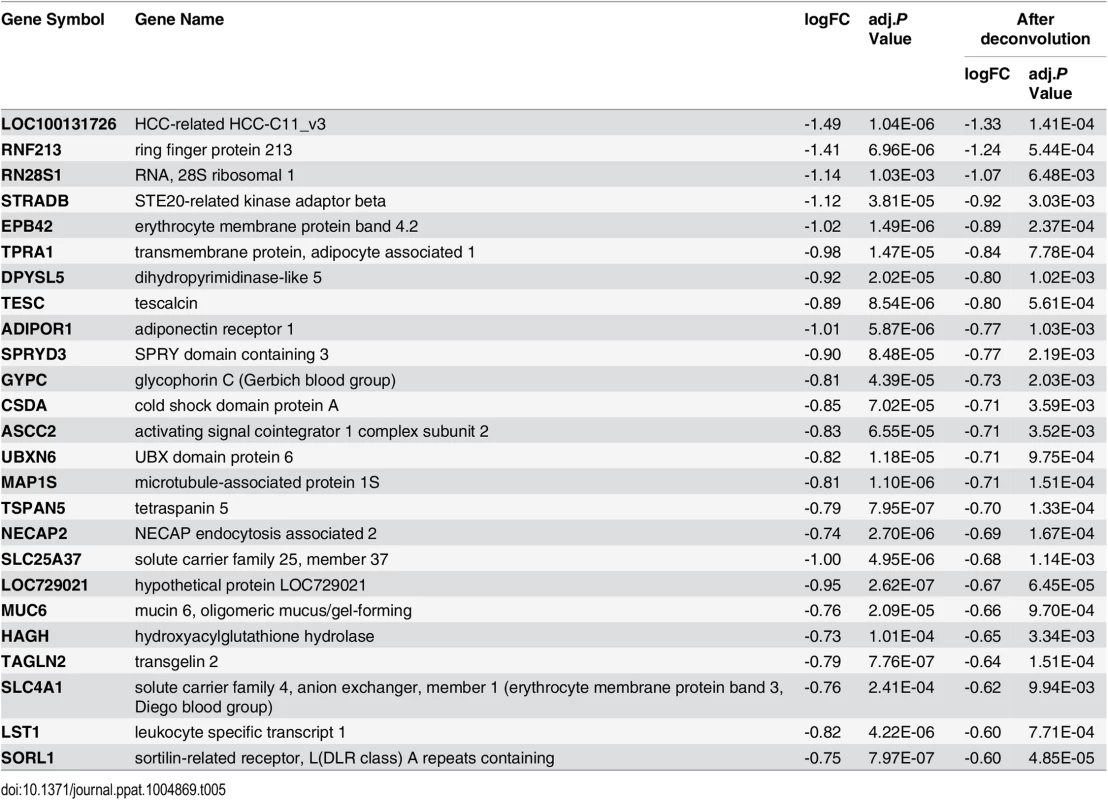
Subjects with influenza virus infection showed a characteristic three-phase response at the level of the transcript profile
We plotted a heatmap of the 202 transcripts (S1 Table) showing the most significant pattern of differential expression compared to baseline (Fig 2D and 2E), and determined the transcript order by hierarchical clustering. These genes fall into two clusters: 1) genes that were regulated in the acute phase of influenza virus infection, and 2) genes that became differentially expressed at a later time-point (recovery phase). All individuals showed complete recovery to the baseline transcript profile by day 21 after onset of illness. In the acute phase, there was a very large increase in components of the interferon pathway and innate immunity (e.g. IFI44L, IFIT1, MX1, IFITM3, OAS2, IFI27 and IFIT3, see Table 2), as well as decreased expression of genes involved in translational elongation and protein biosynthesis (e.g. RPS4X, RPS18, RPS6, RPS8 and RPL5, see Table 3). This was most intense on the first day of illness and continued for 2–4 days. This phase was followed by a characteristic recovery phase in which there was a transition to genes involved in antigen binding and antibody secretion (IGJ, LOC652694, IGLL1 and MZB1, see Table 4) and genes regulating cell morphogenesis (STRADB, DPYSL5, EPB42, LST1 and MAP1S, see Table 5). Inter-individual variations in the magnitude of transcriptional response at each phase were observed (S2 Fig), and greater variations were seen at the times when the transcriptional responses were strong. The expression profiles for individuals infected with Influenza A and B virus were indistinguishable. Likewise individuals infected with both influenza and rhinovirus were not different from those infected with influenza virus alone. No statistically significant differences in expression of any transcripts were identified that marked the mixed infection group.
A shared host transcriptional response to acute respiratory viral infections
Although there were significant differences in gene expression between the non-influenza virus infection group (e.g. HRV, RSV, coronavirus and enterovirus) and the influenza group (Fig 2D and 2E, S3 Fig), the patterns of the three-phase transcriptional responses were nearly identical, and the differential expression was largely explained by differences in the magnitude of effect. This indicates that the host response to acute respiratory viral infection, despite the distinctive biology of these diverse viruses, is largely conserved. By performing differential expression analysis comparing influenza virus and rhinovirus infection group (Criteria for DEGs were BH-corrected P values < 0.0001), we found that comparing to rhinovirus, influenza virus infection and illnesses induced a larger magnitude and longer duration of activation of interferon signaling pathway, and a greater depression in translation and protein biosynthesis (S4A and S4B Fig, S2 Table). Some of the DEGs encode kinase or kinase inhibitor (e.g. MAPK1, PAK2, CDKN1A and CDKN1B, S4C Fig). Several protein phosphatase encoding genes were also differentially expressed, such as PPM1M, PPP2R4, PPP3CA, etc. However, the magnitudes of differential expression in these genes were small and there were only two transcripts showed |log2 fold-change| >1.5: IFI27 was consistently upregulated in the influenza virus group on days 0–6 but not upregulated in the rhinovirus or other infection groups (Fig 2F); in addition, PI3 was consistently downregulated in the influenza-infected individuals but not in the other groups (Fig 2G). The fold changes of IFI27 and PI3 transcript levels comparing the first day of illness with baseline were also measured by RT-qPCR, and were consistent with the microarray result (S5 Fig).
We also examined the pattern of gene expression in the group of individuals reporting symptoms of acute viral respiratory illness but who were negative in PCR or culture tests for the tested viral pathogens. These individuals had gene expression profiles nearly identical to those observed in the known virus groups, including the acute and recovery phases of gene expression. The transcript levels of IFI27 and PI3 in these subjects were more similar to the non-influenza infection cases. Within this group there was some variability in the magnitude of the transcriptional responses, including large variation in IFI27 and PI3, perhaps suggesting either additional etiologic heterogeneity or incomplete sensitivity of the culture and PCR assays (S3 Fig).
Three subjects had a systemic expression profile consistent with activation of interferon signaling on the day of enrollment (Fig 2D). One of these individuals had persistent elevations of these transcripts throughout the study. One subject reporting illness symptoms did not have the signature of acute systemic response on day 0 but had the typical signature by day 4. The remaining 4 subjects showed ‘off-cycle’ activation profiles consistent with additional intercurrent infections with or without severe symptoms.
Expression changes in lineage and activation state markers reveal increased activated NK cells during the acute phase of influenza infection
We used previously published lineage and activation state marker sets to compute cell type scores for each sample (S3 Table). Lineage specific transcripts lists were obtained and then mapped on to the Illumina array probe identifications. The expression levels of the lineage-specific markers on each day were computed by taking the average of all the influenza-infected individuals. The changes in the expression levels are likely influenced by both the proportion of the cells in the peripheral blood as well as the transcriptional state of those cells. In the acute phase of infection there was a slight depression of lineage markers for NK cells, followed by up-regulation of the marker gene GPR56 on day 2 that became stable by day 21 and thereafter (Fig 3A). The same procedure was used to compute a score for the activation status. Notably, NK cells showed very dramatic increases in activation state during the acute infection but then the activation signature rapidly resolves in the convalescent phase as the infection subsided (Fig 3B). The changes observed in the 2009 cohort were replicated in the 2010 cohort. Our findings of the dramatic activation of NK cells during the early phase are consistent with the observations from influenza-infected mouse lungs [20]. These data show an intense activation of NK cells during the acute phase of infection.
Fig. 3. There is little change in the expression of NK cell lineage markers (A), but a significant increase in NK cell lineage activation genes (B) during the course of influenza. 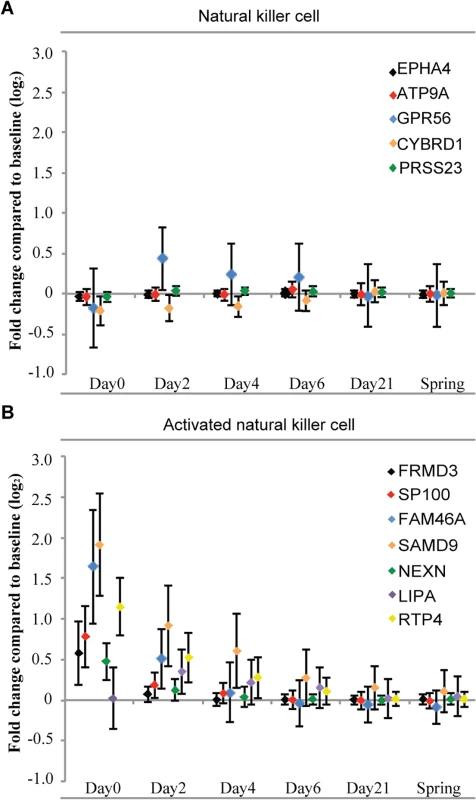
Lineage specific transcripts lists were obtained (S3 Table) and then mapped on to the Illumina array probe identifications. The fold changes of the lineage-specific markers on each day represent the differences to the baseline expression levels on a log2 scale. Error bars show one standard deviation above and below the average of all the influenza-infected individuals. Functional annotation and classification of differentially expressed genes induced by ARIs
After the gene expression status of the peripheral blood cells of influenza-infected individuals were profiled over the time course of illness, we then searched for molecular, cellular and biological processes that best correspond to the host gene expression responses. For this, we analyzed the functional annotation of differentially expressed genes using DAVID gene ontology. Analyses of significant differentially expressed genes on day 0 and day 2 (BH-corrected P value <0.05 in both discovery and validation cohorts) revealed that the upregulated genes were mostly enriched in defense response, response to other organism, response to virus, innate immune response, positive regulation of cytokine production, and positive regulation of tumor necrosis factor production (Fig 4A), while the downregulated genes were involved in translational elongation, translation, cellular protein metabolic process, rRNA binding, and cellular macromolecule biosynthetic process (Fig 4B). The functional interpretation of differentially expressed genes in the recovery phase (day 4 and 6) is much less clear: there are a range of protein metabolic process and regulation of ubiquitin-protein ligase activity functions represented in the upregulated genes (Fig 4A), and actin cytoskeleton organization functions associated with the downregulated genes (Fig 4B), but how these changes may be integrated will require further investigation. We observed a higher level of gene enrichment in the interferon signaling and the tumor necrosis factor production pathway in the acute phase of influenza virus infection compared to rhinovirus infection.
Fig. 4. Top GO terms enriched in differentially expressed genes over the course of 6 days after influenza virus infection. 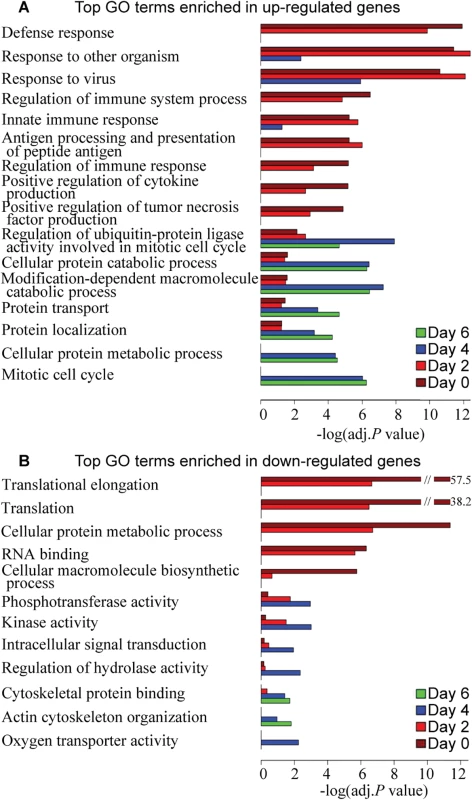
DAVID was used to identify over-represented Gene Ontology terms among (A) up-regulated genes and (B) down-regulated genes on each day (BH-corrected P values <0.05 in both 2009 and 2010 cohorts). The length of the bar (x-axis) represents the–log10 (Benjamini-adj.P value). The bars are colored by day. Pathway enrichment analysis and interaction network of differentially expressed genes in acute and recovery phases of the host response to ARIs
We next examined how biological pathways might be altered during the course of influenza with respect to baseline, by performing separate content analyses of DEGs on day 0 or day 6. We found that upregulated genes in acute influenza virus infection were enriched for canonical pathways specific to interferon signaling (S6A Fig), role of pattern recognition receptors of virus, TREM1 signaling, antigen presentation pathway, activation of IRF by cytosolic pattern recognition receptors. Cellular processes such as dendritic cell maturation and crosstalk between dendritic cells and NK cells were also enriched, indicating the activation of these pathways in acute influenza. On the other hand, the downregulated genes were significantly enriched for pathways related to gene translation and cell proliferation, such as EIF2 signaling, regulation of eIF4 and p70S6K signaling and mTOR signaling. A group of pathways distinct from those seen in the acute phase were enriched in DEGs in the recovery phase (S6B Fig). A large number of upregulated genes in the recovery phase were functioning in the protein ubiquitination pathway. Stress response pathways (e.g. hypoxia signaling in the cardiovascular system and NRF2-mediated oxidative stress response) were also enriched. In addition, significant enrichment in multiple growth factor signaling pathways (e.g. GM-CSF signaling, HGF signaling and PDGF signaling) and cell cycle regulation (e.g. mitotic roles of polo-like kinase) were observed.
Dynamic transcriptional co-expression modules in response to influenza virus infection
Highly co-expressed genes usually share common regulatory mechanisms or participate in the same biological process. To reveal distinct patterns on how host genes are co-expressed in different stages of influenza virus infection, the WGCNA method was applied to the gene expression profiles of samples from the first or second day of illness (day 0), day 2, day 4 and day 6, thereby the network organization is approached through inference of variable gene co-expression patterns and dynamic pathway activity rather than a fixed predefined gene annotations.
We examined the differentially expressed transcripts (BH-corrected P values <0.05 and |log2 Fold-Change| > 0.3 in both cohorts) and detected 6 co-expression modules on day 0 (designated Day 0_1 to Day 0_6) (Table 6). Module Day 0_1 contains genes that are highly upregulated (Fig 5A), and many of them are interferon signaling pathway genes (e.g. IFI6, IFI44L, IFIT1, IFIT3, IRF7 and STAT1). Genes in module Day 0_2 are enriched for translational elongation, the majority of the transcripts in this module are downregulated on day 0 but the transcript levels then gradually increased and became above baseline on day 4 (Fig 5B), suggesting the host translation system was attenuated in the acute phase of influenza but then recovered during the later phase.
Fig. 5. TF networks within the WGCNA modules over the course of influenza illness. 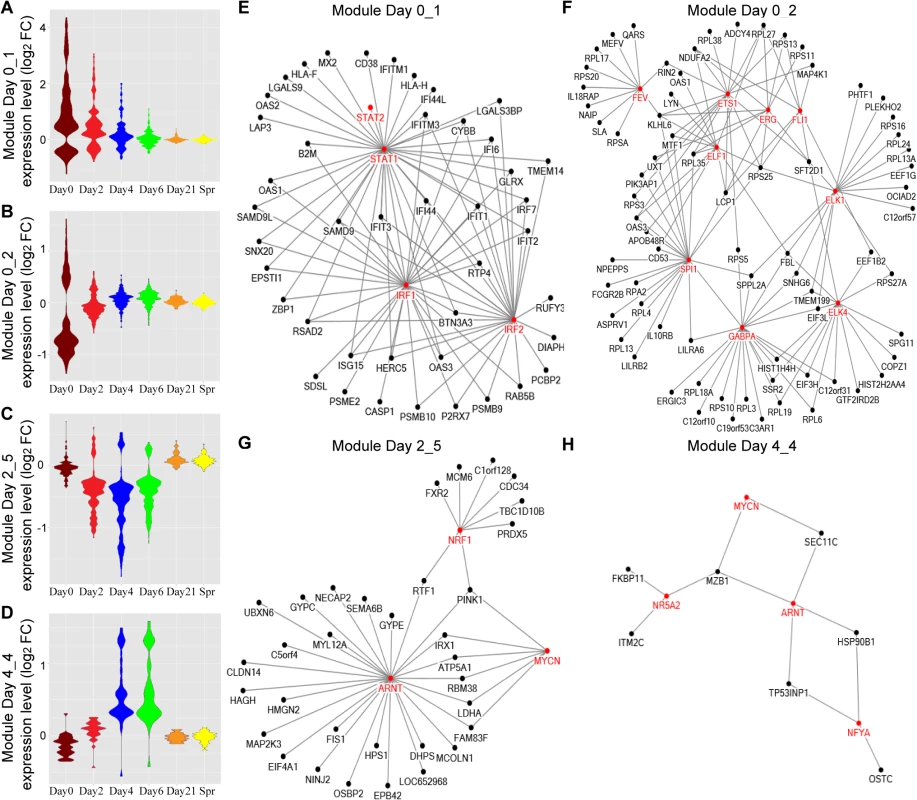
(A-D) Groups, or modules, of co-regulated DEGs were identified by WGCNA. Representative Gene Ontology (GO) categories for each module were identified by functional enrichment analysis and shown in Table 6. Module expression patterns across different time points were represented by violin plots of log2 fold-change in gene expression relative to baseline. (E-H) Pscan was used to scan the promoter regions of all genes in each module and identify the over-represented transcription factor binding sites (TFBS). The predicted transcription factors, which marked in red and their target genes (z-score > 2) were connected by edges in the networks. Tab. 6. GO functional enrichment analysis for the 26 modules detected by WGCNA on different days after influenza virus infection. 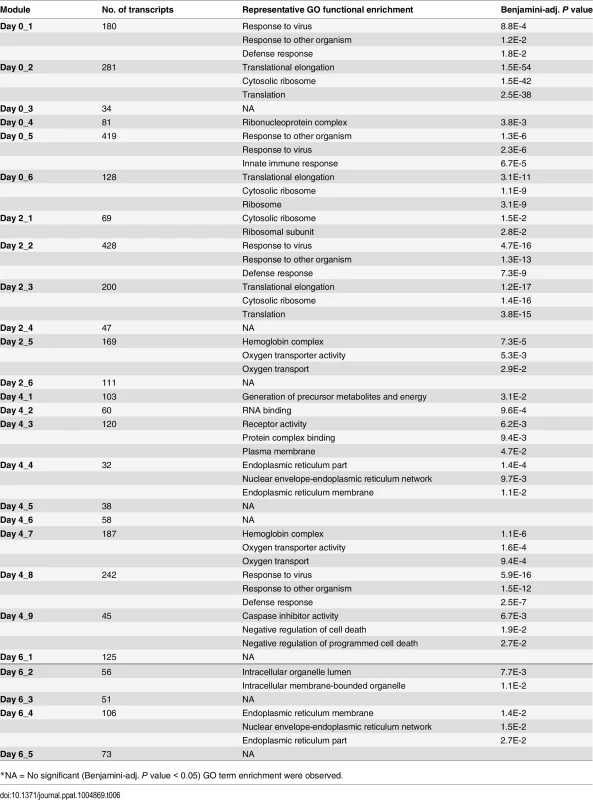
*NA = No significant (Benjamini-adj. P value < 0.05) GO term enrichment were observed. We applied the same method to DEGs identified on day 2, day 4 and day 6 (Table 6). Almost all the GO terms over-represented in day 2 modules were observed on day 0, with the exception of the GO terms enriched in module Day 2_5: Hemoglobin complex / oxygen transport. We found many hemoglobin genes in this module, and their transcript levels were decreased on day 4, including HBD, HBE1, HBG1, HBG2, HBA1, etc (Fig 5C). DEGs on day 4 were grouped into 9 modules and these modules became more diverse in GO term enrichment. A small module Day 4_4 contains some of the top upregulated genes (Fig 5D), such as IGLL1, IGJ, LOC652694, MZB1, which are involved in antibody secretion.
To elucidate transcriptional regulatory networks within each module, we performed transcriptional factor (TF) enrichment analysis using Pscan. The results for module Day 0_1, Day 0_2, Day 2_5 and Day 4_4 are shown in the networks (Fig 5E–5H) with the red nodes representing enriched TFs. Module Day 0_1 is regulated by the TFs in the interferon signaling pathway. Module Day 0_2 involves genes targeted by ETS transcription factor family. Meanwhile, the binding motifs of ARNT and MYCN are enriched in both Module Day 2_5 and Day 4_4. Many genes in these networks contain binding motifs of multiple TFs, implying the TFs are highly coordinated in regulating downstream targets.
An enhanced gene co-expression pattern after influenza virus infection revealed by differential co-expression analysis
Differential co-expression patterns, wherein the level of co-expression of gene groups differs between illness and pre-illness, can arise from an influenza infection-related change in the regulatory mechanism governing that set of genes. We performed differential co-expression analysis on all the genes that are differentially expressed on day 0 in influenza-infected individuals. We found that the correlations between gene expression levels of all the gene pairs are higher on day 0 compared to baseline (Fig 6A). Particularly, the modules 1 in the lower left corner have significant correlation differences between day 0 and baseline, suggesting that the module genes are in the same regulatory network. For example (Fig 6B), the correlation coefficient between the expression levels of OAS2 and RNASEL gene are nearly 0 at baseline, yet they became highly correlated (r = 0.72) on day 0. We computed the correlation coefficients among all gene pairs and plotted the results as a function of the magnitude of correlation or connectivity (Fig 6C). The co-expression patterns among these genes peaked on the first day of illness, gradually weakened thereafter, and become indistinguishable with baseline by day 21. The gene expression correlation also increased, though to a lesser extent, in HRV infection group (S7 Fig).
Fig. 6. Host gene network connectivity became stronger after the subjects were infected with influenza virus. 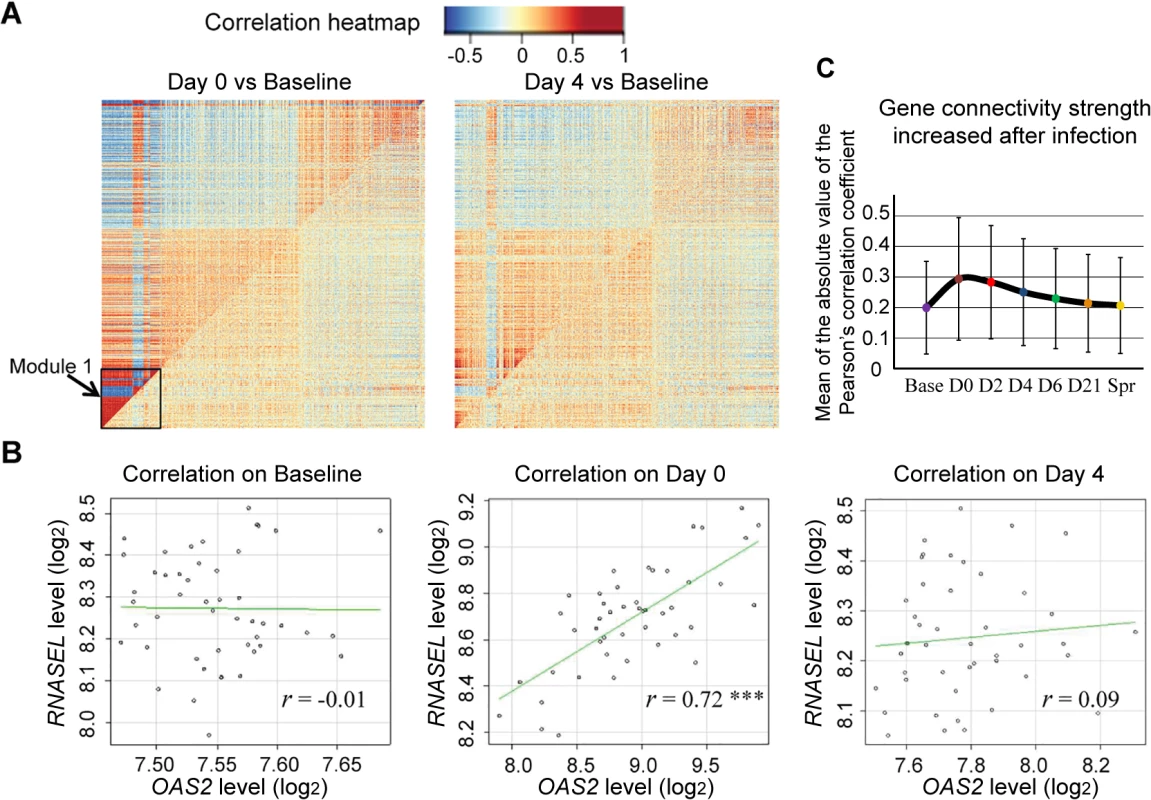
(A) In the comparative correlation heatmap, the upper diagonal of the main matrix shows a correlation between pairs of genes among samples collected from the individuals after influenza virus infection (Left: Day 0, Right: Day 4). The lower diagonal of the heatmap shows a correlation between the same gene pairs in these individuals on baseline. Red color corresponds to positive correlations, and blue corresponds to negative correlations. (B) Changes in the correlation between genes OAS2 and RNASEL. Each dot corresponds to an individual and the axes mark the log2 expression values of the two transcripts in that individual. The genes are uncorrelated on baseline (r = -0.01) but are positively correlated on day 0 (r = 0.72, P <0.001), and this correlation became attenuated on day 4 (r = 0.09). Genes that show evidence of correlation between gene expression and the magnitude of the antibody response
We measured serum antibody to the pH1N1 viruses in all subjects at enrollment and after surveillance for illness [5, 6], and thus were able to record the magnitude of antibody response (delta H1N1 titers). We wished to identify the genes whose transcripts levels are correlated with antibody response. The Day 0 transcript levels of 2119 DEGs were tested for their correlation with the delta antibody titers among 58 ill subjects with H1N1 infection. We found that a total of 229 genes showed evidence of significant correlation between gene expression on the first day of illness and the antibody response (Fig 7, S4 Table). Of these, 168 showed evidence of positive correlation and 61 of negative correlation. LILRB4 (Leukocyte immunoglobulin-like receptor subfamily B member 4) showed most significant positive correlation, and a member of the forkhead transcription factors, FOXO3 exhibited most significant negative correlation. Content analysis revealed that immune response (GO:0006955) were most enriched in the genes showed positive correlation with antibody response (e.g. OAS1, CD14, APOBEC3G, IFITM3 and LILRB4). B-cell proliferation genes (e.g. CD40, SASH3, CDKN1A and TICAM1) were strongly correlated with high antibody response. Genes that showed negative correlation (e.g. FOXO3, DAPK2, SGK1, and TP53INP1) were enriched for apoptosis and programmed cell death pathways (GO:0012501).
Fig. 7. A total of 229 genes showed evidence of significant correlation between gene expression and the antibody response. 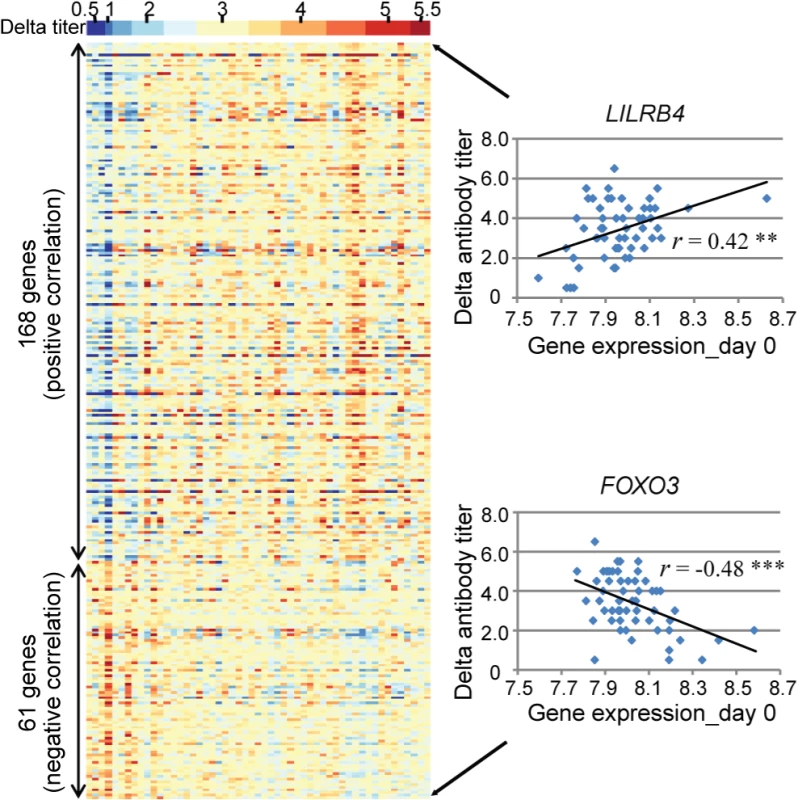
(Left) Each individual is represented by a column in the heatmaps. The top heatmap displays the magnitude of the antibody response (delta titer). The bottom heatmaps display the deviations around the expression mean for each transcript. (Right) LILRB4 showed the greatest positive correlation (r = 0.42, P <0.005) and FOXO3 showed the greatest negative correlation (r = -0.48, P <0.001) between gene expression on day 0 and the magnitude of the antibody response to influenza virus infection. Discussion
This prospective study of 2009 pandemic influenza A virus infections and illnesses in healthy adults in a university community detected clear gene expression patterns correlating with moderate influenza. Transcriptional profiles for ill subjects were examined at 7 time points, including baseline, the first day of illness and up to 21 days after as well as after the influenza season. The aim of this study was to use an unbiased genome-wide approach to identify genes whose expression is regulated by occurrence of an ARI and networks that are activated in the host response to infectious stimuli during different stages of an acute respiratory viral illness.
The results show a gene expression signature that strongly corresponds to influenza virus infection. Components of interferon pathway and innate immunity (IFI44L, IFITM3, MX1, IRF7, OAS2, STAT2, etc.) are significantly upregulated in the acute phase of infection, while the expression levels of genes involved in translational elongation and protein biosynthesis are decreased. Other researchers have identified host gene expression patterns that are associated with viral infection in human airway epithelial cells [17] and bronchial epithelial cells [28]. DEGs in type I interferon or STAT1 signaling were similar to those found in our current study. In particular, IFI27, an antiviral molecule that regulates interferon-mediated apoptosis, was the most highly up-regulated gene in these studies [14,17]. Our study identified IFI27 and PI3 as the most differentially expressed genes comparing influenza virus and rhinovirus infections. IFI27 up-regulation was observed in hospitalized infants with RSV bronchiolitis [36], yet it was not seen in the three healthy adults infected with RSV in our study. PI3 (peptidase inhibitor 3) encodes elafin, a potent neutrophil elastase inhibitor, localized to the injury sites in the lung [37]. PI3 protein was shown to possess antimicrobial and anti-inflammatory activities [38]. Its mechanism of action is, however, poorly understood and down-regulation of PI3 has been reported previously in patients with acute respiratory distress syndrome (ARDS) [39], but not in studies of viral infections.
A key finding in this study was a recovery phase that involves differential expression of a set of genes distinct from those observed in the acute phase of infection. Molecular characterization of a recovery phase has not been previously reported and the functions in the immune response of most of the differentially expressed genes are much less clear. Protein ubiquitination pathways and protein metabolic process are associated with the genes upregulated in the recovery phase. Symptomatic influenza cases exhibited extensive regulation in multiple growth factor signaling and cell proliferation pathways during the recovery phase. How these results may be integrated will require further investigation.
Comparison of influenza and rhinovirus illnesses indicated that the intensity of the increase in activation of the interferon and innate immunity pathways is less in rhinovirus infections. In addition to IFI27 and PI3 that have the largest expression difference between influenza and HRV, CDKN1A and CDKN1C, which are essential genes involved in cell cycle control, appeared to be differentially expressed specifically in influenza virus infection. It has been reported that influenza virus infection induced cell cycle arrest in G1/S phase [40], and the transcriptional reprogramming of cell cycle correlated with the severity of influenza illness [41]. The differences in host transcriptional response to influenza virus and rhinovirus infection might be explained by the fact that influenza virus replicates in the nucleus of host cells while HRV replicates in cytoplasm [42], or explained by the distinct viral mechanisms in histone modification [22]. Individuals who did not have an identified pathogen associated with illness had conserved systemic expression signatures that were indistinguishable from the influenza and rhinovirus groups, with a large variation in the intensity of transcriptional response. This suggests that they were actually infected with one of the respiratory viruses for which we tested but which was not detected, or that they had an infection with another infectious agent that induces a similar transcriptional response. This question will be the subject of future investigation using highly sensitive next generation sequencing methods.
The finding of ‘out of cycle’ individuals suggests that there are many subclinical infections or other subclinical disorders in healthy adults. Given that acute viral infection stimulates gene pathways known to be involved in adult onset autoimmune disorders raises the possibility that the number and intensity of infections may alter risk in genetically susceptible individuals. One individual exhibited activation at all time points. This may represent a systemic disorder, a possibility that is now being examined in that subject. This suggests the possibility that gene expression profiles may be used in the detection of such disorders as an adjunct to standard immunological testing.
We used weighted gene co-expression network analysis (WGCNA) to cluster the DEGs detected on day 0 –day 6 into 26 modules. This module construction strategy takes advantage of the biological variability inherent in the prospective cohort study in order to uncover the modular organization and function of transcriptional systems. The time-course transcriptional profiles make it possible to study the transcriptional regulation of these gene co-expression networks during different phases of influenza illness. While GO terms enriched in the acute phase modules are “response to virus” and “translational elongation”, recovery phase modules are over-represented in a new set of GO terms, such as “endoplasmic reticulum part”, and “programmed cell death”. We also found the hemoglobin genes in module Day 2_5 (e.g. HBD, HBE1, HBG1) are downregulated in response to influenza virus infection, however, whether this is due to true transcriptional regulation, or a decrease in their percentage in comparison to the white cells will need further investigation. Furthermore, the TF regulatory networks in 4 modules were uncovered, which provides better insights to the underlying mechanisms of host response to ARIs and will facilitate drug and vaccine development.
Our study went beyond gene co-expression and investigated the differential co-expression patterns in influenza virus and rhinovirus infections. The idea behind this is that the identification of changes in gene co-expression patterns between illness and baseline samples could provide information about infection-affected regulatory networks. Our result demonstrates that the gene expression correlations are enhanced on a global scale in the response to ARI; a small module containing 273 transcripts has the largest increase in network connectivity strength. This suggests qualitative change in the gene network upon an infectious stimulus.
We know there are several cell-types in whole blood sample and the proportion of these cell-types varies across samples, so it is possible that the co-expression modules were driven by variation in markers for various cell-types. However, the differences in gene expression correlation between baseline and the first day of illness are so large that it cannot be fully explained by the variation in the expression values of the cell lineage markers, which does not change much between baseline and illness. Thus, the changes in regulatory mechanisms are the major contributor to the differential co-expression patterns.
The pandemic influenza A/H1N1 virus emerged in April 2009 and was the dominant influenza virus circulating in humans in our study periods. By measuring the H1N1 antibody titers on the same individual before and after the influenza season, we were able to record the magnitude of antibody response (delta H1N1 titers) and account for individual variation in a way that would not have been possible otherwise. We identified 229 genes whose transcriptional levels were correlated with the antibody response. Although the sample size we had for the correlation analysis is relatively small, over 1/3 of the genes identified in this study have previously been shown to be correlated with antibody response to influenza vaccination [24]. B cell proliferation genes, which predict influenza vaccine-induced antibody response [23], were also correlated with the antibody response to naturally occurring influenza infection. These findings provide more insight into the molecular mechanisms of antibody production and secretion, and may also contribute to influenza vaccine development.
Several limitations of this study are noteworthy. First, we studied two cohorts of healthy young adults. Those subjects who subsequently developed influenza-like illness had moderate symptoms [5]. Children, the elderly, were not included and, fortunately, none of the research subjects developed severe illnesses. Second, this study did not allow analysis of the subjects who had influenza infection without symptoms. Based on seroconversion rates, 38% of the subjects were probably infected with influenza A H1N1 but did not have symptoms sufficient to trigger a follow up study visit. Third, all the subjects with influenza-illness enrolled in year 2009–2010 were infected with influenza A H1N1. And in year 2010–2011, only 9 were infected with influenza B and 3 were infected with influenza A H3N2, all the others were infected with H1N1 infection. Thus the sample size was not sufficient for comparing host transcriptional response to influenza A H1N1, H3N2 and influenza B. Fourth, the transcriptional responses to infection of cells residing in the secondary immune tissues, like lymph nodes or spleen, might be different from that of peripheral blood. Future research may investigate the correlations of gene expression between cells residing in different tissues. Finally, while antibody titers have been used to assess humoral immune responses, it is clear that they do not capture the complexity of the host response to ARIs. Additional studies would be necessary to establish the causal relationship between the genes identified and the antibody response, and whether they also regulate cytokine or chemokine levels.
Despite these limitations, the findings in this study demonstrate the power of serial measurements of gene expression, within the context of a prospective clinical trial, to identify candidate genetic mechanisms that determine responses to infection. We have genotyped all these research subjects and have begun analyzing the impact of common genetic variation on the gene expression patterns. Because we have made repeated measurements on the same individual over time, we should be able to account for the effect of person in a way that would not have been possible using cross-sectional methodologies. The dynamic nature of the measurements should also allow the identification of genetic effects that are either enhanced by or only evident after the strong perturbation of acute infection.
Materials and Methods
Ethics statement
The study was conducted at Texas A&M University, College Station, TX. The protocol and informed consent were approved by the Baylor College of Medicine and Texas A&M University institutional review boards before the study began. Healthy adults age 18 to 49 at the college and in the community were invited to enroll to be followed for acute respiratory illness (ARI) through two consecutive influenza seasons 2009–2010 and 2010–2011. All adult subjects provided written informed consent.
Human subjects
After subjects provided consent, a medical history was taken to ensure good health, and baseline specimens were obtained. Surveillance for influenza began during the September 2009 enrollment period because pH1N1 as a cause of influenza was identified in the population during enrollment. Subjects were given thermometers and instructions to call and report for evaluation within 48 hours of onset for any ARI (Fig 1A). Except for the Thanksgiving holiday period and 4 weeks of the Christmas holiday period, a coordinator and physician enrolled persons presenting within 48 hours of onset with a new ARI with fever or that caused them to miss school, work, or social activities. Specimens were obtained and medical care was provided, including the antiviral zanamivir if indicated. Enrolled persons were seen 2, 4, and 6 days later for repeat evaluation, specimen collections, and medical care and 21 days later for collection of convalescent specimens. These subjects are those included in the present report. Surveillance for influenza was terminated after 5.5 months; all subjects were asked to return for specimen collection and to provide a medical and ARI history. The study was repeated 2010–2011 with surveillance for influenza limited to January to April as community surveillance did not detect influenza before the Christmas break.
Illnesses
A study physician obtained an oral temperature, completed a symptom survey, and performed a respiratory system examination at each illness visit. All cases were classified as clinically moderate using standard criteria.
Serology
Serum specimens obtained at enrollment, acute and convalescent visits for illnesses, and the terminal visit were tested simultaneously using hemagglutination-inhibition (HAI) antibody tests following previously described methods. Virus antigens were a locally obtained pH1N1 virus (A/Baylor/09) and the most recently prevalent seasonal A/H1N1 virus (A/Brisbane/59/07), A/H3N2 virus (A/Perth/16/09), and B virus (B/Brisbane/60/08).
Virus infections
A combined 8-mL nasal wash and throat swab specimen was collected at each illness visit. Specimens from the day 0 and 2 visits were tested for all respiratory viruses in tissue cultures. All specimens were also tested by reverse-transcriptase polymerase chain reaction (RT-PCR) for respiratory viruses including influenza A, pH1N1 influenza, influenza B, picornavirus/rhinovirus, respiratory syncytial virus, human metapneumovirus, parainfluenza viruses, coronaviruses, and adenoviruses.
RNA purification from peripheral whole blood
We collected peripheral whole blood samples (2.5 mL) in PAXgene RNA stabilization tubes (QIAGEN Inc., Valencia, CA, U.S.A.) at each visit of those enrolled for illness and froze the samples at—80°C until RNA purification to minimize gene expression changes induced by handling and processing. RNA purification was performed using the PAXgene Blood RNA system (QIAGEN Inc., Valencia, CA) according to manufacturer’s instructions. Quality control of RNA samples was performed using spectrophotometry (NanoDrop-1000 Spectrophotometer, Thermo Fisher Scientific, Waltham, MA, U.S.A.) and microfluidic electrophoresis (Experion Automated Electrophoresis System, Bio-Rad Laboratories, Hercules, CA).
Gene expression profiling
cRNA synthesis
We performed in vitro transcription assay on all peripheral whole blood RNA samples prior to chip hybridization. Ambion Illumina TotalPrep RNA Amplification Kits for 24 reactions (Applied Biosystems/Ambion, Austin, TX) were used according to the manufacturer’s protocol. Briefly, 11uL of 50ng/uL total RNA was reverse-transcribed with an oligo(dT) primer bearing a T7 promoter, using ArrayScript reverse transcriptase (RT). The cDNA then went through second strand synthesis to produce the template for in vitro transcription with T7 RNA Polymerase. MEGAscript in vitro transcription (IVT) and biotin UTP (provided in the kit), were used to generate biotinylated, antisense RNA copies (cRNA) of each mRNA in a sample from the template cDNA. cRNA samples were eluted once using 40 uL nuclease-free water. Spectrophotometry (NanoDrop-1000 Spectrophotometer, Thermo Fisher Scientific, Waltham, MA, U.S.A.) and microfluidic electrophoresis (Experion Automated Electrophoresis System, Bio-Rad Laboratories, Hercules, CA) were performed to QC samples before hybridization onto Illumina Human HT-12v4 Expression BeadChips (Illumina, San Diego, CA).
Illumina Expression BeadChip Assay
Biotin-labeled RNA (cRNA) was hybridized to Illumina Human HT-12v4 Expression BeadChips (Illumina, San Diego, CA) according to the manufacturer’s protocol and scanned on an Illumina iScan Reader (Illumina, San Diego, CA). The initial standard quality control thresholds were imposed on the raw intensity signals of the microarray using the iScan Control Software (Illumina, San Diego, CA). Microarrays which failed this QC step were excluded from the analysis.
Microarray data processing
Initial quality control of the signal intensity data was performed on the transcript probes in the microarray using the algorithms in the lumi package in R statistical software, version 2.14.1 [43]. Integration of raw probe profiles was carried in GenomeStudio software (Illumina). Background adjustment, variance stabilization transformation, and rank invariant normalization were carried out using corresponding functions in the R package lumi. A detection p-value cut-off of 0.05 was imposed on the normalized intensities to consider a transcript as detected. All differential expression analyses were restricted to 17,708 transcript probes in the microarray with detection P values ≤ 0.05 in at least 70% of the samples.
Differential gene expression analyses
All statistical analyses on the gene expression data were performed in R Statistical Software [44], version 2.14.1. Differential gene expression analyses with cell composition covariates contrasting the individual day-specific data with the baseline sample obtained at the time of enrollment were performed using function for linear model fitting in the limma R package [45]. The significance of differences in gene expression was tested using a Bayes moderated t-test [46]. Correction for multiple testing was addressed by controlling the false discovery rate (FDR) using the Benjamini and Hochberg (B.H.) method. A transcript probe was considered significantly differentially expressed if the B.H. corrected P value was < 0.05. The heatmap function in R Statistical Software was used to generate a heatmap of mean-centered normalized expression values.
Cell decomposition analysis
Gene expression profiles were investigated for correlation with cell composition in the whole blood. Cell lineage and activation state markers were used as described in Abbas et al [47]. A full list of marker genes we used to compute the cell scores is provided in S1 Table. Cell lineage scores for all individuals were obtained by taking the first Principal Component (PC1) of average-normalized expression values for each of the lineage-specific gene sets. [When this method was used to compute the cell scores for the 121 subjects whose whole blood transcriptional profile and Complete Blood Count (CBC) are publicly available at Gene Expression Omnibus (GEO accession: GSE30119), the resulting expression-based lymphocyte and neutrophil scores showed a high correlation (r2 = 0.64 and 0.65, respectively) with actual measurements of percent lymphocyte and neutrophil in the CBC (S8 Fig).] Neutrophil and lymphocyte scores were then introduced as quantitative covariates in the linear models of the differential expression analyses to account for the differences in cellular composition between individuals.
Real-time PCR
TaqMan (Applied Biosystems, Foster City, CA) quantitative real-time reverse transcriptase polymerase chain reaction (RT-PCR) was performed on baseline and Day 0 paired RNA samples from 18 randomly selected subjects with influenza infection only and 11 subjects with rhinovirus infection only. cDNA was first synthesized from approximately 2 ug of total RNA in a 20-ul reaction volume using the High Capacity RNA to cDNA kit (Applied Biosystems). TaqMan probes, available as “Assay on Demand”, were used in the analyses of the expression levels of 2 target genes, IFI27 (Hs01086373_g1) and PI3 (Hs00160066_m1), as well as endogenous control gene GAPDH (Hs03929097_g1). Quantitative RT-PCR was performed on 1ul of cDNA in triplicates with the CFX96 Touch Real-Time PCR Detection System (Bio-Rad, Hercules, CA). The fold increase in mRNA expression was determined using the ΔΔCT method with the baseline sample of each pair as calibrators.
Functional enrichment and pathway analysis
Gene lists were analyzed using Ingenuity Pathway Analysis (IPA) software and DAVID Ontology (http://www.david.abcc.ncifcrf.gov) to identify significantly enriched pathways. Expressed genes represented in the full dataset were used as the background. The Biological Process, Molecular Function and Cellular Component subsets of the Gene Ontology (GO) were used for enrichment analysis. DAVID Ontology uses t-test to derive P values and applies the Benjamini-Hochberg method to correct for multiple testing. IPA uses a right-tailed Fisher’s exact test to derive P values for identifying significantly overrepresented pathways. A smaller P value indicates the overrepresentation of a pathway or a GO term by the DEGs is less likely due to random chance.
De-novo network (module) analysis
To identify groups of host transcripts that showed coordinated regulation in response to acute illness, we applied the weighted gene co-expression network analysis (WGCNA) [29]. The WGCNA method constructs networks or modules consisting of groups of genes that are highly correlated across a set of samples. Briefly, the absolute value of the Pearson correlation coefficient is calculated for all pairwise comparisons of gene-expression values. The Pearson correlation matrix is then weighted and transformed into an adjacency matrix. WGCNA uses the topological overlap matrix based dissimilarity measure as input of hierarchical clustering. A dendrogram (cluster tree) of the network is then obtained from hierarchical clustering. Finally, modules are defined by cutting branches off the dendrogram. WGCNA was performed using the WGCNA package provided in R software.
Transcription factor binding site motifs enrichment analysis
JASPAR is an open-access database (http://jaspar.cgb.ki.se) derived exclusively from sets of nucleotide sequences experimentally demonstrated to bind transcription factors. Transcription factor binding specificity is represented by position-specific scoring matrices (PSSM) in JASPAR. Employing the profiles available in JASPAR, Pscan (http://www.beaconlab.it/pscan) scans a set of sequences (promoters positions -450 to +50 with respect to the transcription start site) from co-regulated or co-expressed genes and identifies the enriched transcription factor binding site motifs by comparing the average matching value of the matrix on the sequences analyzed and that on the whole promoter set (same set of regions with respect to the transcription start site) of the same organism. Z-test was used to derive P values and Bonferroni method was applied to correct for multiple testing.
Differential co-expression analysis
All the transcripts showed differential expression on Day 0 were used in the differential co-expression analysis (DiffCoExpr) [31]. To detect changes in correlations between gene pairs within module and also between pairs of modules during ARIs, DiffCoExpr, an untargeted approach in which gene modules are not pre-defined, was carried out for each day contrasted with the baseline. Briefly, an adjacency matrix as the Spearman correlation coefficients for all pairs of genes was built for each day and baseline. Then, the correlation changes on each day compared to baseline were quantified by the difference between signed squared correlation coefficients. Finally, the Topological Overlap based dissimilarity matrix was derived from the adjacency change matrix, and was used as input for gene clustering and module detection.
Supporting Information
Zdroje
1. World Health Organization. (2009) Seasonal Influenza: World Health Organization.
2. Centers for Disease Control and Prevention: Seasonal Influenza. (2013) http://www.cdc.gov/flu/about/qa/disease.htm
3. Molinari NM, Ortega-Sanchez IR, Messonnier ML, Thompson WW, Wortley PM, et al. (2007) The annual impact of seasonal influenza in the US: measuring disease burden and costs. Vaccine 25(27): 5086–96. 17544181
4. Garten RJ, Davis CT, Russell CA, Shu B, Lindstrom S, et al. (2009) Antigenic and genetic characteristics of swine-origin 2009 A(H1N1) influenza viruses circulating in humans. Science 325(5937): 197–201. doi: 10.1126/science.1176225 19465683
5. Couch RB, Atmar RL, Franco LM, Quarles JM, Niño D, et al. (2012) Prior infections with seasonal influenza A/H1N1 virus reduced the illness severity and epidemic intensity of pandemic H1N1 influenza in healthy adults. Clin Infect Dis 54(3): 311–7. doi: 10.1093/cid/cir809 22075792
6. Couch RB, Atmar RL, Franco LM, Quarles JM, Wells J, et al. (2013) Antibody correlates and predictors of immunity to naturally occurring influenza in humans and the importance of antibody to the neuraminidase. J Infect Dis 207(6): 974–81. doi: 10.1093/infdis/jis935 23307936
7. Takeuchi O, Akira S. (2009) Innate immunity to virus infection. Immunol Rev 227 : 75–86. doi: 10.1111/j.1600-065X.2008.00737.x 19120477
8. Pichlmair A, Reise SC. (2007) Innate recognition of viruses. Immunity 27 : 370–383.
9. Haller O, Weber F. (2009) The interferon response circuit in antiviral host defense. Verh K Acad Geneeskd Belg 71 : 73–86. 19739399
10. Kohlmeier JE, Woodland DL. (2009) Immunity to respiratory viruses. Annu Rev Immunol 27 : 61–82. doi: 10.1146/annurev.immunol.021908.132625 18954284
11. McGill J, Heusel JW, Legge KL. (2009) Innate immune control and regulation of influenza virus infections. J Leukoc Biol 86 : 803–812.
12. Gazit R, Gruda R, Elboim M, Arnon TI, Katz G, et al. (2006) Lethal influenza infection in the absence of the natural killer cell receptor gene Ncr1. Nat Immunol 7(5): 517–23. 16565719
13. Chaussabel D, Pascual V, Banchereau J. (2010) Assessing the human immune system through blood transcriptomics. BMC Biology 8 : 84.
14. Zaas AK, Chen M, Varkey J, Veldman T, Hero AO 3rd, et al. (2009) Gene expression signatures diagnose influenza and other symptomatic respiratory viral infections in humans. Cell Host Microbe 6 : 207–17. doi: 10.1016/j.chom.2009.07.006 19664979
15. Thach DC, Agan BK, Olsen C, Diao J, Lin B, et al. (2005) Surveillance of transcriptomes in basic military trainees with normal, febrile respiratory illness, and convalescent phenotypes. Genes Immun 6 : 588–95. 16034474
16. Ramilo O, Allman W, Chung W, Mejias A, Ardura M, et al. (2007) Gene expression patterns in blood leukocytes discriminate patients with acute infections. Blood 109(5): 2066–77. 17105821
17. Ioannidis I, McNally B, Willette M, Peeples ME, Chaussabel D, et al. (2012) Plasticity and virus specificity of the airway epithelial cell immune response during respiratory virus infection. J Virol 86(10): 5422–36. doi: 10.1128/JVI.06757-11 22398282
18. Parnell GP, McLean AS, Booth DR, Armstrong NJ, Nalos M, et al. (2012) A distinct influenza infection signature in the blood transcriptome of patients who presented with severe community acquired pneumonia. Crit Care 16(4): R157. doi: 10.1186/cc11477 22898401
19. Bacasas KL, Franco LM, Shaw CA, Bray MS, Wells JM, et al. (2011) Early patterns of gene expression correlate with the humoral immune response to influenza vaccination in humans. J Infect Dis 203(7): 921–9. doi: 10.1093/infdis/jiq156 21357945
20. Pommerenke C, Wilk E, Srivastava B, Schulze A. (2012) Global transcriptome analysis in influenza-infected mouse lungs reveals the kinetics of innate and adaptive host immune responses. PLoS One 7(7):e41169. doi: 10.1371/journal.pone.0041169 22815957
21. Huang Y, Zaas AK, Rao A, Dobigeon N, Woolf PJ, et al. (2011) Temporal dynamics of host molecular responses differentiate symptomatic and asymptomatic influenza a infection. PLoS Genet 7(8):e1002234. doi: 10.1371/journal.pgen.1002234 21901105
22. Menachery VD, Eisfeld AJ, Schäfer A, Josset L, Sims AC, et al. (2014) Pathogenic influenza viruses and coronaviruses utilize similar and contrasting approaches to control interferon-stimulated gene responses. MBio 5(3):e01174–14. doi: 10.1128/mBio.01174-14 24846384
23. Tan Y, Tamayo P, Nakaya H, Pulendran B, Mesirov JP, et al. (2014) Gene signatures related to B-cell proliferation predict influenza vaccine-induced antibody response. Eur J Immunol 44(1):285–95. doi: 10.1002/eji.201343657 24136404
24. Franco LM, Bucasas KL, Wells JM, Niño D, Wang X, et al. (2013) Integrative genomic analysis of the human immune response to influenza vaccination. Elife 2:e00299 doi: 10.7554/eLife.00299 23878721
25. Poland GA, Ovsyannikova IG, Jacobson RM. (2008) Immunogenetics of Seasonal Influenza Vaccine Response. Vaccine 26(Suppl 4): D35–D40. 19230157
26. Zhang B, Horvath S. (2005) A general framework for weighted gene co-expression network analysis. Stat Appl Genet Mol Biol 4: Article17.
27. Ferris MT, Aylor DL, Bottomly D, Whitmore AC, Aicher LD, et al. (2013) Modeling host genetic regulation of influenza pathogenesis in the collaborative cross. PLoS Pathog 9(2): e1003196. doi: 10.1371/journal.ppat.1003196 23468633
28. Li C, Bankhead A 3rd, Eisfeld AJ, Hatta Y, Jeng S, et al. (2011) Host regulatory network response to infection with highly pathogenic H5N1 avian influenza virus. J Virol 85(21): 10955–67. doi: 10.1128/JVI.05792-11 21865398
29. Langfelder P, Horvath S. (2008) WGCNA: an R package for weighted correlation network analysis. BMC Bioinformatics 9 : 559. doi: 10.1186/1471-2105-9-559 19114008
30. Wang E, Marincola FM. (2008) Bottom Up: A Modular View of Immunology. Immunity 29(1): 9–11.
31. Tesson B, Breitling R, Jansen R. (2010) DiffCoEx: a simple and sensitive method to find differentially coexpressed gene modules. BMC Bioinformatics 11 : 497.
32. Amar D, Safer H, Shamir R. (2013) Dissection of Regulatory Networks that Are Altered in Disease via Differential Co-expression. PLoS Comput Biol 9(3): e1002955. doi: 10.1371/journal.pcbi.1002955 23505361
33. Fuente A. (2010) From ‘differential expression’ to ‘differential networking’–identification of dysfunctional regulatory networks in diseases. Trends in Genetics 26 : 326–33. doi: 10.1016/j.tig.2010.05.001 20570387
34. Douglas RG Jr, Alford RH, Cate TR, Couch RB. (1966) The leukocyte response during viral respiratory illness in man. Ann Intern Med 64(3): 521–30. 4286006
35. McClain MT, Park LP, Nicholson B, Veldman T, Zaas AK, et al. (2013) Longitudinal analysis of leukocyte differentials in peripheral blood of patients with acute respiratory viral infections. J Clin Virol 58(4):689–95. doi: 10.1016/j.jcv.2013.09.015 24140015
36. Bucasas KL, Mian AI, Demmler-Harrison GJ, Caviness AC, Piedra PA, et al. (2013) Global gene expression profiling in infants with acute respiratory syncytial virus broncholitis demonstrates systemic activation of interferon signaling networks. Pediatr Infect Dis J 32(2): e68–76. doi: 10.1097/INF.0b013e318278b4b3 23190772
37. Roghanian A, Williams SE, Sheldrake TA, Brown TI, Oberheim K, et al. (2006) The antimicrobial/elastase inhibitor elafin regulates lung dendritic cells and adaptive immunity. Am J Respir Cell Mol Biol 34(5): 634–42. 16424380
38. Verrier T, Solhonne B, Sallenave JM, Garcia-Verdugo I. (2012) The WAP protein Trappin-2/Elafin: a handyman in the regulation of inflammatory and immune responses. Int J Biochem Cell Biol 44(8): 1377–80. doi: 10.1016/j.biocel.2012.05.007 22634606
39. Wang Z, Beach D, Su L, Zhai R, Christiani DC. (2008) A genome-wide expression analysis in blood identifies pre-elafin as a biomarker in ARDS. Am J Respir Cell Mol Biol 38(6): 724–32. doi: 10.1165/rcmb.2007-0354OC 18203972
40. He Y, Xu K, Keiner B, Zhou J, Czudai V, et al. (2010) Influenza A Virus Replication Induces Cell Cycle Arrest in G0/G1 Phase. J Virol 84(24):12832–40. doi: 10.1128/JVI.01216-10 20861262
41. Parnell G, McLean A, Booth D, Huang S, Nalos M, et al. (2011) Aberrant cell cycle and apoptotic changes characterise severe influenza A infection—a meta-analysis of genomic signatures in circulating leukocytes. PLoS One 6(3):e17186. doi: 10.1371/journal.pone.0017186 21408152
42. Wagner EK, Hewlett MJ, Bloom DC, Camerini D. The Beginning and End of the Virus Replication Cycle. In: Basic Virology. 3rd ed. New York: Wiley-Blackwell; 2007.
43. Du P, Kibbe WA, Lin SM. (2008) lumi: a pipeline for processing Illumina microarray. Bioinformatics 24(13):1547–8. doi: 10.1093/bioinformatics/btn224 18467348
44. R Development Core Team. (2008) R: A language and environment for statistical computing. R Foundation for Statistical Computing, Vienna, Austria ISBN 3-900051-07-0, URL http://www.R-project.org.
45. Wettenhall JM, Smyth GK. (2004) limmaGUI: a graphical user interface for linear modeling of microarray data. Bioinformatics 20(18):3705–6. 15297296
46. Smyth GK. Linear models and empirical bayes methods for assessing differential expression in microarray experiments. Stat Appl Genet Mol Biol. 2004; 3:Article3.
47. Abbas AR, Wolslegel K, Seshasayee D, Modrusan Z, Clark HF. (2009) Deconvolution of blood microarray data identifies cellular activation patterns in systemic lupus erythematosus. PLoS One 4(7):e6098. doi: 10.1371/journal.pone.0006098 19568420
Štítky
Hygiena a epidemiologie Infekční lékařství Laboratoř
Článek Clearance of Pneumococcal Colonization in Infants Is Delayed through Altered Macrophage TraffickingČlánek An Model of Latency and Reactivation of Varicella Zoster Virus in Human Stem Cell-Derived NeuronsČlánek Protective mAbs and Cross-Reactive mAbs Raised by Immunization with Engineered Marburg Virus GPsČlánek Specific Cell Targeting Therapy Bypasses Drug Resistance Mechanisms in African TrypanosomiasisČlánek Peptidoglycan Branched Stem Peptides Contribute to Virulence by Inhibiting Pneumolysin ReleaseČlánek HIV Latency Is Established Directly and Early in Both Resting and Activated Primary CD4 T CellsČlánek Sequence-Specific Fidelity Alterations Associated with West Nile Virus Attenuation in Mosquitoes
Článek vyšel v časopisePLOS Pathogens
Nejčtenější tento týden
2015 Číslo 6- Stillova choroba: vzácné a závažné systémové onemocnění
- Perorální antivirotika jako vysoce efektivní nástroj prevence hospitalizací kvůli COVID-19 − otázky a odpovědi pro praxi
- Diagnostika virových hepatitid v kostce – zorientujte se (nejen) v sérologii
- Jak souvisí postcovidový syndrom s poškozením mozku?
- Familiární středomořská horečka
-
Všechny články tohoto čísla
- Introducing “Research Matters”
- Exploring Host–Pathogen Interactions through Biological Control
- Analysis of Bottlenecks in Experimental Models of Infection
- Expected and Unexpected Features of the Newly Discovered Bat Influenza A-like Viruses
- Clearance of Pneumococcal Colonization in Infants Is Delayed through Altered Macrophage Trafficking
- Recombinant Murine Gamma Herpesvirus 68 Carrying KSHV G Protein-Coupled Receptor Induces Angiogenic Lesions in Mice
- TRIM30α Is a Negative-Feedback Regulator of the Intracellular DNA and DNA Virus-Triggered Response by Targeting STING
- Targeting Human Transmission Biology for Malaria Elimination
- Two Cdc2 Kinase Genes with Distinct Functions in Vegetative and Infectious Hyphae in
- An Model of Latency and Reactivation of Varicella Zoster Virus in Human Stem Cell-Derived Neurons
- Protective mAbs and Cross-Reactive mAbs Raised by Immunization with Engineered Marburg Virus GPs
- Virulence Factors of Induce Both the Unfolded Protein and Integrated Stress Responses in Airway Epithelial Cells
- Peptide-MHC-I from Endogenous Antigen Outnumber Those from Exogenous Antigen, Irrespective of APC Phenotype or Activation
- Specific Cell Targeting Therapy Bypasses Drug Resistance Mechanisms in African Trypanosomiasis
- An Ultrasensitive Mechanism Regulates Influenza Virus-Induced Inflammation
- The Role of Human Transportation Networks in Mediating the Genetic Structure of Seasonal Influenza in the United States
- Host Delivery of Favorite Meals for Intracellular Pathogens
- Complement-Opsonized HIV-1 Overcomes Restriction in Dendritic Cells
- Inter-Seasonal Influenza is Characterized by Extended Virus Transmission and Persistence
- A Critical Role for CLSP2 in the Modulation of Antifungal Immune Response in Mosquitoes
- Twilight, a Novel Circadian-Regulated Gene, Integrates Phototropism with Nutrient and Redox Homeostasis during Fungal Development
- Surface-Associated Lipoproteins Link Virulence to Colitogenic Activity in IL-10-Deficient Mice Independent of Their Expression Levels
- Latent Membrane Protein LMP2A Impairs Recognition of EBV-Infected Cells by CD8+ T Cells
- Bank Vole Prion Protein As an Apparently Universal Substrate for RT-QuIC-Based Detection and Discrimination of Prion Strains
- Neuronal Subtype and Satellite Cell Tropism Are Determinants of Varicella-Zoster Virus Virulence in Human Dorsal Root Ganglia Xenografts
- Molecular Basis for the Selective Inhibition of Respiratory Syncytial Virus RNA Polymerase by 2'-Fluoro-4'-Chloromethyl-Cytidine Triphosphate
- Structure of the Virulence Factor, SidC Reveals a Unique PI(4)P-Specific Binding Domain Essential for Its Targeting to the Bacterial Phagosome
- Activated Brain Endothelial Cells Cross-Present Malaria Antigen
- Fungal Morphology, Iron Homeostasis, and Lipid Metabolism Regulated by a GATA Transcription Factor in
- Peptidoglycan Branched Stem Peptides Contribute to Virulence by Inhibiting Pneumolysin Release
- A Macrophage Subversion Factor Is Shared by Intracellular and Extracellular Pathogens
- A Novel AT-Rich DNA Recognition Mechanism for Bacterial Xenogeneic Silencer MvaT
- Reovirus FAST Proteins Drive Pore Formation and Syncytiogenesis Using a Novel Helix-Loop-Helix Fusion-Inducing Lipid Packing Sensor
- The Role of ExoS in Dissemination of during Pneumonia
- IRF-5-Mediated Inflammation Limits CD8 T Cell Expansion by Inducing HIF-1α and Impairing Dendritic Cell Functions during Infection
- Discordant Impact of HLA on Viral Replicative Capacity and Disease Progression in Pediatric and Adult HIV Infection
- Crystal Structure of USP7 Ubiquitin-like Domains with an ICP0 Peptide Reveals a Novel Mechanism Used by Viral and Cellular Proteins to Target USP7
- HIV Latency Is Established Directly and Early in Both Resting and Activated Primary CD4 T Cells
- HPV16 Down-Regulates the Insulin-Like Growth Factor Binding Protein 2 to Promote Epithelial Invasion in Organotypic Cultures
- The νSaα Specific Lipoprotein Like Cluster () of . USA300 Contributes to Immune Stimulation and Invasion in Human Cells
- RSV-Induced H3K4 Demethylase KDM5B Leads to Regulation of Dendritic Cell-Derived Innate Cytokines and Exacerbates Pathogenesis
- Leukocidin A/B (LukAB) Kills Human Monocytes via Host NLRP3 and ASC when Extracellular, but Not Intracellular
- Border Patrol Gone Awry: Lung NKT Cell Activation by Exacerbates Tularemia-Like Disease
- The Curious Road from Basic Pathogen Research to Clinical Translation
- From Cell and Organismal Biology to Drugs
- Adenovirus Tales: From the Cell Surface to the Nuclear Pore Complex
- A 21st Century Perspective of Poliovirus Replication
- Is Development of a Vaccine against Feasible?
- Waterborne Viruses: A Barrier to Safe Drinking Water
- Battling Phages: How Bacteria Defend against Viral Attack
- Archaea in and on the Human Body: Health Implications and Future Directions
- Degradation of Human PDZ-Proteins by Human Alphapapillomaviruses Represents an Evolutionary Adaptation to a Novel Cellular Niche
- Natural Variants of the KPC-2 Carbapenemase have Evolved Increased Catalytic Efficiency for Ceftazidime Hydrolysis at the Cost of Enzyme Stability
- Potent Cell-Intrinsic Immune Responses in Dendritic Cells Facilitate HIV-1-Specific T Cell Immunity in HIV-1 Elite Controllers
- The Mammalian Cell Cycle Regulates Parvovirus Nuclear Capsid Assembly
- Host Reticulocytes Provide Metabolic Reservoirs That Can Be Exploited by Malaria Parasites
- The Proteome of the Isolated Containing Vacuole Reveals a Complex Trafficking Platform Enriched for Retromer Components
- NK-, NKT- and CD8-Derived IFNγ Drives Myeloid Cell Activation and Erythrophagocytosis, Resulting in Trypanosomosis-Associated Acute Anemia
- Successes and Challenges on the Road to Cure Hepatitis C
- BRCA1 Regulates IFI16 Mediated Nuclear Innate Sensing of Herpes Viral DNA and Subsequent Induction of the Innate Inflammasome and Interferon-β Responses
- A Structural and Functional Comparison Between Infectious and Non-Infectious Autocatalytic Recombinant PrP Conformers
- Phosphorylation of the Peptidoglycan Synthase PonA1 Governs the Rate of Polar Elongation in Mycobacteria
- Human Immunodeficiency Virus Type 1 Nef Inhibits Autophagy through Transcription Factor EB Sequestration
- Sequence-Specific Fidelity Alterations Associated with West Nile Virus Attenuation in Mosquitoes
- EBV BART MicroRNAs Target Multiple Pro-apoptotic Cellular Genes to Promote Epithelial Cell Survival
- Single-Cell and Single-Cycle Analysis of HIV-1 Replication
- TRIM32 Senses and Restricts Influenza A Virus by Ubiquitination of PB1 Polymerase
- The Herpes Simplex Virus Protein pUL31 Escorts Nucleocapsids to Sites of Nuclear Egress, a Process Coordinated by Its N-Terminal Domain
- Host Transcriptional Response to Influenza and Other Acute Respiratory Viral Infections – A Prospective Cohort Study
- PLOS Pathogens
- Archiv čísel
- Aktuální číslo
- Informace o časopisu
Nejčtenější v tomto čísle- HIV Latency Is Established Directly and Early in Both Resting and Activated Primary CD4 T Cells
- Battling Phages: How Bacteria Defend against Viral Attack
- A 21st Century Perspective of Poliovirus Replication
- Adenovirus Tales: From the Cell Surface to the Nuclear Pore Complex
Kurzy
Zvyšte si kvalifikaci online z pohodlí domova
Autoři: prof. MUDr. Vladimír Palička, CSc., Dr.h.c., doc. MUDr. Václav Vyskočil, Ph.D., MUDr. Petr Kasalický, CSc., MUDr. Jan Rosa, Ing. Pavel Havlík, Ing. Jan Adam, Hana Hejnová, DiS., Jana Křenková
Autoři: MUDr. Irena Krčmová, CSc.
Autoři: MDDr. Eleonóra Ivančová, PhD., MHA
Autoři: prof. MUDr. Eva Kubala Havrdová, DrSc.
Všechny kurzyPřihlášení#ADS_BOTTOM_SCRIPTS#Zapomenuté hesloZadejte e-mailovou adresu, se kterou jste vytvářel(a) účet, budou Vám na ni zaslány informace k nastavení nového hesla.
- Vzdělávání


