-
Články
- Vzdělávání
- Časopisy
Top články
Nové číslo
- Témata
- Kongresy
- Videa
- Podcasty
Nové podcasty
Reklama- Kariéra
Doporučené pozice
Reklama- Praxe
Dissection of a Quantitative Trait Locus for PR Interval Duration Identifies as a Novel Modulator of Cardiac Conduction
Atrio-ventricular conduction disease is a common feature in Mendelian rhythm disorders associated with sudden cardiac death and is characterized by prolongation of the PR interval on the surface electrocardiogram (ECG). Prolongation of the PR interval is also a strong predictor of atrial fibrillation, the most prevalent sustained cardiac arrhythmia. Despite the significant genetic component in PR duration variability, the genes regulating PR interval duration remain largely elusive. We here aimed to dissect the quantitative trait locus (QTL) for PR interval duration that we previously mapped in murine F2 progeny of a sensitized 129P2 and FVBN/J cross. To determine the underlying gene responsible for this QTL, genome-wide transcriptional profiling was carried out on myocardial tissue from 109 F2 mice. Expression QTLs (eQTLs) were mapped and the PR interval QTL was inspected for the co-incidence of eQTLs. We further determined the correlation of each of these transcripts to the PR interval. Tnni3k was the only eQTL, mapping to the PR-QTL, with an established abundant cardiac-specific expression pattern and a significant correlation to PR interval duration. Genotype inspection in various inbred mouse strains revealed the presence of at least three independent haplotypes at the Tnni3k locus. Measurement of PR interval duration and Tnni3k mRNA expression levels in six inbred lines identified a positive correlation between the level of Tnni3k mRNA and PR interval duration. Furthermore, in DBA/2J mice overexpressing hTNNI3K, and in DBA.AKR.hrtfm2 congenic mice, which harbor the AKR/J “high-Tnni3k expression” haplotype in the DBA/2J genetic background, PR interval duration was prolonged as compared to DBA/2J wild-type mice (“low-Tnni3k expression” haplotype). Our data provide the first evidence for a role of Tnni3k in controlling the electrocardiographic PR interval indicating a function of Tnni3k in atrio-ventricular conduction.
Published in the journal: . PLoS Genet 8(12): e32767. doi:10.1371/journal.pgen.1003113
Category: Research Article
doi: https://doi.org/10.1371/journal.pgen.1003113Summary
Atrio-ventricular conduction disease is a common feature in Mendelian rhythm disorders associated with sudden cardiac death and is characterized by prolongation of the PR interval on the surface electrocardiogram (ECG). Prolongation of the PR interval is also a strong predictor of atrial fibrillation, the most prevalent sustained cardiac arrhythmia. Despite the significant genetic component in PR duration variability, the genes regulating PR interval duration remain largely elusive. We here aimed to dissect the quantitative trait locus (QTL) for PR interval duration that we previously mapped in murine F2 progeny of a sensitized 129P2 and FVBN/J cross. To determine the underlying gene responsible for this QTL, genome-wide transcriptional profiling was carried out on myocardial tissue from 109 F2 mice. Expression QTLs (eQTLs) were mapped and the PR interval QTL was inspected for the co-incidence of eQTLs. We further determined the correlation of each of these transcripts to the PR interval. Tnni3k was the only eQTL, mapping to the PR-QTL, with an established abundant cardiac-specific expression pattern and a significant correlation to PR interval duration. Genotype inspection in various inbred mouse strains revealed the presence of at least three independent haplotypes at the Tnni3k locus. Measurement of PR interval duration and Tnni3k mRNA expression levels in six inbred lines identified a positive correlation between the level of Tnni3k mRNA and PR interval duration. Furthermore, in DBA/2J mice overexpressing hTNNI3K, and in DBA.AKR.hrtfm2 congenic mice, which harbor the AKR/J “high-Tnni3k expression” haplotype in the DBA/2J genetic background, PR interval duration was prolonged as compared to DBA/2J wild-type mice (“low-Tnni3k expression” haplotype). Our data provide the first evidence for a role of Tnni3k in controlling the electrocardiographic PR interval indicating a function of Tnni3k in atrio-ventricular conduction.
Introduction
Atrio-ventricular (AV) conduction delay describes the impairment of the electrical continuity between the atria and the ventricles and is characterized by prolongation of the PR interval on the surface electrocardiogram (ECG). AV delay of varying severity is a common feature in Mendelian rhythm disorders and is associated with sudden cardiac death [1]. PR interval prolongation is also a strong predictor of atrial fibrillation (AF) [2] and is therefore considered an intermediate phenotype for this condition [3]. AF is the most commonly observed sustained cardiac arrhythmia, with an age dependent prevalence of up to 9% [4]. Identification of genetic determinants of AV conduction delay is essential for understanding the underlying molecular mechanisms and for the possibility of development of targeted treatments and prevention strategies.
There is a strong heritable component in the variability of the PR interval [5]–[7] and although genome-wide approaches have highlighted several causal loci [3], a major proportion of the heritability and the underlying genes remains elusive. The identification of these genetic factors in the human population has been difficult owing to wide genetic heterogeneity and an uncontainable environment. We here exploit the homogeneous genetic background and controlled environment of inbred laboratory mouse strains to identify a novel genetic modifier of the PR interval.
We have previously detected a quantitative trait locus (QTL) for the PR interval (PR-QTL) on chromosome 3 in a conduction disease sensitized mouse F2 progeny of mice harboring the cardiac voltage-gated sodium channel gene mutation Scn5a1798insD/+, generated from a 129P2-Scn5a1798insD/+×FVBN/J-Scn5a1798insD/+ cross [8]. 129P2-Scn5a1798insD/+ and FVBN/J-Scn5a1798insD/+ mice recapitulate many of the electrocardiographic (ECG) manifestations seen in patients carrying the homologous mutation SCN5A-1795insD, including cardiac conduction defects. Importantly, 129P2-Scn5a1798insD/+ and FVBN/J-Scn5a1798insD/+ mice display different severity of conduction disease [9], [10]. These differences in conduction disease severity are likely due to a complex interplay of multiple modifier loci. We previously exploited these strain effects on cardiac conduction to map a QTL on mouse chromosome 3 that influences the variance in PR interval [8]. The aim of the present study was to dissect this QTL in detail to identify the underlying gene responsible for the variation in PR interval.
As genetic variation underlying a QTL may act through effects on gene expression [11], we tested the presence of such variability in our F2 population. We integrated genome-wide transcriptional profiles of myocardial tissue with single nucleotide polymorphism (SNP) mapping in our hybrid mouse population to delineate genetic loci in association with variance in gene expression. These expression QTLs (eQTLs) where assessed for overlap with the PR interval QTL. Of the thus found 16 eQTLs only Tnni3k expression levels both correlated to the PR interval and had a high cardiac specific expression.
We integrated genome-wide transcriptional profiles of myocardial tissue with genotypic data in F2 progeny from the 129P2-Scn5a1798insD/+×FVBN/J-Scn5a1798insD/+ cross to uncover eQTLs that overlapped with the chromosome 3 PR interval QTL. Of these eQTLs, only the transcript for Tnni3k both correlated to the PR interval and was highly and specifically expressed in heart; Tnni3k was thus identified as a very strong candidate for the effect. The role of Tnni3k was subsequently validated in silico using phenotypic data from the mouse phenome database [12]. Further validation was performed by testing the correlation of Tnni3k expression level with PR interval in 6 inbred mouse strains harboring 3 independent haplotypes at the Tnni3k genomic locus. Finally, the role of Tnni3k in modulation of the PR interval was validated in vivo in (i) congenic mice harboring the high-Tnni3k expression haplotype of the AKR/J strain in the DBA/2J (low expression of Tnni3k) genetic background and (ii) in DBA/2J mice overexpressing human TNNI3K.
Results
F2 screen for identifying genetic modifiers of cardiac conduction
The identification of a main-effect PR interval QTL in the distal portion of chromosome 3 has been reported previously [8]. In brief, we combined ECG and genome-wide genotypic data in 502 F2 progeny generated from an FVBN/J-Scn5a1798insD+/−×129P2-Scn5a1798insD+/− intercross to map QTLs for ECG parameters. The most significant SNP association with PR interval was rs13477506; explaining 3.9% (p = 7.71×10⁻⁵) of the observed variance in PR interval [8].
Identification of eQTLs for the PR-QTL on chromosome 3
As genetic variation underlying a QTL may act on the trait through effects on gene expression [11] we tested the presence of such variability in the F2 mice. We measured genome-wide gene expression profiles of cardiac tissue in 109 previously genotyped F2 mice using microarrays. Normalized log-transformed intensities of individual transcripts were used as quantitative inputs for eQTL mapping. Considering a multiple-comparison corrected significance threshold of p<1.88×10⁻⁶ (LOD>6.83), we uncovered 16 eQTLs within the 1.5 LOD drop for the PR interval chromosome 3 QTL (Table 1). Of these 16 eQTLs, seven were deemed cis-regulated (cognate gene and eQTL SNP physically map to the same genomic region) indicating a possible direct effect of the underlying genetic variation on transcript levels; whereas nine eQTLs were labeled as trans-regulated (cognate gene physically maps to a different genomic region than the eQTL SNP) suggesting indirect effects such as transcription factor levels influencing the transcript level.
Tab. 1. eQTLs overlapping the 1.5 LOD drop region of the PR QTL. 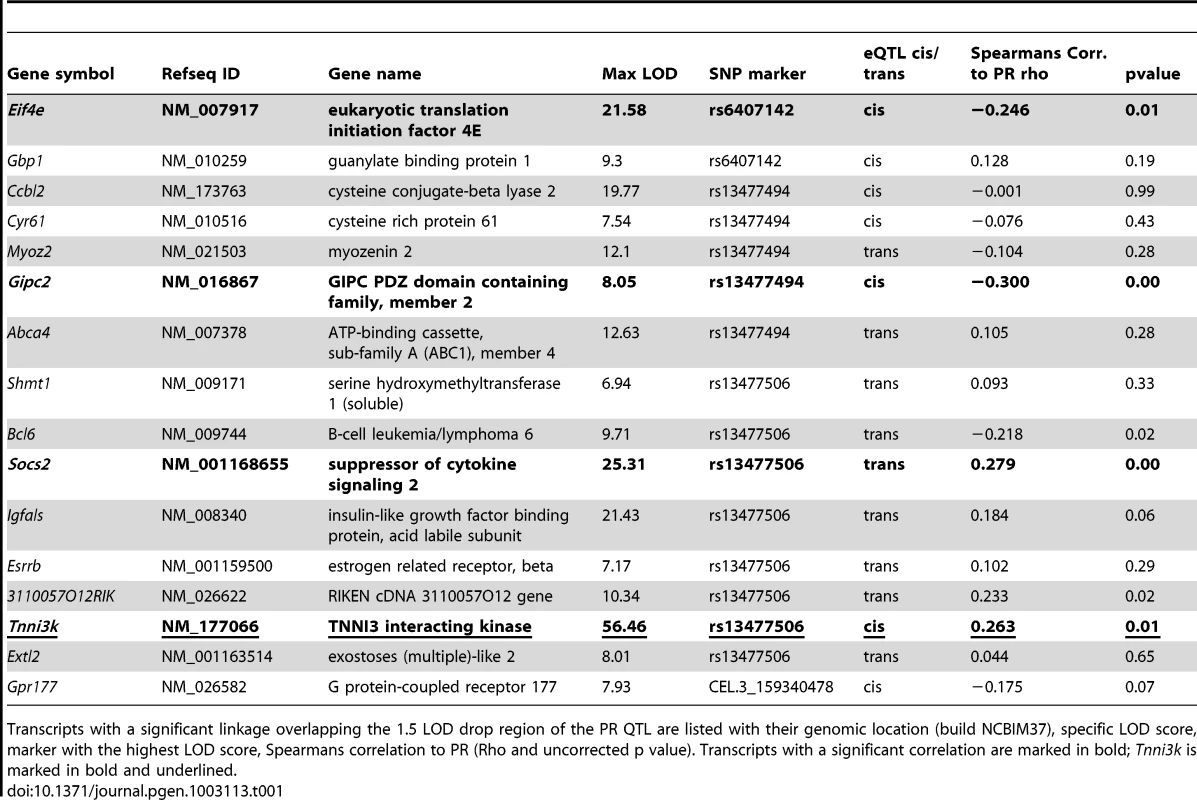
Transcripts with a significant linkage overlapping the 1.5 LOD drop region of the PR QTL are listed with their genomic location (build NCBIM37), specific LOD score, marker with the highest LOD score, Spearmans correlation to PR (Rho and uncorrected p value). Transcripts with a significant correlation are marked in bold; Tnni3k is marked in bold and underlined. To determine whether any of the identified eQTLs could be a candidate for the effect of the Chr3 PR-QTL we tested correlation of the transcript levels with the PR interval duration. Only four transcripts showed significant correlation to the PR interval, namely, Eif4e (rho −0.246, p<0.01), Gipc2 (rho −0.300, p<0.001), Socs2 (rho 0.279, p<0.001) and Tnni3k (rho 0.263, p<0.01). Data from the GEO database indicates that of these only Tnni3k displays a high cardiac specific expression pattern [13], [14]. We therefore investigated Tnni3k further as the prime candidate for the effect at the chromosome 3 PR-QTL.
Inspection of the genome-wide LOD plot for Tnni3k (Figure 1) shows a very sharp LOD peak with a maximum LOD score of 56.5 at rs13477506. The allele effect-size plot for the Tnni3k cis-eQTL at rs13477506 is shown in Figure 2A. Carriership of the 129P2-derived A-allele at the chromosome 3 locus is associated with heightened Tnni3k expression (Figure 2A, (Illumina probe ILMN_3023962, representative for all Tnni3k probe IDs) and prolonged PR interval (Figure 2B) [8]. Univariate analysis showed that the genotype at rs13477506 explains 88% (p<2×10⁻¹⁶) of the observed variance in Tnni3k transcript abundance. Differential Tnni3k mRNA expression was confirmed by quantitative RT-PCR in cardiac tissue (Figure 2A, dark colors).
Fig. 1. LOD plot of PR interval (black, left y-axis) and <i>Tnni3k (purple</i> right y-axis) on chromosome 3. 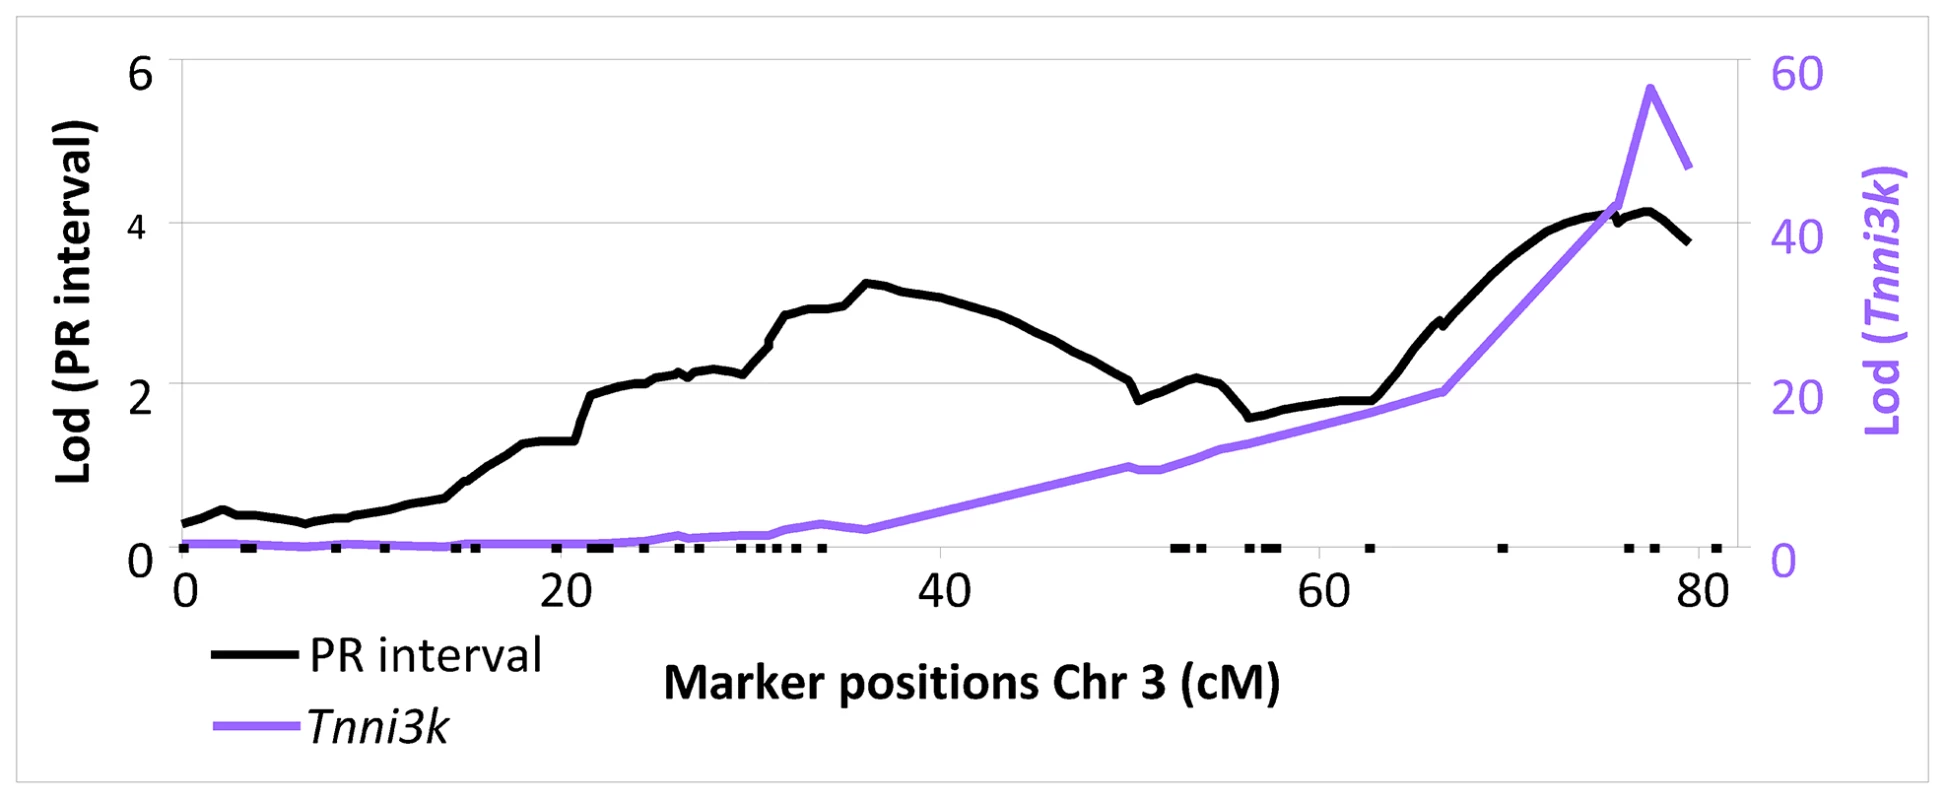
Fig. 2. Genotype effects at rs13477506. 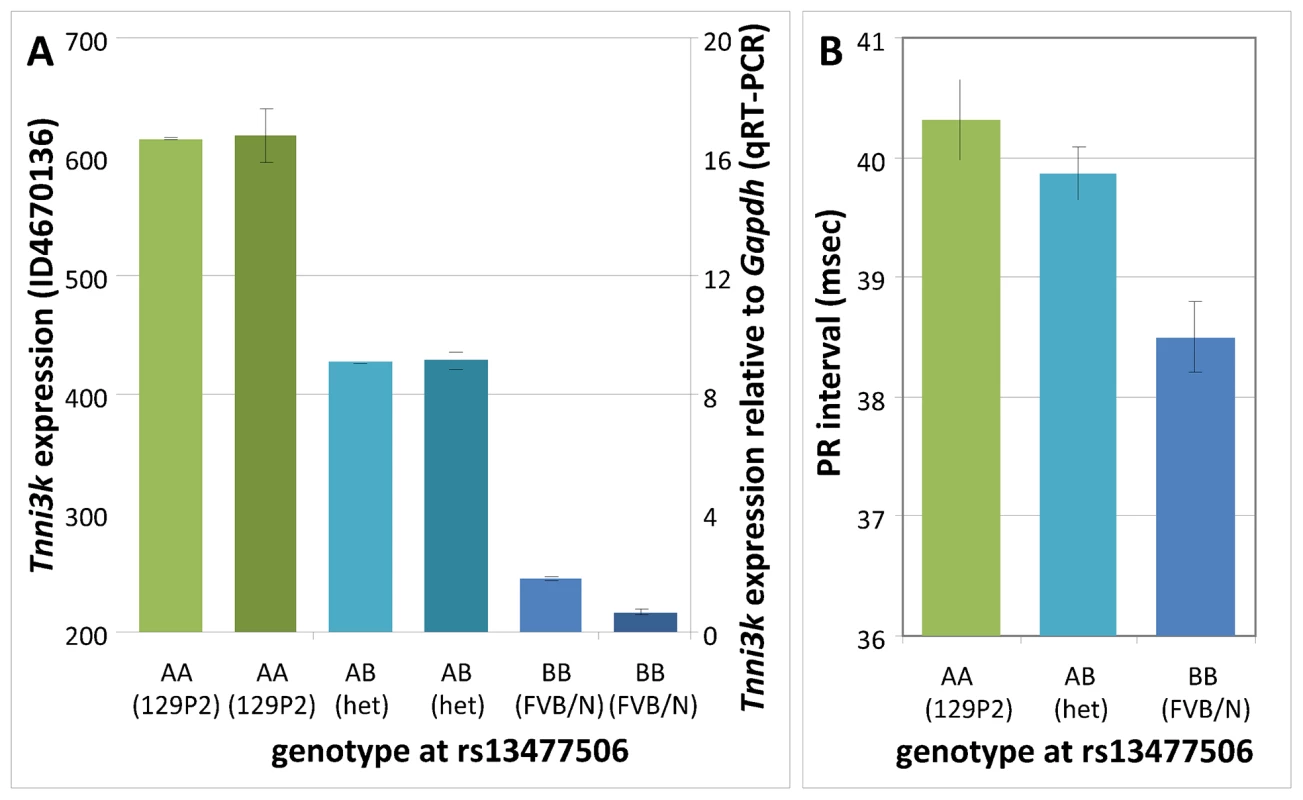
(A) Tnni3k expression (Illumina probe ILMN_3023962) as a function of genotype at rs13477506 in F2 mice; homozygous 129P2: AA, green; 129P2-FVBN/J heterozygous: AB, turquoise; homozygous FVBN/J: BB, blue; the darker shades represent the independent validation of the Tnni3k transcription levels by Q-PCR (right y-axis). (B) PR interval as a function of genotype at rs13477506 in F2 mice. Error bars indicate standard errors. In silico haplotype analysis in a panel of inbred mice
We next examined the haplotypes at the locus of interest in a panel of inbred mouse strains using the mouse phylogeny viewer [15] (Figure 3C). We identified three haplotypes in the Tnni3K eQTL region (indicated as red, green and blue in Figure 3C). The red haplotype (including DBA/2J) contains rs49812611, which is associated with nonsense mediated decay, leading to low levels of Tnni3k transcript [16]. This variant is absent in the strains with the blue and green haplotypes.
Fig. 3. Overview of the locations of the linkage regions on chromosome 3. 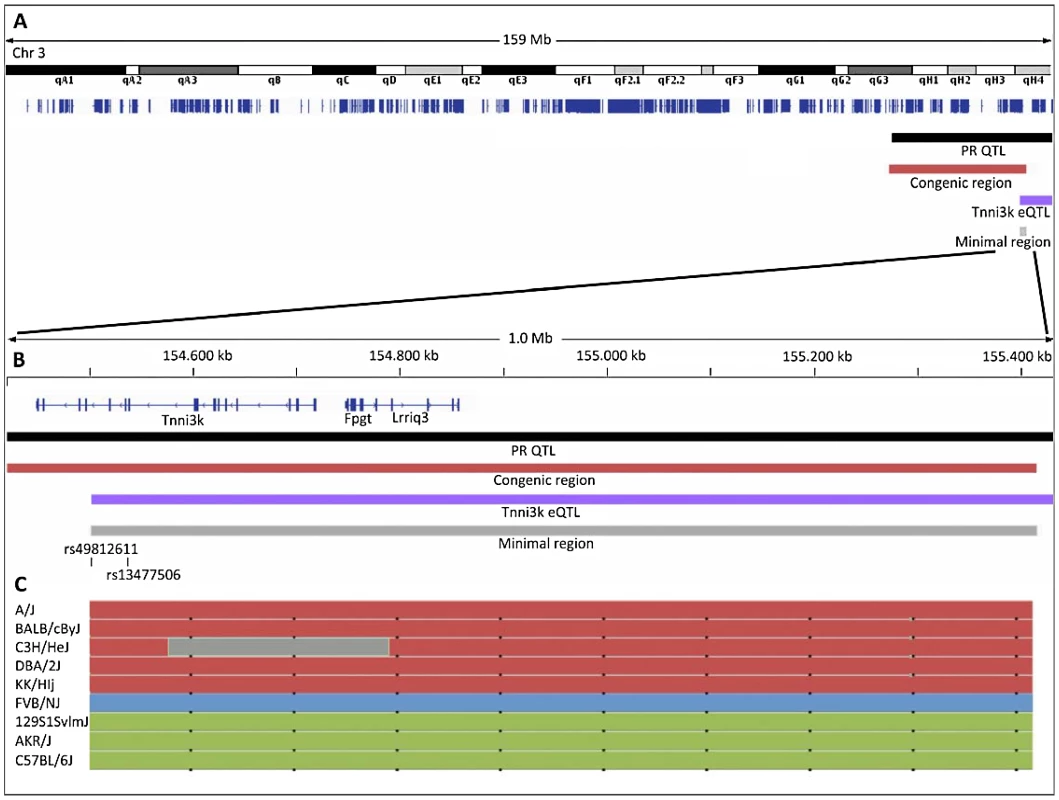
(A) Entire mouse chromosome 3 with refseq genes indicated in dark blue, black bar: 1.5 LOD drop of the PR-QTL; dark red bar 20 Mb DBA.AKR congenic region; purple bar 1.5 LOD drop of the Tnni3k eQTL; grey bar minimal region of overlap. (B) 1 Mb close up of the minimal region of overlap; the positions of rs49812611 (associated with nonsense mediated decay in DBA/2J) and rs13477506 (QTLs) are indicated. (C) Haplotypes of a panel of 9 inbred mouse strains as determined by the mouse phylogeny viewer (http://msub.csbio.unc.edu/) [19]. To determine whether these different genomic backgrounds in the different mouse strains were related to the PR interval we first looked at the published PR interval in publicly accessible data in the mouse phenome database [12], [17], [18]. Interestingly, this uncovered a significantly longer PR interval in inbred strains with the green (similar to 129P2) haplotype compared to strains with the red (DBA/2J) or blue (FVBN/J) haplotype (P<0.001) (www.phenome.jax.org). Since Tnni3k expression levels have been shown to be low in DBA/2J (red haplotype) and FVBN/J (blue haplotype) mice (which both have short PR intervals), and high in 129/P2 and AKR/J strains (both green haplotype and both having long PR interval durations) (Figure 2A and Wheeler et al. [16]), PR interval duration in these various mouse lines appears to correspond to the (predicted) Tnni3k expression levels.
Validation of in silico data in inbred mice of diverse genetic background
We next validated the correlation between Tnni3k expression levels and PR interval duration in a diverse panel of inbred mice with the three different haplotypes (red, green and blue) and a further two wild-derived inbred lines for which no haplotype information is available (WSB/EiJ & PWD/PhJ) [19]. In these lines we determined cardiac expression levels of Tnni3k by qRT-PCR and measured surface ECGs for assessment of PR interval duration. As shown in Figure 4B, Tnni3k expression levels significantly correlate to PR interval indices (rho = 0.475, p = 0.012), thus validating the correlation observed in silico.
Fig. 4. In silico and in vivo correlation of Tnni3k levels and PR interval duration. 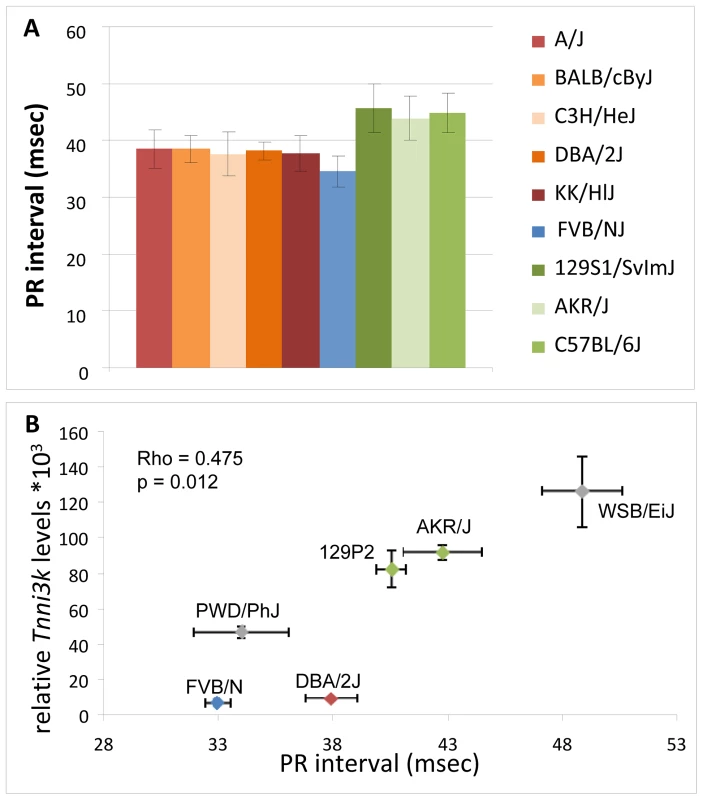
(A) In silico analysis: mouse inbred lines are colored based on the haplotypes in the minimal region of overlap; PR interval duration obtained from the mouse phenome database (http://phenome.jax.org/) FVBN/J (blue) (low expression) and green (high Tnni3k expression), inbred lines with the reddish colors carry rs49812611 (associated with nonsense mediated decay). (B) In vivo analysis of Tnni3k expression levels (y-axis) and PR interval duration (x-axis) in six inbred mouse lines, colors again denote the haplotype (gray is unknown haplotype). ECG analysis in congenic DBA.AKR-Hrtfm2 and TNNI3K overexpression mice
To exclude effects from loci that differ between the parental inbred strains but which map elsewhere in the genome, we measured ECGs in congenic DBA.AKR-Hrtfm2 mice. These mice harbor approximately 20 Mb of the AKR/J (green, ‘high-Tnni3k expression’) haplotype at the Tnni3k locus in the genetic background of the DBA/2J inbred mice; pure DBA/2J mice have short PR intervals and low Tnni3k levels (red haplotype) (Figure 3 and Figure 4B). In DBA.AKR-Hrtfm2 mice the level of Tnni3k is indistinguishable from that in AKR/J mice while the rest of the genetic background is the same as that of DBA/2J. Strikingly, DBA.AKR-Hrtfm2 mice completely recapitulate the long PR interval of the AKR/J mice, suggesting that the difference in the level of Tnni3k expression is a major cause of the difference in PR interval duration between these lines (Figure 5). An overview of all the ECG paramemeters measured is given in Table 2.
Fig. 5. Tnni3k prolongs the PR interval. 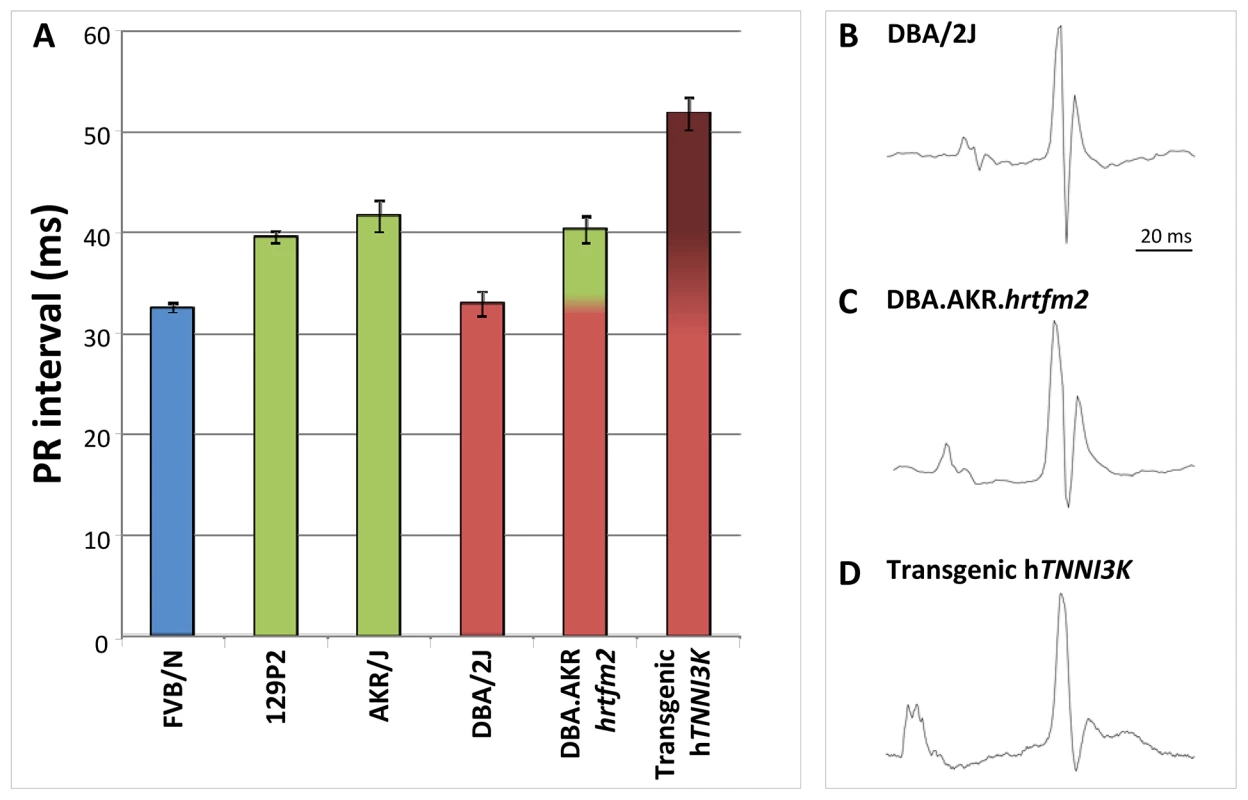
(A) Congenic mice carrying the AKR/J green haplotype in a DBA/2J genetic background display the green haplotype PR interval duration. Overexpression of tagged hTNNI3k in a DBA/2J background significantly prolongs the PR interval. Colors show the haplotype of each strain at the Tnni3k locus, error bars indicate standard deviations. (B–D) Examples of ECG traces of DBA/2J (B), AKR.DBA.hrtfm2 congenic (C) and DBA/2J overexpressing hTNNI3K (D). Tab. 2. Overview of the ECG results mean (st.err) in DBA/2J, DBA.AKR.hrtfm2 and transgenic hTnni3k mice. 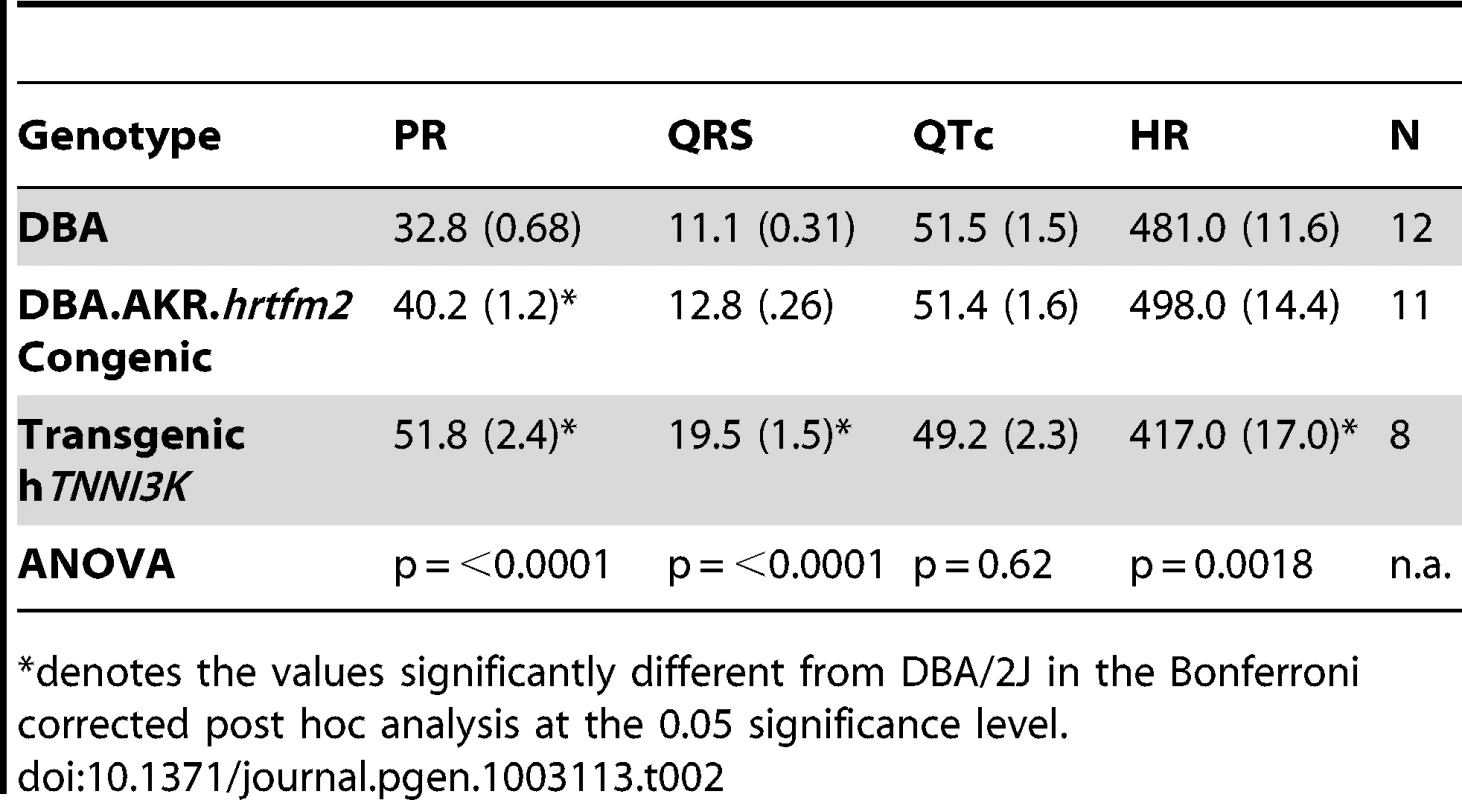
denotes the values significantly different from DBA/2J in the Bonferroni corrected post hoc analysis at the 0.05 significance level. In order to exclude the contribution of any of the 117 other genes present in the congenic region to the observed effects in the DBA.AKR-Hrtfm2 mice we measured ECGs in DBA/2J mice overexpressing human TNNI3K. As expected, the PR interval in these overexpression mice (with ∼20× overexpression of hTNNI3K [16]) was extremely prolonged (Figure 5).
Western blot analysis of Tnni3k
As prolonged PR interval indicates a possible role for Tnni3k in atrial and/or atrio-ventricular conduction we next investigated whether Tnni3k protein is also present in the atria besides its known presence ventricle [16]. We therefore performed Western Blotting on atrial (A) and ventricular (V) protein lysates from AKR/J (high Tnni3k expression) and DBA/2J (low Tnni3k expression). Tnni3k protein was detected in both atrial and ventricular lysates in AKR/J and as expected was undetectable in DBA/2J hearts (Figure 6). In AKR/J hearts expression appeared higher in atria compared to ventricle.
Fig. 6. Tnni3k protein levels. 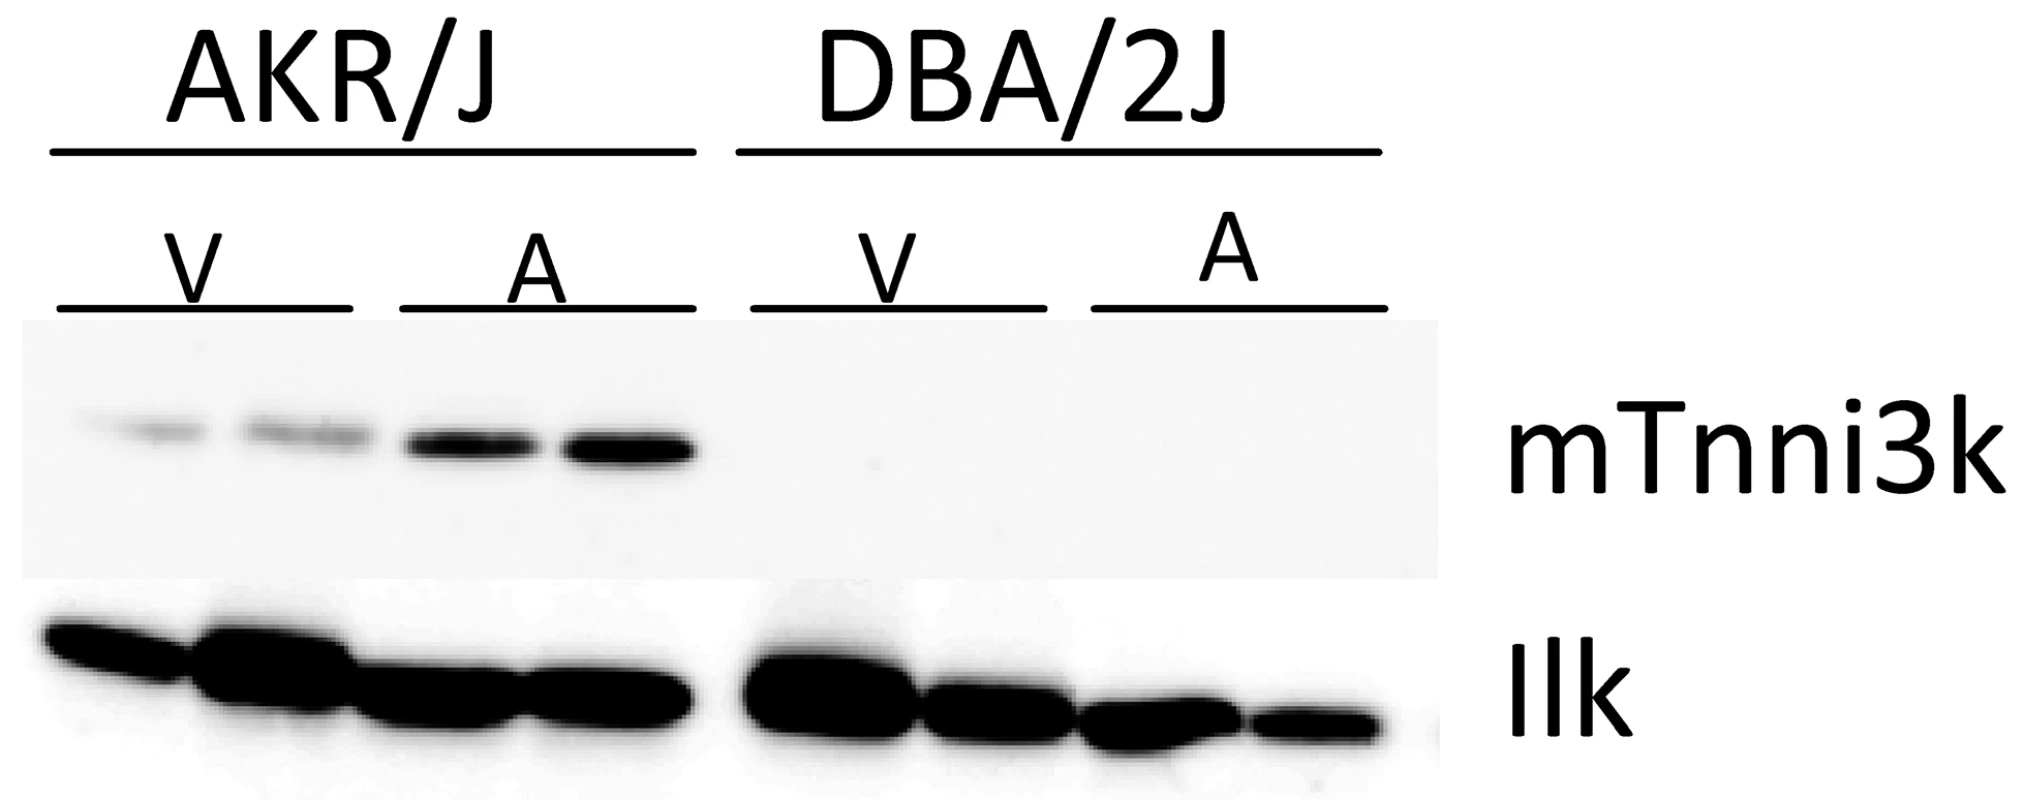
Immunoblot of atrial (A) and ventricular (V) protein lysates of AKR/J and DBA/2J mice using α-mTnni3k and α-ILK as loading control. Discussion
We here dissect the PR interval QTL on mouse chromosome 3 identifying the causal gene. We used eQTL mapping to identify genes whose expression is genetically regulated by variation within the QTL region. We tested the correlation of these genes to PR interval and, based on its in vivo expression pattern, selected Tnni3k as candidate gene for the effect. We subsequently validated the role of Tnni3k by in silico haplotype-phenotype correlation and by assessing the relation between Tnni3k expression levels and PR interval in 6 inbred mouse lines. Finally, the causality of Tnni3k was proven by in vivo studies in (i) congenic mice harboring a “high-Tnni3k–long-PR-interval” haplotype in a “low-Tnni3k-short PR” genetic background, and (ii) mice overexpressing Tnni3k. These in vivo studies provided unequivocal evidence for the involvement of Tnni3k in regulation of PR interval duration.
Genetic variation is known to affect a phenotype by altering the transcriptional activity of genes [20]. Thus, eQTL mapping, integrating genome-wide transcript profiling and genetic data in a hybrid population as carried out here, provides a powerful tool for the identification of causal genes at QTLs impacting on complex traits. Moreover, coupling eQTL detection with transcript-trait correlation analysis as performed here further aids prioritization of physiologically relevant genes within the QTL region [21].
Online databases providing genotypic and phenotypic information on diverse inbred mouse lines have been instrumental in the identification and validation of the causal gene underlying the PR interval QTL. Expression pattern data deposited in the Gene Expression Omnibus (GEO) database [13], [22] aided our selection of Tnni3k as the prime candidate among the 4 identified eQTLs whose transcripts correlated to the PR interval. In silico validation of the possible influence of Tnni3k expression levels on the PR interval was made possible by the mouse phylogeny viewer (http://msub.csbio.unc.edu/) [19] and the mouse phenome database (http://phenome.jax.org/) [12]. Furthermore, we used the information in the phylogeny viewer to select the panel of 6 inbred mouse lines in such a way that they represented all possible independent haplotypes at the Tnni3k locus.
To functionally validate the role of Tnni3k in the in vivo regulation of PR interval we studied the DBA.AKR-Hrtfm2 congenic mouse line harboring the high-Tnni3k expression AKR/J QTL region in the low-Tnni3k expression DBA/2J genetic background as well as transgenic mice overexpressing human TNNI3K. Strikingly, the congenic mice recapitulate perfectly the PR interval of the high-Tnni3k expression AKR/J donor line; furthermore, the hTNNI3K overexpression mice, as expected, display an extremely prolonged PR interval. Taken together this implies a dose-dependent effect of Tnni3k on atrio-ventricular conduction. Of note, hTNNI3K overexpression mice displayed longer QRS duration in comparison to DBA/2J wild-type mice. This concurs with our previous observation of a QTL for QRS duration post-flecainide overlapping the PR-QTL on mouse chromosome 3 [8].
Tnni3k was recently identified as a genetic modifier of disease progression in the Csqtg mouse model of cardiomyopathy [16]. In this model, with cardiac-specific overexpression of Calsequestrin (Csq), Tnni3k was shown to be the causative gene underlying the heart failure modifier 2 (Hrtfm2) locus, with high levels of Tnni3k accelerating the progression of the cardiomyopathic phenotype.
Little is known thus far about the physiological role of Tnni3k. Tnni3k encodes for cardiac Troponin I-interacting kinase 3, initially identified as a cardiac-specific protein kinase interacting with cardiac Troponin I in a yeast-two hybrid assay [23]. Its phosphorylation target(s) remain unknown [16]. The protein structure is predicted to contain an Ankyrin repeat domain besides the the Serine/Threonine-Tyrosine universal kinase domain, most likely involved in extensive protein-protein interactions.
The molecular mechanism whereby Tnni3k impacts on atrio-ventricular conduction requires further in-depth studies. Cardiac conduction slowing may stem from multiple mechanisms affecting cardiomyocyte depolarization, cell-cell electrical communication via gap-junctional coupling, or fibrosis, processes which may not necessarily be mutually exclusive. It is tempting to speculate that cardiac ion channels and/or gap junction proteins (connexins) may be direct targets of Tnni3k phosporylation.
In conclusion, we identified Tnni3k as the causal gene for a mouse PR interval QTL. Our findings provide the first evidence for Tnni3k in modulation of the electrocardiographic PR interval, indicating a previously unknown role for Tnni3k in atrio-ventricular conduction.
Methods
Mouse breeding and husbandry
The transgenic 129P2-Scn5a1798insD/+ (129P2-MUT) and FVBN/J-Scn5a1798insD/+ (FVBN/J-MUT) mice were generated as previously described [24]. (129P2xFVBN/J)-Scn5a1798insD/+ F1 mice (F1-MUT) were reared from these mice, and subsequently intercrossed to produce 120 Scn5a1798insD/+ F2 progeny. Generation of the congenic DBA.AKR.hrtfm2 and hTNNI3K-tg mouse lines was published previously [16] The inbred strains (WSB/Eij, Molf/Eij, DBA/2j, AKR/J, PWD/PhJ) were obtained from Jackson Laboratory. All mice were supplied with the same SDS diet (SDS CRM (E) PL; Special Diets Services, UK) and water ad libitum and maintained on a 12-hour light/dark cycle in a temperature and humidity controlled environment. All experiments were performed in accordance with governmental and institutional guidelines for animal use in research.
Genotyping
All F2 mice were genotyped for the Scn5a1798insD/+ mutation as previously described [7], only mice heterozygous for the mutation were used. For the genome-wide scan, the F2-MUT and three mice from each parental strain were genotyped across the 19 autosomes and X chromosome by means of an Illumina Golden Gate mouse medium density (768 SNP) panel. This genotyping was carried out at Harvard Partners Center for Genetics and Genomics (HPCGG, Cambridge MA, USA). Mice with call rates <95% and single nucleotide polymorphisms (SNPs) with a call rate <95% and a minor allele frequency (MAF) <0.45 were removed from the analyses. Genotyping errors were identified using error LOD scores [13].
All analysed strains were assessed for the presence of rs49812611
ECG measurements
ECG analysis of F2-MUT and inbred mice at 12 to 14 weeks of age (n = 109) was performed as previously described [10]. Briefly, mice were weighed, lightly anaesthetized by isoflurane inhalation (4.0% v/v induction; 0.8–1.2% v/v maintenance) with 800 ml/min oxygen and allowed to acclimatize for 5 minutes. The ambient temperature within the ECG recording hood was kept warm by means of a heat lamp. A 3-lead surface ECG was acquired digitally from subcutaneous 23-gauge needle electrodes at each limb of mice in the prone position using the Powerlab acquisition system (ADInstruments). Each channel was amplified and sampled at a rate of 1 kHz and a high-pass filter setting of 15 Hz. Baseline surface ECG traces were recorded for the duration of 5 minutes. A 3 minute ECG trace was analyzed for HR, and the signal average ECG (SAECG) calculated from each of leads I and II, aligned at QRS maximum, was analyzed for PR duration using the LabChart7Pro software (ADInstruments) and utilized for subsequent QTL mapping. We excluded mice that exhibited ECG parameter standard deviations greater than 1.5 ms between leads.
Harvest and dissection of heart samples
Mice were sacrificed at 12–14 weeks by CO2-O2 asphyxiation followed by cervical dislocation. Hearts were excised, washed in 1×PBS, and dissected left ventricular (LV) free-wall flash-frozen in liquid N2.
RNA preparation and microarray analysis
Total RNA was extracted from LV samples (n = 109) using the QIAGEN RNeasy mini kit 50 protocol for isolating total RNA from animal tissue using spin technology (QIAGEN Inc.) according to manufacturer's protocol. Total RNA yield (µg) and purity (260 nm∶280 nm) were determined spectrophotometrically using the NanoDrop spectrophotometer (USA). The integrity (RIN>9.0) of the re-suspended total RNA was determined using the RNA Nano Chip Kit on the Bioanalyzer 2100 and the 2100 Expert software (Agilent technologies). Synthesis, amplification and purification of anti-sense RNA was performed by using the Illumina TotalPrep RNA Amplification Kit (Ambion art. No. AM-IL1791) following the Illumina Sentrix Array Matrix expression protocol at ServiceXS (Leiden, The Netherlands). A total of 750 ng biotinylated cRNA was hybridized onto the MouseREf-8v2 Expression BeadChip (Illumina).
The raw scan data were read using the beadarray package (version 1.12.1) [14], available through Bioconductor [15]. Quality control using the function calculateBeadLevelScores showed no evidence of low-quality arrays. Illumina's default pre-processing steps were performed using beadarray. In short, estimated background was subtracted from the foreground for each bead. For replicate beads, outliers greater than 3 median absolute deviations (MADs) from the median were removed and the average signal was calculated for the remaining intensities. A variance-stabilization transformation [16] was applied to the summarized data in order to remove the mean-variance relationship in the intensities. Resulting data was then quantile normalized [17].
eQTL mapping
eQTL mapping was performed using the R/eqtl package based on the R-statistical program, as previously described [18]. Briefly, for each transcript probe (n = 26,529) a genome-wide scan was performed with genotype and the covariates sex, weight and age as main-effects. The logarithm-of-odds (LOD) scores were calculated by interval mapping using the expectation-maximization (EM) algorithm. A multiple-transcript genome-wide significance threshold (p<1.88×10⁻⁶, Bonferroni correction for 26,529 transcript traits) was applied. Corresponding empirical LOD threshold was determined using 10,000 permutations (swapping phenotypes (ECG parameters, sex, age and weight) and genotypes, thus destroying the phenotype-genotype relationship, but maintaining the LD patterns between markers), this corresponded to a LOD score threshold of 6.83. A cis-eQTL was called when the genomic distance between the mapping SNP and transcript was less than 10 Mb [19].
Quantitative trait transcript analysis
Transcripts for which we identified cis-eQTLs co-localizing with ECG trait QTL were tested for correlations with the respective ECG indices for conduction. Spearman's correlation coefficients (rho) were generated with a commercial program (SPSS software, ver. 16.0; SPSS, Chicago, IL).
qRT–PCR
mRNA expression levels of Tnni3k were validated in LV tissue samples (n = 10 in each group) by quantification using the LightCycler system for real-time RT-PCR (Roche Applied Science). Quantitative PCR data was analyzed with the LinRegPCR program [2]. All samples were processed in triplicate and expression levels were normalized to GAPDH.
Protein isolation and Western blotting
Protein was isolated from left ventricular and atrial tissue from a snap frozen mouse heart using standard procedures. In short: the tissue was homogenized in ice-cold RIPA buffer (50 mM Tris HCl pH 7.6, 150 mM NaCl, 1% NP-40, 0.5% sodium deoxycholate, 0.1% SDS) supplemented with protease inhibitors (Complete Mini; Roche) and Sodium Orthovanadate (final concentration 0.5 mM) using magnalyser ceramic beads (Roche scientific, 03358941001) for 60″. The unsoluable parts were spun down (30 sec at 4°C, 13000 rpm), the supernatant was transferred to a fresh tube and protein concentrations were determined using a BCA protein assay kit (Thermo Fisher Scientific). Protein lysates were run on a 8% acrylamide gel and blotted on a pre-equilibrated PVDF Immobilon-P membrane (Millipore) by means of a semidry system. Blots were cut at appropriate heights and probed with primary antibodies (1∶2000 α-mTnni3k rbt [16] 1∶10 000 α-ILK1 (4G9) (3856, Cell Signalling) as loading control. HRP conjugated secondary antibodies were detected with ECL-Plus (Amersham). Chemiluminescent signals were visualized using a digital image analyzer (LAS-4000 Lite; Fujifilm).
In silico validation and haplotype analysis
We analyzed the haplotype structure in the 1.5 LOD drop region of the Tnni3k eQTL using the mouse phylogeny viewer [19]. PR interval data for 9 strains with known haplotype structure was downloaded from the mouse phenome database [12], [18] and analysed by Student's T-test (after testing for normal distribution) for differences between the strains harboring the red versus the green haplotype. FVBN/J was excluded from this test, as no data for other strains with the same haplotype was available.
Data access
Expression data was deposited in the public gene expression omnibus (GEO) database of NCBI GEO database: GSE19741.
Zdroje
1. BensonD (2004) Genetics of atrioventricular conduction disease in humans. Anat Rec A Discov Mol Cell Evol Biol 280 : 934–939.
2. ChengS, KeyesMJ, LarsonMG, McGabeEL, Newton-ChehC, et al. (2009) Long-term Outcomes in Individuals With Prolonged PR Interval or First Degree Atrioventricular Block. JAMA 301 : 2571–2577.
3. SmithJG, MagnaniJW, PalmerC, MengYA, SolimanEZ, et al. (2011) Genome-wide association studies of the PR interval in African Americans. PLoS Genet 7: e1001304 doi:10.1371/journal.pgen.1001304.
4. HeeringaJ, ConwaymD, van der KuipD, HofmanA, KorsJ, et al. (2006) Prevalence incidence and lifetime risk of atrial fibrillation: the Rotterdam study. Eur Heart J 27 : 949–953.
5. HavlikR, GarrisonR, FabsitzR, FeinleibM (1980) Variability of heart rate, P-R, QRS and Q-T durations in twins. J Electrocardiol 13 : 45–48.
6. SmithJG, LoweJK, KovvaliS, MallerJB, SalitJ, et al. (2009) Genome-wide association study of electrocardiographic conduction measures in an isolated founder population: Kosrae. Heart Rhythm 6 : 634–641.
7. Newton-ChehC, GuoCY, WangTJ, O'DonnellCJ, LevyD, et al. (2007) Genome-wide association study of electrocardiographic and heart rate variability traits: the Framingham Heart Study. BMC Med Genet 8 Suppl 1: S7.
8. SciclunaBP, TanckMW, RemmeCA, BeekmanL, CoronelR, et al. (2011) Quantitative trait loci for electrocardiographic parameters and arrhythmia in the mouse. J Mol Cell Cardiol 50 : 380–389.
9. RemmeCA, SciclunaBP, VerkerkAO, AminAS, van BrunschotS, et al. (2009) Genetically determined differences in sodium current characteristics modulate conduction disease severity in mice with cardiac sodium channelopathy. Circ Res 104 : 1283–1292.
10. SciclunaBP, WildeAA, BezzinaCR (2008) The primary arrhythmia syndromes: same mutation, different manifestations. Are we starting to understand why? J Cardiovasc Electrophysiol 19 : 445–452.
11. HubnerN, WallaceCA, ZimdahlH, PetrettoE, SchulzH, et al. (2005) Integrated transcriptional profiling and linkage analysis for identification of genes underlying disease. Nat Genet 37 : 243–253.
12. BogueMA, GrubbSC (2004) The Mouse Phenome Project. Genetica 122 : 71–74.
13. http://www.ncbi.nlm.nih.gov/sites/GDSbrowser?acc=GDS3142.
14. ThorrezL, Van DeunK, TrancheventLC, Van LommelL, EngelenK, et al. (2008) Using ribosomal protein genes as reference: a tale of caution. PLoS ONE 3: e1854 doi:10.1371/journal.pone.0001854.
15. http://msub.csbio.unc.edu/.
16. WheelerFC, TangH, MarksOA, HadnottTN, ChuPL, et al. (2009) Tnni3k modifies disease progression in murine models of cardiomyopathy. PLoS Genet 5: e1000647 doi:10.1371/journal.pgen.1000647.
17. http://phenome.jax.org/.
18. BerthonnecheC, PeterB, SchupferF, HayozP, KutalikZ, et al. (2009) Cardiovascular response to beta-adrenergic blockade or activation in 23 inbred mouse strains. PLoS ONE 4: e6610 doi:10.1371/journal.pone.0006610.
19. YangH, WangJR, DidionJP, BuusRJ, BellTA, et al. (2011) Subspecific origin and haplotype diversity in the laboratory mouse. Nat Genet 43 : 648–655.
20. SchadtEE, LambJ, YangX, ZhuJ, EdwardsS, et al. (2005) An integrative genomics approach to infer causal associations between gene expression and disease. Nat Genet 37 : 710–717.
21. PetrettoE, SarwarR, GrieveI, LuH, KumaranMK, et al. (2008) Integrated genomic approaches implicate osteoglycin (Ogn) in the regulation of left ventricular mass. Nat Genet 40 : 546–552.
22. BarrettT, TroupD, WilhiteS, LedouxP, EvangelistaC, et al. (2011) NCBI GEO: archive for functional genomics data sets—10 years on. Nucleic Acids Res 39: D1005–1010.
23. ZhaoY, MengX, WeiY, ZhaoX, LiuD, et al. (2003) Cloning and characterization of a novel cardiac-specific kinase that interacts specifically with cardiac troponin I. J Mol Med 81 : 297–304.
24. RemmeCA, VerkerkAO, NuyensD, van GinnekenAC, van BrunschotS, et al. (2006) Overlap syndrome of cardiac sodium channel disease in mice carrying the equivalent mutation of human SCN5A-1795insD. Circulation 114 : 2584–2594.
Štítky
Genetika Reprodukční medicína
Článek Defining the Pathways Underlying the Prolonged PR Interval in Atrioventricular Conduction DiseaseČlánek Translation in Giant Viruses: A Unique Mixture of Bacterial and Eukaryotic Termination SchemesČlánek Controls Gliogenesis by Regulating the Transient Expression of the Gcm/Glide Fate Determinant
Článek vyšel v časopisePLOS Genetics
Nejčtenější tento týden
2012 Číslo 12- Akutní intermitentní porfyrie
- Růst a vývoj dětí narozených pomocí IVF
- Farmakogenetické testování pomáhá předcházet nežádoucím efektům léčiv
- Pilotní studie: stres a úzkost v průběhu IVF cyklu
- IVF a rakovina prsu – zvyšují hormony riziko vzniku rakoviny?
-
Všechny články tohoto čísla
- A Mystery Unraveled: Essentiality of RNase III in Is Caused by Resident Prophages
- Defining the Pathways Underlying the Prolonged PR Interval in Atrioventricular Conduction Disease
- Insertion/Deletion Polymorphisms in the Promoter Are a Risk Factor for Bladder Exstrophy Epispadias Complex
- Mi2β Is Required for γ-Globin Gene Silencing: Temporal Assembly of a GATA-1-FOG-1-Mi2 Repressor Complex in β-YAC Transgenic Mice
- Dissection of a Quantitative Trait Locus for PR Interval Duration Identifies as a Novel Modulator of Cardiac Conduction
- Dnmt3a Protects Active Chromosome Domains against Cancer-Associated Hypomethylation
- Construction of a Global Pain Systems Network Highlights Phospholipid Signaling as a Regulator of Heat Nociception
- Genes Contributing to Pain Sensitivity in the Normal Population: An Exome Sequencing Study
- Identification of , a Locus Controlling Dominant Resistance to Autoimmune Orchitis, as Kinesin Family Member 1C
- ATX1-Generated H3K4me3 Is Required for Efficient Elongation of Transcription, Not Initiation, at ATX1-Regulated Genes
- Dynamic and Differential Regulation of Stem Cell Factor FoxD3 in the Neural Crest Is Encrypted in the Genome
- Identification of Novel Type 2 Diabetes Candidate Genes Involved in the Crosstalk between the Mitochondrial and the Insulin Signaling Systems
- The Genetic Architecture of Adaptations to High Altitude in Ethiopia
- Population Genomics of the Endosymbiont in
- Translation in Giant Viruses: A Unique Mixture of Bacterial and Eukaryotic Termination Schemes
- Testicular Differentiation Occurs in Absence of R-spondin1 and Sox9 in Mouse Sex Reversals
- A Yeast GSK-3 Kinase Mck1 Promotes Cdc6 Degradation to Inhibit DNA Re-Replication
- Genetic Adaptation Associated with Genome-Doubling in Autotetraploid
- The Essential Function of RNase III Is to Silence Foreign Toxin Genes
- Long-Range Regulatory Polymorphisms Affecting a GABA Receptor Constitute a Quantitative Trait Locus (QTL) for Social Behavior in
- A New Isolation with Migration Model along Complete Genomes Infers Very Different Divergence Processes among Closely Related Great Ape Species
- Chromosome Fragile Sites in Harbor Matrix Attachment Regions That May Be Associated with Ancestral Chromosome Rearrangement Events
- Genome-Wide Association Study Implicates Testis-Sperm Specific as a Susceptibility Locus for Impaired Acrosome Reaction in Stallions
- A Mechanism of Gene Amplification Driven by Small DNA Fragments
- Base Damage within Single-Strand DNA Underlies Hypermutability Induced by a Ubiquitous Environmental Agent
- Integrative Analysis of a Cross-Loci Regulation Network Identifies as a Gene Regulating Insulin Secretion from Pancreatic Islets
- Reciprocal Signaling between the Ectoderm and a Mesendodermal Left-Right Organizer Directs Left-Right Determination in the Sea Urchin Embryo
- Population Genomics of Sub-Saharan : African Diversity and Non-African Admixture
- Genome-Wide Fine-Scale Recombination Rate Variation in
- Deciphering the Transcriptional-Regulatory Network of Flocculation in
- On Lung Function and Interactions Using Genome-Wide Data
- Genome-Wide Joint Meta-Analysis of SNP and SNP-by-Smoking Interaction Identifies Novel Loci for Pulmonary Function
- The Effective Population Size of Malaria Mosquitoes: Large Impact of Vector Control
- Recessive Mutations in Implicate β-III Spectrin in Both Cognitive and Motor Development
- An Excess of Gene Expression Divergence on the X Chromosome in Embryos: Implications for the Faster-X Hypothesis
- Reduced Life- and Healthspan in Mice Carrying a Mono-Allelic MVA Mutation
- Natural Variation at the MATE Transporter Locus Reveals Cross-Talk between Fe Homeostasis and Zn Tolerance in
- Histone Deacetylase HDA6 Is Functionally Associated with AS1 in Repression of Genes in
- A Framework for the Establishment of a Cnidarian Gene Regulatory Network for “Endomesoderm” Specification: The Inputs of ß-Catenin/TCF Signaling
- A Polycomb Group Protein Is Retained at Specific Sites on Chromatin in Mitosis
- Diapause Formation and Downregulation of Insulin-Like Signaling via DAF-16/FOXO Delays Axonal Degeneration and Neuronal Loss
- Genes That Act Downstream of Sensory Neurons to Influence Longevity, Dauer Formation, and Pathogen Responses in
- A Genome-Wide RNAi Screen Reveals MAP Kinase Phosphatases as Key ERK Pathway Regulators during Embryonic Stem Cell Differentiation
- Recurrent Targeted Genes of Hepatitis B Virus in the Liver Cancer Genomes Identified by a Next-Generation Sequencing–Based Approach
- Excessive Astrocyte-Derived Neurotrophin-3 Contributes to the Abnormal Neuronal Dendritic Development in a Mouse Model of Fragile X Syndrome
- Pre-Disposition and Epigenetics Govern Variation in Bacterial Survival upon Stress
- Controls Gliogenesis by Regulating the Transient Expression of the Gcm/Glide Fate Determinant
- Systems Genetic Analysis of Osteoblast-Lineage Cells
- Population Genomics of Inversion Polymorphisms in
- Spreading of Heterochromatin Is Limited to Specific Families of Maize Retrotransposons
- DNA Topoisomerases Maintain Promoters in a State Competent for Transcriptional Activation in
- A Histone Deacetylase Adjusts Transcription Kinetics at Coding Sequences during Morphogenesis
- Approaching the Functional Annotation of Fungal Virulence Factors Using Cross-Species Genetic Interaction Profiling
- Evidence for the Robustness of Protein Complexes to Inter-Species Hybridization
- Systematic Identification of Rhythmic Genes Reveals as a New Element in the Circadian Clockwork
- PLOS Genetics
- Archiv čísel
- Aktuální číslo
- Informace o časopisu
Nejčtenější v tomto čísle- Dnmt3a Protects Active Chromosome Domains against Cancer-Associated Hypomethylation
- Population Genomics of Sub-Saharan : African Diversity and Non-African Admixture
- Excessive Astrocyte-Derived Neurotrophin-3 Contributes to the Abnormal Neuronal Dendritic Development in a Mouse Model of Fragile X Syndrome
- Pre-Disposition and Epigenetics Govern Variation in Bacterial Survival upon Stress
Kurzy
Zvyšte si kvalifikaci online z pohodlí domova
Autoři: prof. MUDr. Vladimír Palička, CSc., Dr.h.c., doc. MUDr. Václav Vyskočil, Ph.D., MUDr. Petr Kasalický, CSc., MUDr. Jan Rosa, Ing. Pavel Havlík, Ing. Jan Adam, Hana Hejnová, DiS., Jana Křenková
Autoři: MUDr. Irena Krčmová, CSc.
Autoři: MDDr. Eleonóra Ivančová, PhD., MHA
Autoři: prof. MUDr. Eva Kubala Havrdová, DrSc.
Všechny kurzyPřihlášení#ADS_BOTTOM_SCRIPTS#Zapomenuté hesloZadejte e-mailovou adresu, se kterou jste vytvářel(a) účet, budou Vám na ni zaslány informace k nastavení nového hesla.
- Vzdělávání


