-
Články
- Vzdělávání
- Časopisy
Top články
Nové číslo
- Témata
- Kongresy
- Videa
- Podcasty
Nové podcasty
Reklama- Kariéra
Doporučené pozice
Reklama- Praxe
Glycosylation Focuses Sequence Variation in the Influenza A Virus H1 Hemagglutinin Globular Domain
Antigenic drift in the influenza A virus hemagglutinin (HA) is responsible for seasonal reformulation of influenza vaccines. Here, we address an important and largely overlooked issue in antigenic drift: how does the number and location of glycosylation sites affect HA evolution in man? We analyzed the glycosylation status of all full-length H1 subtype HA sequences available in the NCBI influenza database. We devised the “flow index” (FI), a simple algorithm that calculates the tendency for viruses to gain or lose consensus glycosylation sites. The FI predicts the predominance of glycosylation states among existing strains. Our analyses show that while the number of glycosylation sites in the HA globular domain does not influence the overall magnitude of variation in defined antigenic regions, variation focuses on those regions unshielded by glycosylation. This supports the conclusion that glycosylation generally shields HA from antibody-mediated neutralization, and implies that fitness costs in accommodating oligosaccharides limit virus escape via HA hyperglycosylation.
Published in the journal: . PLoS Pathog 6(11): e32767. doi:10.1371/journal.ppat.1001211
Category: Research Article
doi: https://doi.org/10.1371/journal.ppat.1001211Summary
Antigenic drift in the influenza A virus hemagglutinin (HA) is responsible for seasonal reformulation of influenza vaccines. Here, we address an important and largely overlooked issue in antigenic drift: how does the number and location of glycosylation sites affect HA evolution in man? We analyzed the glycosylation status of all full-length H1 subtype HA sequences available in the NCBI influenza database. We devised the “flow index” (FI), a simple algorithm that calculates the tendency for viruses to gain or lose consensus glycosylation sites. The FI predicts the predominance of glycosylation states among existing strains. Our analyses show that while the number of glycosylation sites in the HA globular domain does not influence the overall magnitude of variation in defined antigenic regions, variation focuses on those regions unshielded by glycosylation. This supports the conclusion that glycosylation generally shields HA from antibody-mediated neutralization, and implies that fitness costs in accommodating oligosaccharides limit virus escape via HA hyperglycosylation.
Introduction
The influenza A virus (IAV) hemagglutinin (HA) is a homotrimeric glycoprotein that initiates infection by attaching virus to host cell sialic acids and mediating fusion of viral and endosomal membranes [1]. HA consists of a fibrous stem inserted into the viral membrane supporting a globular domain containing three sialic acid binding sites (one per monomer). Trimerization of nascent HA is necessary for HA folding and export from the early secretory pathway [2], [3], [4]. Nearly all antibodies (Abs) that neutralize viral infectivity (“neutralizing antibodies”) recognize epitopes in the globular domain. Most Abs neutralize infection by sterically blocking access of sialic acid receptors to the HA [5], [6].
Neutralizing Abs are the principal selective force driving HA evolution in man. The rapid emergence of mutants that escape Ab neutralization is termed “antigenic drift”, and has prevented effective long-term vaccination against IAV. Based on locating single amino acid substitutions that enable escape from neutralization with monoclonal Abs (mAbs), physically distinct regions have been defined on the globular domains of H1 (Sa, Sb, Ca, Cb) and H3 (A, B, C, D, E) subtype HAs [7], [8], [9]. We term the region of HA containing these sites, consisting of residues 58–272, the globular domain. Differences in the location of the antigenic sites in the globular domain correlate with the differential location of consensus N-linked oligosaccharide attachment sites in the H1 (PR8) vs. H3 (HK) HAs used for antigenic analysis [9], [10].
This raises the important question of the influence of HA glycosylation on antigenic drift. Other viral glycoproteins (e.g. HIV gp160) mask potential antigenic sites by hyperglycosylation [11], [12]. Addition of glycans to the globular domain has been directly shown to block neutralization of HA by monoclonal and polyclonal Abs [13]. Why doesn't IAV employ this strategy to a greater extent? A potential clue comes from the distinct evolution of H3 vs. H1 HAs in humans. Despite circulating for far less time in humans (41 years), H3 viruses have accumulated approximately twice as many glycosylation sites in the globular domain than H1 subtype viruses (circulating for ∼70 years - 1918–1957, 1977-present) [14], [15], [16], [17]. This is consistent with the idea that there are distinct fitness costs to glycosylation that vary among HA subtypes [13], [18], [19], [20].
Despite the potential importance of HA glycosylation in IAV evolution, there is a paucity of bioinformatics analysis of the large number of sequences accumulating in data banks. Here, we provide bioinformatics evidence that supports a critical role for glycosylation in focusing antigenic variation on non-glycosylated regions of the HA globular domain.
Results
Distribution of N-glycosylation sites in HA sequences
We analyzed 1907 full-length H1 HA sequences from human, swine or avian viruses downloaded from the NCBI influenza virus resource. NetNGlyc prediction of glycosylation sites (Asn-Xaa-Ser/Thr, where Xaa is any amino acid except Pro) in the globular domain reveals the non-random distribution of probable glycosylation sites at nine locations (Figure 1a). With few exceptions, glycosylation sites are located within 5 residues on either side of a consensus site. Consequently, for further analysis we defined conserved glycosylation sites within an 11-residue sequence centered on the consensus site.
Fig. 1. Distributions of the number and variability of glycosylation sites. 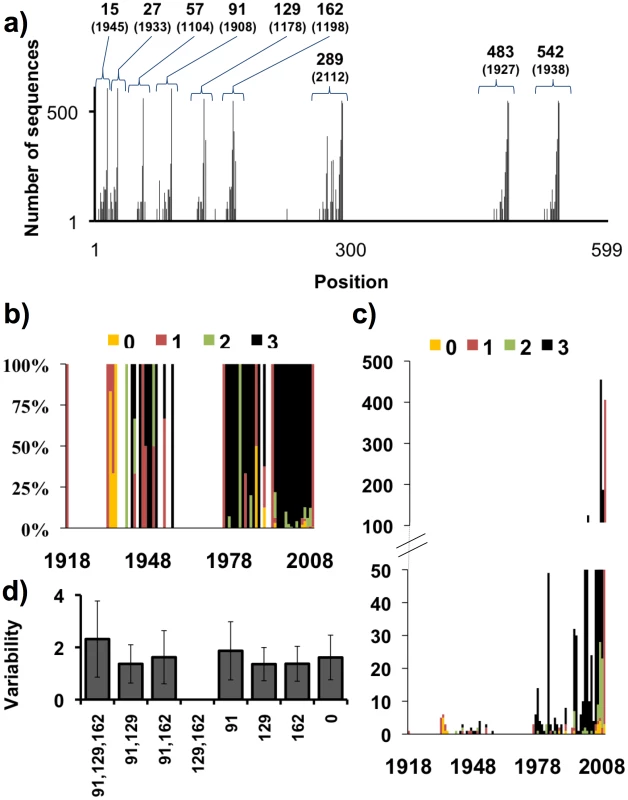
a) Distribution of glycosylation sites in HA sequences of H1N1 viruses. Each bar corresponds to the number of sequences with a glycosylation site at that position. Numbers on the top of the bars show the positions that tend to be more glycosylated. b) Distribution by years of the percentage of sequences that have 1, 2 or 3 glycosylation sites at the globular domain of HA (percentage). c) Distribution by years of the percentage of sequences that have 1, 2 or 3 glycosylation sites at the globular domain of HA (absolute values). d) Mean amino acids variability (quantitated by counting the number of different amino acids found at each position) +/− standard deviation in sequences with three glycosylation sites at the globular domain at positions 91,129,162, combinations of glycosylation sites of these three positions (there are no sequences with the combination of glycosylation sites at position 129 and 162), a single glycosylation or no glycosylation sites. Consistent with previous findings that efficient HA folding and assembly requires glycosylation at conserved sites, glycosylation sites at or near residues 15, 26, 289, 483, and 542 occur in virtually all HAs [4], [20], [26], [27], [28], [29], [30] (note that throughout the manuscript we use the H3 HA numbering system). These sites are located in the stem region of the HA (rendered in green in Figure 2) and may be conserved due to proper association with glycan binding-ER chaperones that facilitate HA folding and assembly [30]. The distribution of glycosylation sites in the H1 globular domain is variable, and is distributed among three regions centered on residues 91, 129 and 162 are rendered in red (Figure 2). For further analysis, we chose ±5 amino acids on each side of the conserved glycosylation sites to define glycosylation regions. It is well documented for H2 HA that addition of consensus glycosylation sites at these regions results in the predicted glycosylation, as determined by mobility shifts in SDS-PAGE [13].
Fig. 2. H1N1 HA glycosylation sites. 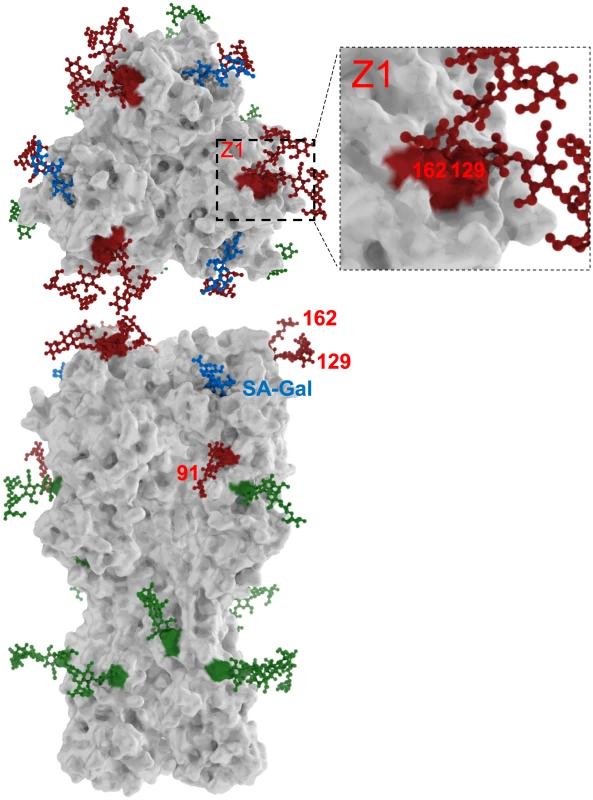
Three-dimensional model of HA as a solid surface viewed from the top and side of the trimeric molecule. Receptor sialic acid oligosaccharides associated with HA are shown in blue. Glycosylation sites are highlighted in green (conserved sites) or red and decorated with complex sugar moieties. Patterns of glycosylation at positions 91, 129 and 162 (red) are important in neutralization. The proximity of residues 129 and 162 clearly limits simultaneous glycosylation at these positions, since steric interference between the oligosaccharides would interfere with folding (zoomed region Z1). Due to their potential influence on antigenic drift, we focused our attention on the glycosylation sites in the H1 HA globular domain, which center on residues 91, 129, and 162. We temporally analyzed the presence of glycosylation sites in viruses isolated from 1918 to present. Though this analysis is hindered by the limited number of sequences available until 1995, two trends are apparent: an increase in glycosylation sites from zero/one as HA evolved from the 1918 strain to three sites typical for contemporary H1N1 viruses, and an abrupt reintroduction of a single glycosylation site with the appearance of SOIV in 2009 (Figure 1b, c). With three glycosylation sites, there are eight permutations of glycosylation status, all three (1), 2 of 3 (3), one of three (3), and none (1) (Figure 1d). Our analysis revealed the complete absence of HAs with glycosylation sites at positions 129 and 162. Interestingly, these sites are essentially adjacent in the 3-dimensional structure. Thus, it is not surprising that simultaneous glycosylation would have deleterious effects on HA folding, providing strong negative selection; what is more surprising that selection against the two sites is alleviated by a glycosylation site at residue 91, which is located further down the HA trimer (Figure 2). Since glycosylation occurs co-translationally, glycosylation at 91 would precede glycosylation at 129/162, and could limit the extent to which 129 and 162 are simultaneously glycosylated, accounting for its ability to modulate negative selection against adjacent sites. Alternatively, the absence of 129 162 dual glycosylation isolates may relate to historical evolution factors.
Affect of glycosylation on HA evolution
Does glycosylation focus drift on selected antigenic sites? We correlated the location of glycosylation sites with the variability at individual residues in the globular domain (Figure 3). This revealed that glycosylation alters the focus of sequence variation. In HAs lacking glycosylation sites in the antigenic domain, variability peaks near residue 135. Acquisition of a glycosylation site in the same region (129) results in reduction of variability in that region, and increase in variability at residues 78, 159, and 228, which represent the Cb, Sb, and Ca antigenic sites. Acquisition of two glycosylation sites at 91 and 129 now focuses variation at residues 165 and 190. With all three glycosylation sites utilized, variation is now focused around residues 190 and 191. Interestingly, positions 190 and 228 greatly influence HA receptor specificity for α-2,3 vs. α-2,6 of the sialic residue [31], [32].
Fig. 3. Relationship between amino acid variability and presence of glycosylation sites in H1 globular domain. 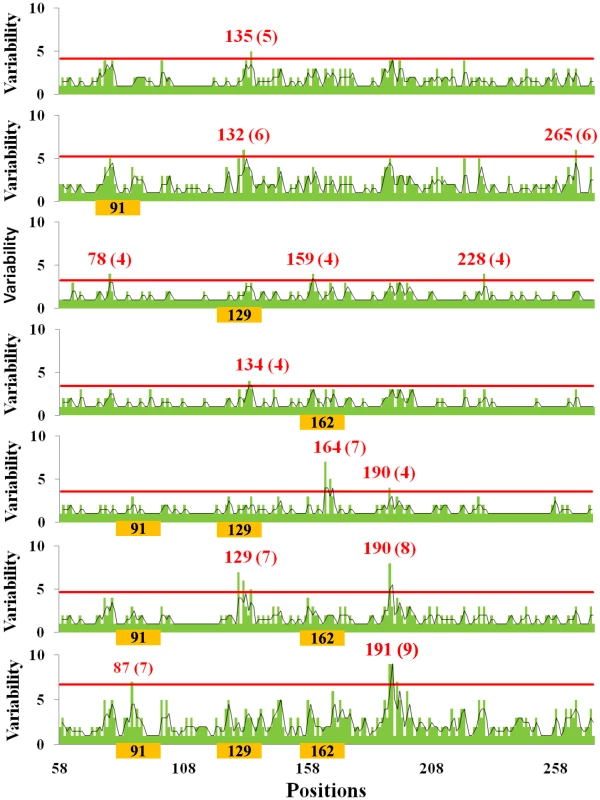
The plots correspond to H1 HA with the glycosylation sites indicated on the X-axis. Sequences with 2 glycosylation sites in regions 129 and 162 were not found. Green bars plot the number of amino acids present at each position in the group of isolates with specific number of oligosaccharide sites indicated, black lines are the running average of two neighboring positions. The positions and the number of different amino acid residues in each hypervariable region (in parentheses) are shown in red, i.e., those regions that have a variability of 3 standard deviations over the mean value (red line). Number of isolates available for each glycosylation stat: zero sites, 21 isolates; 1 site, position 91, 420 isolates; position 129, 10 isolates; position 162, 4 isolates; 2 sites, positions 91, 129, 34 isolates; 91, 162, 33 isolates; 3 sites, 1118 isolates. Each combination of glycosylation sites generates a similar pattern: glycosylation minimizes variation around its own site while focusing variation onto non-glycosylated sites. The statistical significance of this conclusion is shown in Figure 4. A simple interpretation for this finding is that oligosaccharides shield antigenic regions from Ab neutralization, shifting variation to unshielded sites. This is consistent with the observation that viruses cluster in the PCA plot based on a common number of glycosylation sites in the globular domain and not year of collection (Figure S2), which demonstrates that they are highly homologous in the hypervariable regions of the globular domain.
Fig. 4. Mean values of variability of H1 globular domain. 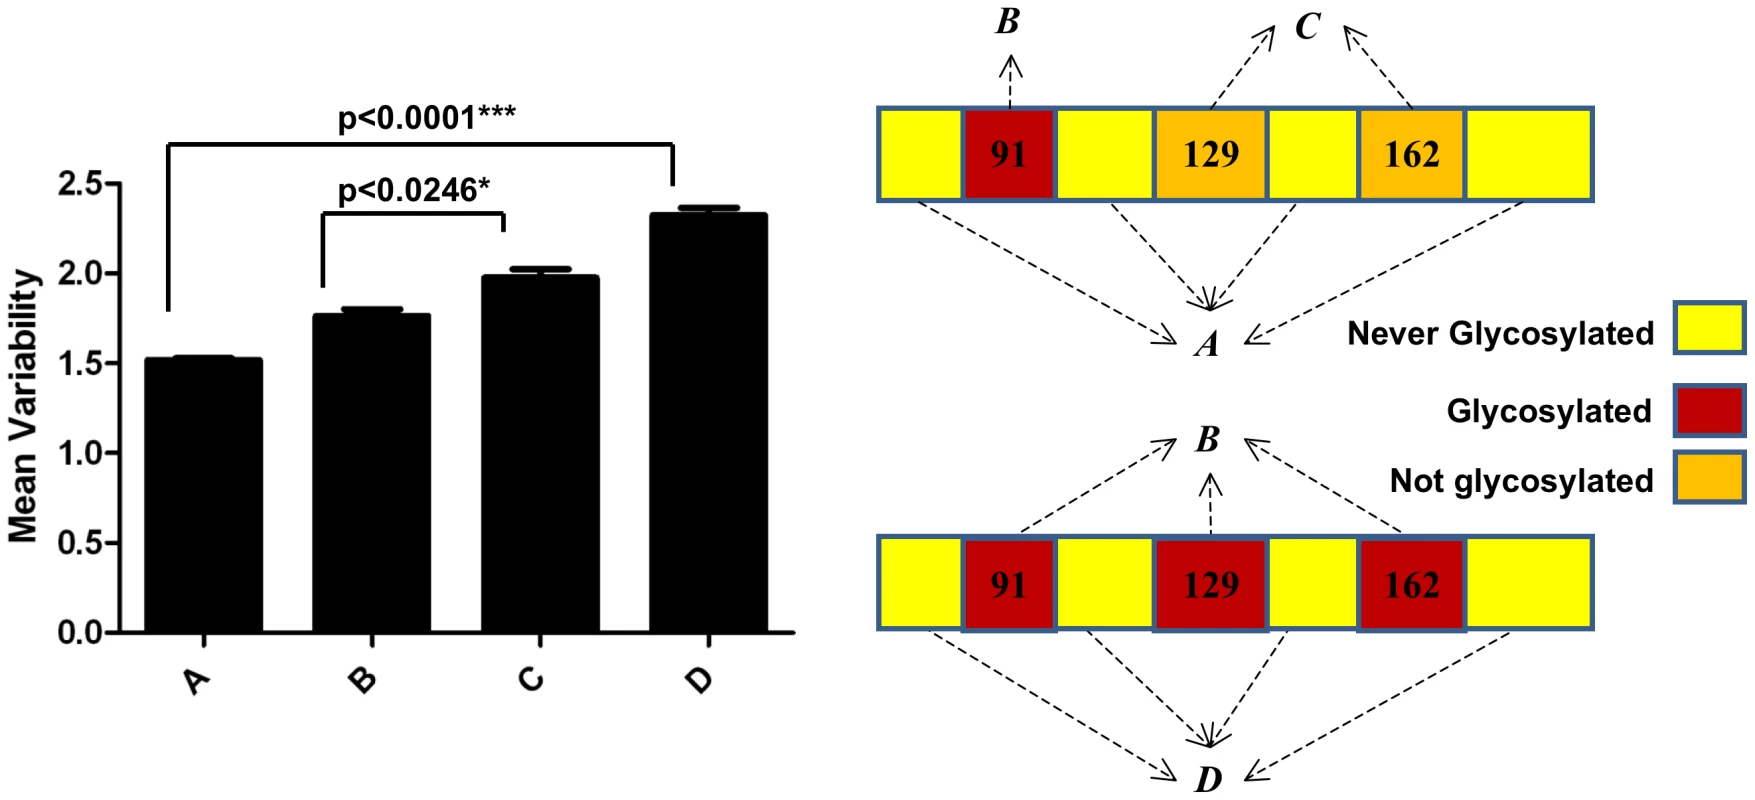
Mean values of variability at A) non-glycosylated regions of HA globular domain; B) glycosylation sites that are glycosylation competent (i.e. possess consensus glycosylation sites); C) regions that are glycosylated in HA but lack glycosylation sequences; D) non-glycosylated regions of HA from sequences with 3 glycosylation sequences. To reconstruct this plot, glycosylated regions considered positions 91,129 and 162 +/−3 amino acids. Confidence intervals estimated by bootstrap of 500 replicates [44]. Schematic representations of the regions used to calculate mean values of A, B, C and D are shown on right. If glycosylation can affect the pattern of antigenic variation, is there a correlation between number of antigenic domain glycosylation sites and antigenic variation? There is no clear relationship between the number of sites and the overall variability of amino acids between the residues that comprise the globular domain (58–272) (Figure 1d), indicating that the overall extent of glycosylation does not globally limit variation in antigenic regions.
We extended this approach to H2N2 and H3N2 HA sequences. H2N2 viruses possess a single glycosylation site in the globular domain, located at position 166 (Figure 5a). Consistent with the H1 data, analysis of H2N2 viruses showed limited variation near the sole glycosylation site at position 166 (Figure 5b).
Fig. 5. Distribution of glycosylation sites in H2N2 viruses and influence on HA variability. 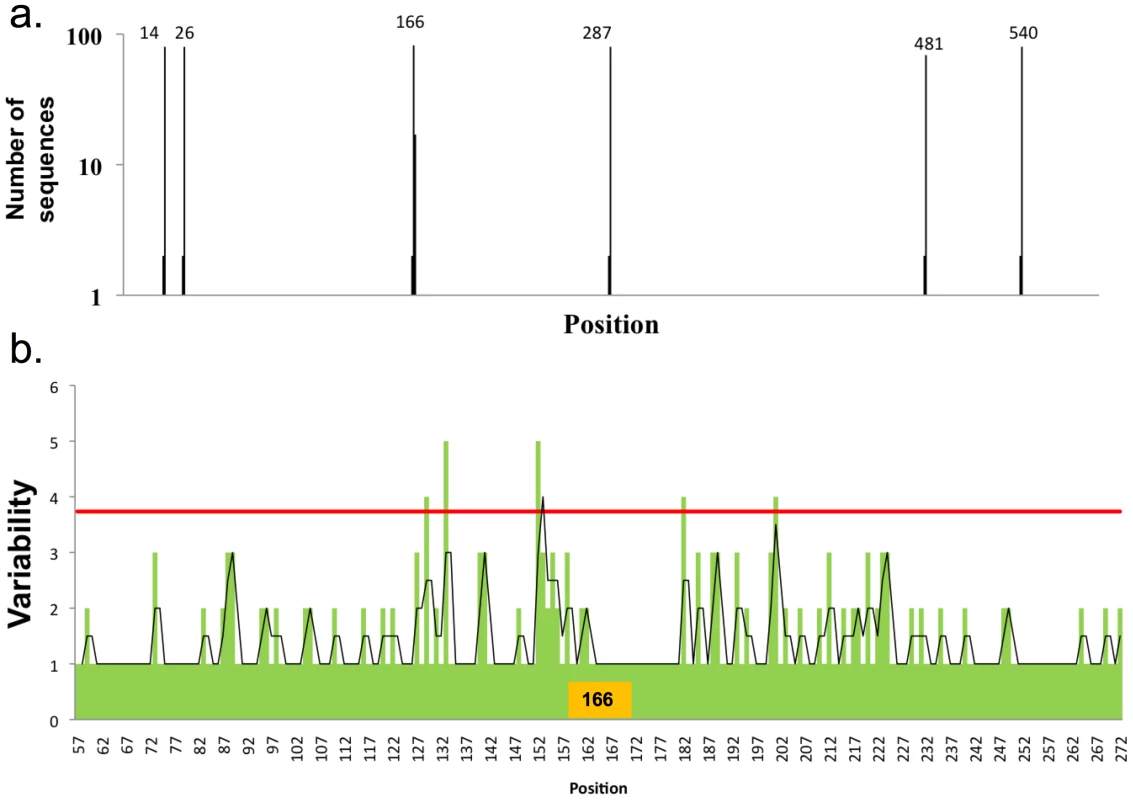
a) Distribution of glycosylation sites in H2N2 viruses as in Figure 1A, 83 full-length sequences were used in this analysis. b) Variability in the globular domain of H2N2 viruses, as in Figure 3. H3N2 viruses have up to six glycosylation sites on the globular domain of HA (Figure 6). When we sorted H3 sequences based on number of glycosylation sites, we found a distinct trend compared to H1 HA in acquiring glycosylation sites. Position 168 is the most conserved position glycosylation in H3 sequences. When there is one glycosylation, it's nearly invariably at position 168 (with a few isolates with lone glycosylation at position 84). Double glycosylation is dominated by the 84, 168 pairing. Remarkably, triple gycosylation is dominated by 168 with two novel sites: 66 and 129. Adding glycosylation at residue 259 uniformly attains four-site glycosylation. Adding sites between residues 129 and 168 achieve higher order glycosylation.
Fig. 6. Distribution of glycosylation sites H3N2 viruses. 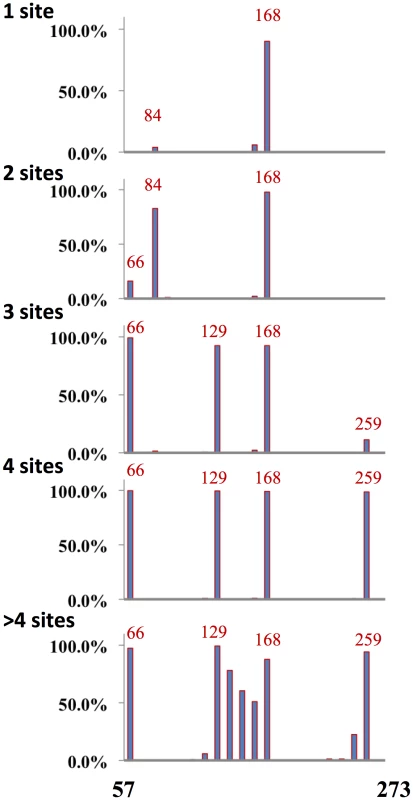
H3N2 viruses were binned according to the number of glycosylation sites in the globular domain as indicated. Plotted is the percentage of viruses with glycosylation sites in the position designated. A total of 2791 H3N2 full-length sequences were used in this analysis. We next examined the correlation between the location glycosylation site and regions of variability for H3 viruses with 2 to 4 sites in the globular domain (Figure 7). Analysis of other glycoforms was compromised by either paucity of isolates in a group or by the complexity of glycosylation pattern. Although there was a reasonable correlation between the presence of a glycosylation site and absence of variation in the residues surrounding the site, this relationship was less robust than for the H1 and H2 HAs (as indicated by the arrows pointing to exceptions).
Fig. 7. Relationship between amino acid variability and presence of glycosylation sites in H3 globular domain. 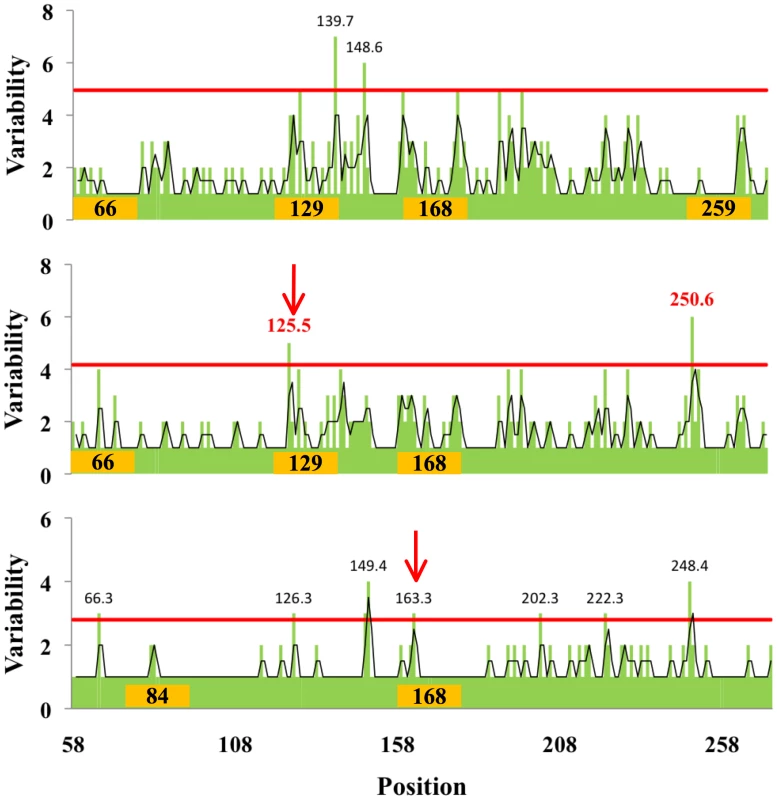
Variability in the globular domain of H3N2 viruses as in Figure 3. Arrows point to glycosylation sites that do not limit variability in the adjacent residues. Predicting oligosaccharide evolution
Is it possible to predict the tendency of acquisition of glycosylation sites (losses as well as gains) as a function of likelihood of mutation of codons present in the glycosylation regions? We devised a simple algorithm, termed the flow index (FI) to model glycan site evolution based on the sequences present in the glycosylation regions of H1N1 viruses with a given oligosaccharide status. The tendency of mutating to (green arrow) or from (red arrow) a given glycosylation state is assigned is shown in Figure 8. Summing the probabilities to and from a given state provides a measure of the probability of remaining in that state (Table S1).
Fig. 8. Schematic representation of the flow among the different states of the virus generated by the Flow Index. 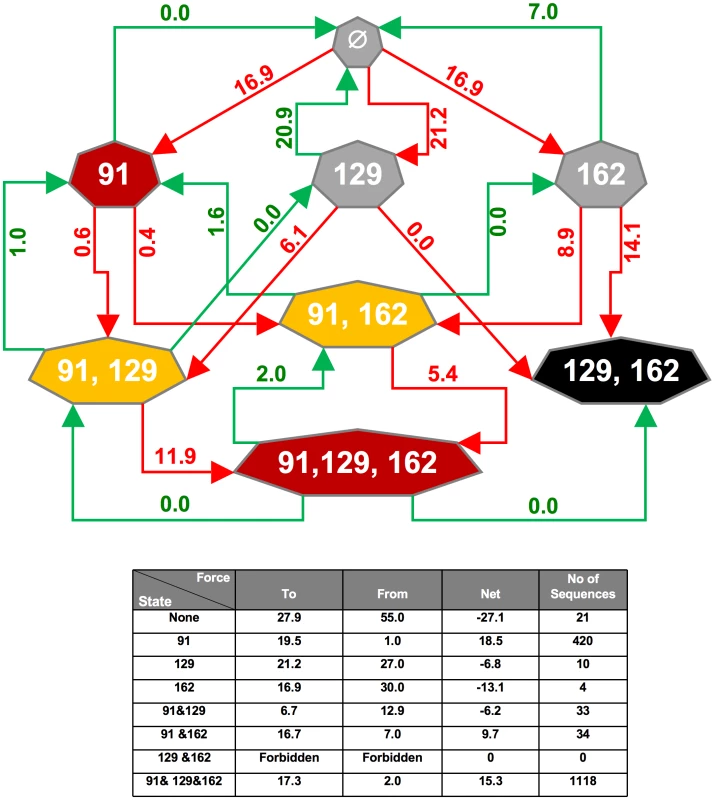
Each heptagon represents a glycosylation state of H1 HAs from human viruses isolated until mid-2009 (i.e. no Swine origin HAs are represented). Based on the number of isolates with each glycosylation pattern (show in the Table below as number of sequences), we binned viruses into optimal (red), sub-optimal states (yellow), transitional (grey) and lone lethal state (black). The different states are connected by red arrows to indicate an increase in the number of glycosylation from the pre-state to the post-state or green arrows to indicate a decrease in the number of glycosylation sites. Values of arrows indicate the Flow Index (FI), i.e., the tendency of going from one pre-state to a post-state. Data for figure are provided in Table S1. The net FI acting on each state is given by the sum of the forces as calculated in the Table below, note that this correlates well with the number of isolates in a given state. Despite its simplicity, this algorithm reasonably accurately reflects the prevalence of glycoforms among the H1 isolates in the database. The most notable exception is the 129+162 glycoform, which is not represented by any isolate despite having a facile mutational path. As noted above, this may be due to the proximity of these residues in the folded structure, which may interfere with folding of the globular domain (Figure 2). This exception points to the contribution of functional selection in the prevalence of glycoforms.
Unfortunately, we could not calculate a FI for H2 or H3 HA evolution due to either low number of sequences of viruses in a given group or the complexity of the glycosylation patterns.
Analysis of SOIV evolution
The recent introduction of SOIV into the human population offers a unique opportunity to study IAV evolution in humans at high resolution in real time [33], [34], [35]. Nearly all of the 212 unique SOIV isolates downloaded on October 12th 2009 possess oligosaccharide site at position 91. How does the pattern of variation of SOIVs compare to human H1 isolates or classic Swine isolates that also possess a single oligosaccharide site at position 91?
As seen in Figure 9, despite their limited time in humans, SOIVs demonstrate a remarkable amount of variation, peaking around positions 225 and 264, with other hot spots at residues 77 and 135 (Figure 9b). This pattern differs from human H1N1 isolated from 1918 to present (Figure 9c), which show far less variation at residues 225 and 264 regions while focusing variation near 77, 135 and 190 regions. Classic swine viruses (Figure 9d) show a different pattern of variation, focused at residues 147 and 200 (note that the data shown in Figure 3b include all isolates with a single glycosylation site at position 91).
Fig. 9. Relationship between amino acid variability and presence of glycosylation sites in Swine H1 globular domain. 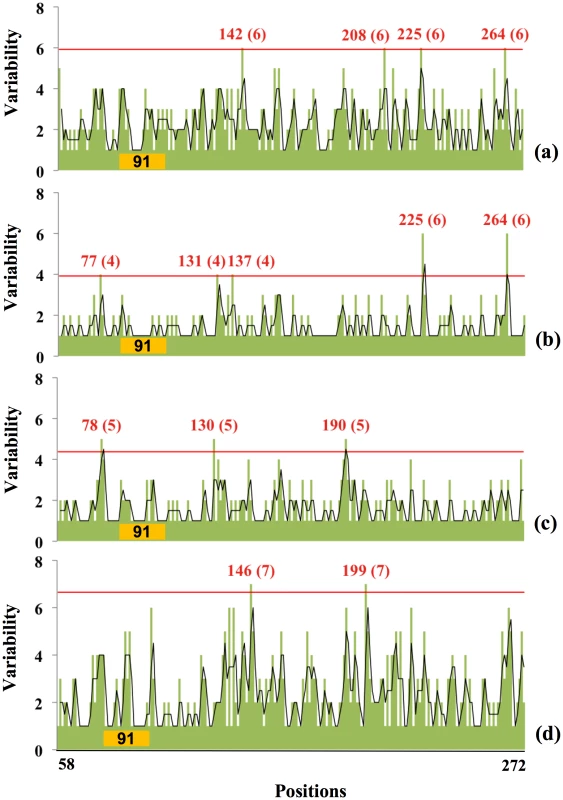
The plots correspond to a) Swine-origin 2009 H1N1 HA sequences (31st March, 2010) which has 1 glycosylation site in region 91; b) Swine-origin 2009 H1N1 HA sequences (12th October, 2009) which has 1 glycosylation site in region 91; c) Human virus HAs from 1918–2008 with 1 glycosylation site in region 91; d) Swine virus HA sequences from 1918–2008 with 1 glycosylation site in region 91. The positions and the number of possible amino acids of hyper-variable regions are shown as in Figure 3. We again downloaded available unique full-length SOIV sequences on March 31st to examine variability over the course of six months (Figure 9a). Apart from variability at position 225 and 264, there is a higher variability near position 142 (Sb-site) that was absent in October.
Can we predict the evolution of SOIV glycoforms using the FI? FI of the October sequences for loss of oligosaccharide at 91 or gain at 129 or 162 is each calculated to be zero, i.e. two amino substitutions are required to insert a glycan at these regions. Indeed, the sequences downloaded on March 2010 showed a strong tendency to maintain glycosylation at position 91, though a few isolates lose glycosylation at 91 (10 isolates) or gain glycosylation at 162 (5 isolates) [36]. We therefore predict that a single glycosylation site at position 91 at the antigenic domain will predominate in SOIV isolates for a prolonged period.
Discussion
It has been known for more than 70 years that IAV, unlike many viruses, demonstrates significant antigenic variation. The epidemiological significance of antigenic variation in IAV was unmistakable from the failure of the 1947 vaccination campaign [37], [38]. Despite considerable effort and significant gains in understanding HA antigenic structure, much remains to be learned about how drift occurs in humans. The revolution in nucleic acid sequencing technology provides enormous opportunities to better understand drift. Here, we utilize the NCBI influenza resource to examine the relationship between glycosylation in the HA globular domain and antigenic variation.
The ability of oligosaccharides to sterically block antibody binding to HA antigenic sites was clearly established with the original definition of antigenic sites on the HA structure using mAbs [39], [40]. Surprisingly, however, the more global effects of oligosaccharides on HA evolution have been examined in only a few publications [17], [41], [42]. We detect a clear influence of oligosaccharides in directing the focus of variation to the established neutralizing antibody binding sites on the H1 and H2 HAs. We also find a similar pattern among H3 HAs with 2–4 globular domain glycosylation sites, but note exceptions to the relationship (arrows in Figure 6), that might contribute to the finding of a prior bioinformatics analysis of H3 isolates that failed to detect a relationship between glycosylation and the locus of variability [41]. This potential difference in glycosylation in shaping HA evolution might be related to a major difference in H1 vs. H3 HA evolution: while H3 remained in human populations constantly from its introduction in 1968 until the present time, after the complete replacement of H1 in 1957 by H2 viruses, it re-appeared in 1977 in the form of the 1950 virus, almost certainly as a result of a re-introduction from a laboratory sample.
While there is a tendency towards adding oligosaccharides to the H1 HA with time, the process is slower than might be expected. H1 viruses have circulated in humans for at least 80 years in the period between 1918 and present time, yet only possess 3 globular domain glycosylation sites while H3 HAs have up to six glycosylation sites in the globular domain.
It is important to note that we have not experimentally established that antibody pressure is responsible for the influence of oligosaccharides on variation in the globular domain. Although it seems less likely, it is possible that oligosaccharides influence HA evolution by modulating the mutation space of globular domain residues.
We show that the sequence space in the regions of the globular domain where oligosaccharides can be accommodated appears to play a surprisingly robust role (since at most, only two amino acid changes are needed to create a glycosylation site) in influencing the evolutionary acquisition of additional glycosylation sites. Thus, although the FI is hampered by historical biases in the number of isolates collected during the course of IAV evolution in man (and by alterations in glycosylation that accompany adaptation to growth in eggs or cultured cells [43]), it nonetheless is able to predict the prevalence of HA glycoforms in H1N1 isolates. That the FI is a less than perfect prognosticator is expected, since sequence space does not completely account for oligosaccharide evolution. A critical missing factor is the fitness of the various glycoforms, both in terms of viral replication in the human host, and also the ability of virus to evade neutralizing antibodies. Oligosaccharides are well known to influence HA function, particularly binding to host cell receptors and of course, in shielding HA from Ab mediated neutralization.
Indeed, the major point of this work is that oligosaccharides influence HA evolution in antigenic regions. Notably, while the number of oligosaccharides in the globular domain has little gross effect on the overall variation (Figure 1d), it focuses variation on uncovered antigenic epitopes. This supports the idea that glycosylation is an effective strategy for deflecting neutralizing Abs. Why then, doesn't HA simply cover itself with oligosaccharides?
The likely answer is that HA simply can't block all neutralization sites with oligosaccharides and maintain its function. This may be a more difficult evolutionary task than it appears at first glance, since HIV gp160 is the exception among viral receptor proteins rather than the rule. Perhaps there are yet to be defined host molecules that recognize hyperglycosylated proteins to limit this strategy.
Materials and Methods
Source of sequences
A first set of 4781 full length HA sequences (full-length sequences from all hosts and geographic origins) were downloaded on June 26th, 2009 from the influenza virus resource at the NCBI (http://www.ncbi.nlm.nih.gov/genomes/FLU). These include 1907 H1N1, 83 H2N2 and 2791 H3N2 sequences. A second set of 212 swine origin influenza virus (SOIV) H1N1 HA sequences) was downloaded on 12th October 2009, followed by a third set of 1339 full-length SOIV sequence was downloaded on March 31st 2010.
Prediction of N-glycosylation sites
The NetNGlyc 1.0 web-server (http://www.cbs.dtu.dk/services/NetNGlyc) was used to predict N-Glycosylation sites (Asn-Xaa-Ser/Thr, where Xaa is any amino acid except Pro) of all HA sequences; a positive was scored when the jury returned a “+” score. According to NetNGlcy, 76% of positive scored sequons are modified by N-Glycans, with a bias towards Thr containing sequons [21], [22], [23], [24].
Multiple sequence alignment
All HA sequences of H1N1 were aligned in a single common alignment using the program Muscle [25] with default parameters.
Principal Components Analysis of the amino acid composition
The amino acids composition of the sequences was used to perform a multivariate analysis called Principal Components Analysis (PCA). The PCA analysis of the amino acids composition was performed using the prcomp function of the R package (http://www.r-project.org). This analysis performs a decomposition of the variables, e.g. the abundance of each amino acid (20 variables), into each principal component. The first two components of the PCA, showed in the plots 1 and 2, preserve 59% of the total variability (Figure S2).
Amino acid variability
Amino acid variability was quantitated from position 58 through 272 (globular domain). Figure 3 shows the amount of variability in H1 HA at each position. Variability was quantitated by counting the number of different amino acids found at each position, i.e. a position where all sequences have the same amino acid, the value of variability is 1, while for example a variability value of 7 corresponds to a position that have 7 different possible amino acids. Likewise, variability of H2 HA and some H3 HAs at each position were calculated (Figure 4 and 6). Regions of the H1 HA globular domain 91, 129 and 162+/−5 amino acids were selected to calculate the Flow Index.
Defining the “Flow Index”
H1 HA sequences were sorted based on their glycosylation status (i.e., Ø; 91; 129; 162; 91,129; 91,162; 91,129,162). Sequences with the glycosylation sites at positions 129 and 162 were not found. The amino acids frequencies in each aligned amino acid position of these regions for each starting group were calculated. Then, using the amino acids frequencies at each position, a set of 10,000 “random” sequences of each group was generated. These “random” sequences, which maintain the amino acids frequencies of the actual sequences, correspond to the initial “pre-state” to run the simulations.
We performed two independent rounds of simulation (flow-charted in Figure S1). Since the tendency of the virus is to maintain its glycosylation status, a change in status rarely occurs in a single round of simulation. The first round (left side Figure S1) uses the amino acids frequencies of each pre-state. Then, choosing a position at random in a glycosylation region, an amino acid substitution based on the amino acid frequencies at the same position is made (i.e. random substitution guided by the amino acids frequencies of the pre-state sequence). Using this data set, we enumerated the number of times that single changes in glycosylation site number occurred (gain or loss) per 10,000 iterations, and calculated the Pdi, the probability of changing glycosylation status. In the second simulation round (right side, Figure S1), repeated rounds of simulation are performed until a change occurs, resulting in Pdi→j the probability of changing from a pre-state to a post-state that differ by a single glycosylation site (gain or loss). The Flow Index (FI) is defined as the product of the two rounds and provides a measure of the tendency of changing from a pre-state i to a post-state j.Since the FI is based on the frequency of amino acid of all sequences in the starting group, it is free of constraints imposed by a consensus sequence. In addition, the FI also takes selection into account, since only sequences of viable viruses are used in the simulated mutagenesis.
Supporting Information
Zdroje
1. SkehelJJ
WileyDC
2000 Receptor binding and membrane fusion in virus entry: the influenza hemagglutinin. Annu Rev Biochem 69 531 569
2. RussG
BenninkJR
BachiT
YewdellJW
1991 Influenza virus hemagglutinin trimers and monomers maintain distinct biochemical modifications and intracellular distribution in brefeldin A-treated cells. Cell Regul 2 549 563
3. YewdellJW
YellenA
BachiT
1988 Monoclonal antibodies localize events in the folding, assembly, and intracellular transport of the influenza virus hemagglutinin glycoprotein. Cell 52 843 852
4. DanielsR
KurowskiB
JohnsonAE
HebertDN
2003 N-linked glycans direct the cotranslational folding pathway of influenza hemagglutinin. Mol Cell 11 79 90
5. WilsonIA
SkehelJJ
WileyDC
1981 Structure of the haemagglutinin membrane glycoprotein of influenza virus at 3 A resolution. Nature 289 366 373
6. WileyDC
WilsonIA
SkehelJJ
1981 Structural identification of the antibody-binding sites of Hong Kong influenza haemagglutinin and their involvement in antigenic variation. Nature 289 373 378
7. GerhardW
YewdellJ
FrankelME
WebsterR
1981 Antigenic structure of influenza virus haemagglutinin defined by hybridoma antibodies. Nature 290 713 717
8. YewdellJW
GerhardW
1981 Antigenic characterization of viruses by monoclonal antibodies. Annu Rev Microbiol 35 185 206
9. CatonAJ
BrownleeGG
YewdellJW
GerhardW
1982 The antigenic structure of the influenza virus A/PR/8/34 hemagglutinin (H1 subtype). Cell 31 417 427
10. WileyDC
SkehelJJ
1987 The structure and function of the hemagglutinin membrane glycoprotein of influenza virus. Annual Reviews in Biochemistry 56 365 394
11. ZhangM
GaschenB
BlayW
FoleyB
HaigwoodN
2004 Tracking global patterns of N-linked glycosylation site variation in highly variable viral glycoproteins: HIV, SIV, and HCV envelopes and influenza hemagglutinin. Glycobiology 14 1229 1246
12. VigerustDJ
ShepherdVL
2007 Virus glycosylation: role in virulence and immune interactions. Trends Microbiol 15 211 218
13. TsuchiyaE
SugawaraK
HongoS
MatsuzakiY
MurakiY
2002 Effect of addition of new oligosaccharide chains to the globular head of influenza A/H2N2 virus haemagglutinin on the intracellular transport and biological activities of the molecule. J Gen Virol 83 1137 1146
14. SchulzeIT
1997 Effects of glycosylation on the properties and functions of influenza virus hemagglutinin. J Infect Dis 176 Suppl 1 S24 28
15. Mir-ShekariSY
AshfordDA
HarveyDJ
DwekRA
SchulzeIT
1997 The glycosylation of the influenza A virus hemagglutinin by mammalian cells. A site-specific study. J Biol Chem 272 4027 4036
16. IgarashiM
ItoK
KidaH
TakadaA
2008 Genetically destined potentials for N-linked glycosylation of influenza virus hemagglutinin. Virology 376 323 329
17. CherryJL
LipmanDJ
NikolskayaA
WolfYI
2009 Evolutionary dynamics of N-glycosylation sites of influenza virus hemagglutinin. PLoS Curr Influenza RRN1001
18. DeshpandeKL
FriedVA
AndoM
WebsterRG
1987 Glycosylation affects cleavage of an H5N2 influenza virus hemagglutinin and regulates virulence. Proc Natl Acad Sci U S A 84 36 40
19. WangCC
ChenJR
TsengYC
HsuCH
HungYF
2009 Glycans on influenza hemagglutinin affect receptor binding and immune response. Proc Natl Acad Sci U S A 106 18137 18142
20. WagnerR
HeuerD
WolffT
HerwigA
KlenkHD
2002 N-Glycans attached to the stem domain of haemagglutinin efficiently regulate influenza A virus replication. J Gen Virol 83 601 609
21. Ben-DorS
EstermanN
RubinE
SharonN
2004 Biases and complex patterns in the residues flanking protein N-glycosylation sites. Glycobiology 14 95 101
22. PetrescuAJ
MilacAL
PetrescuSM
DwekRA
WormaldMR
2004 Statistical analysis of the protein environment of N-glycosylation sites: implications for occupancy, structure, and folding. Glycobiology 14 103 114
23. BreuerW
KleinRA
HardtB
BartoschekA
BauseE
2001 Oligosaccharyltransferase is highly specific for the hydroxy amino acid in Asn-Xaa-Thr/Ser. FEBS Lett 501 106 110
24. KasturiL
EshlemanJR
WunnerWH
Shakin-EshlemanSH
1995 The hydroxy amino acid in an Asn-X-Ser/Thr sequon can influence N-linked core glycosylation efficiency and the level of expression of a cell surface glycoprotein. J Biol Chem 270 14756 14761
25. EdgarRC
2004 MUSCLE: multiple sequence alignment with high accuracy and high throughput. Nucleic Acids Res 32 1792 1797
26. GallagherPJ
HenneberryJM
SambrookJF
GethingMJ
1992 Glycosylation requirements for intracellular transport and function of the hemagglutinin of influenza virus. J Virol 66 7136 7145
27. GallagherP
HenneberryJ
WilsonI
SambrookJ
GethingMJ
1988 Addition of carbohydrate side chains at novel sites on influenza virus hemagglutinin can modulate the folding, transport, and activity of the molecule. J Cell Biol 107 2059 2073
28. KlenkHD
WagnerR
HeuerD
WolffT
2002 Importance of hemagglutinin glycosylation for the biological functions of influenza virus. Virus Res 82 73 75
29. OhuchiR
OhuchiM
GartenW
KlenkHD
1997 Oligosaccharides in the stem region maintain the influenza virus hemagglutinin in the metastable form required for fusion activity. J Virol 71 3719 3725
30. HebertDN
FoellmerB
HeleniusA
1996 Calnexin and calreticulin promote folding, delay oligomerization and suppress degradation of influenza hemagglutinin in microsomes. EMBO J 15 2961 2968
31. StevensJ
BlixtO
TumpeyTM
TaubenbergerJK
PaulsonJC
2006 Structure and receptor specificity of the hemagglutinin from an H5N1 influenza virus. Science 312 404 410
32. NichollsJM
ChanRW
RussellRJ
AirGM
PeirisJS
2008 Evolving complexities of influenza virus and its receptors. Trends Microbiol 16 149 157
33. GartenRJ
DavisCT
RussellCA
ShuB
LindstromS
2009 Antigenic and genetic characteristics of swine-origin 2009 A(H1N1) influenza viruses circulating in humans. Science 325 197 201
34. ItohY
ShinyaK
KisoM
WatanabeT
SakodaY
2009 In vitro and in vivo characterization of new swine-origin H1N1 influenza viruses. Nature 460 1021 1025
35. NeumannG
NodaT
KawaokaY
2009 Emergence and pandemic potential of swine-origin H1N1 influenza virus. Nature 459 931 939
36. WeiCJ
BoyingtonJC
DaiK
HouserKV
PearceMB
Cross-neutralization of 1918 and 2009 influenza viruses: role of glycans in viral evolution and vaccine design. Sci Transl Med 2 24ra21
37. FrancisT
SalkJE
QuilliganJJ
1947 Experience with Vaccination Against Influenza in the Spring of 1947: A Preliminary Report. Am J Public Health Nations Health 37 1013 1016
38. FrancisTJr
1947 Apparent serological variation within a strain of influenza virus. Proc Soc Exp Biol Med 65 143 147
39. SkehelJJ
StevensDJ
DanielsRS
DouglasAR
KnossowM
1984 A carbohydrate side chain on hemagglutinins of Hong Kong influenza viruses inhibits recognition by a monoclonal antibody. Proc Natl Acad Sci U S A 81 1779 1783
40. XuR
EkiertDC
KrauseJC
HaiR
CroweJEJr
Structural Basis of Preexisting Immunity to the 2009 H1N1 Pandemic Influenza Virus. Science
41. BlackburneBP
HayAJ
GoldsteinRA
2008 Changing selective pressure during antigenic changes in human influenza H3. PLoS Pathog 4 e1000058
42. TamuriAU
Dos ReisM
HayAJ
GoldsteinRA
2009 Identifying changes in selective constraints: host shifts in influenza. PLoS Comput Biol 5 e1000564
43. GambaryanAS
RobertsonJS
MatrosovichMN
1999 Effects of egg-adaptation on the receptor-binding properties of human influenza A and B viruses. Virology 258 232 239
44. WessaP
2008 Bootstrap Plot for Central Tendency (v1.0.3) in Free Statistics Software (v1.1.23-r6), Office for Research Development and Education. URL http://www.wessa.net/rwasp_bootstrapplot1.wasp/
Štítky
Hygiena a epidemiologie Infekční lékařství Laboratoř
Článek Tick Histamine Release Factor Is Critical for Engorgement and Transmission of the Lyme Disease AgentČlánek TGF-b2 Induction Regulates Invasiveness of -Transformed Leukocytes and Disease SusceptibilityČlánek The Origin of Intraspecific Variation of Virulence in an Eukaryotic Immune Suppressive Parasite
Článek vyšel v časopisePLOS Pathogens
Nejčtenější tento týden
2010 Číslo 11- Stillova choroba: vzácné a závažné systémové onemocnění
- Perorální antivirotika jako vysoce efektivní nástroj prevence hospitalizací kvůli COVID-19 − otázky a odpovědi pro praxi
- Diagnostika virových hepatitid v kostce – zorientujte se (nejen) v sérologii
- Jak souvisí postcovidový syndrom s poškozením mozku?
- Familiární středomořská horečka
-
Všechny články tohoto čísla
- Patients with Discordant Responses to Antiretroviral Therapy Have Impaired Killing of HIV-Infected T Cells
- A Molecular Mechanism for Eflornithine Resistance in African Trypanosomes
- Tyrosine Sulfation of the Amino Terminus of PSGL-1 Is Critical for Enterovirus 71 Infection
- Autoimmunity as a Predisposition for Infectious Diseases
- The Subtilisin-Like Protease AprV2 Is Required for Virulence and Uses a Novel Disulphide-Tethered Exosite to Bind Substrates
- Structural Analysis of HIV-1 Maturation Using Cryo-Electron Tomography
- Tick Histamine Release Factor Is Critical for Engorgement and Transmission of the Lyme Disease Agent
- Interferon-Inducible CXC Chemokines Directly Contribute to Host Defense against Inhalational Anthrax in a Murine Model of Infection
- TGF-b2 Induction Regulates Invasiveness of -Transformed Leukocytes and Disease Susceptibility
- The Origin of Intraspecific Variation of Virulence in an Eukaryotic Immune Suppressive Parasite
- CO Acts as a Signalling Molecule in Populations of the Fungal Pathogen
- SV2 Mediates Entry of Tetanus Neurotoxin into Central Neurons
- MAP Kinase Phosphatase-2 Plays a Critical Role in Response to Infection by
- Glycosylation Focuses Sequence Variation in the Influenza A Virus H1 Hemagglutinin Globular Domain
- Potentiation of Epithelial Innate Host Responses by Intercellular Communication
- Fcγ Receptor I Alpha Chain (CD64) Expression in Macrophages Is Critical for the Onset of Meningitis by K1
- ANK, a Host Cytoplasmic Receptor for the Cell-to-Cell Movement Protein, Facilitates Intercellular Transport through Plasmodesmata
- Analysis of the Initiating Events in HIV-1 Particle Assembly and Genome Packaging
- Evolution of Linked Avirulence Effectors in Is Affected by Genomic Environment and Exposure to Resistance Genes in Host Plants
- Structural Basis of HIV-1 Neutralization by Affinity Matured Fabs Directed against the Internal Trimeric Coiled-Coil of gp41
- Hepatitis C Virus (HCV) Evades NKG2D-Dependent NK Cell Responses through NS5A-Mediated Imbalance of Inflammatory Cytokines
- Host Cell Invasion and Virulence Mediated by Ssa1
- Global Gene Expression in Urine from Women with Urinary Tract Infection
- Should the Human Microbiome Be Considered When Developing Vaccines?
- HapX Positively and Negatively Regulates the Transcriptional Response to Iron Deprivation in
- Enhancing Oral Vaccine Potency by Targeting Intestinal M Cells
- Herpes Simplex Virus Reorganizes the Cellular DNA Repair and Protein Quality Control Machinery
- The Female Lower Genital Tract Is a Privileged Compartment with IL-10 Producing Dendritic Cells and Poor Th1 Immunity following Infection
- Zn Inhibits Coronavirus and Arterivirus RNA Polymerase Activity and Zinc Ionophores Block the Replication of These Viruses in Cell Culture
- Cryo Electron Tomography of Native HIV-1 Budding Sites
- Crystal Structure and Size-Dependent Neutralization Properties of HK20, a Human Monoclonal Antibody Binding to the Highly Conserved Heptad Repeat 1 of gp41
- Modelling the Evolution and Spread of HIV Immune Escape Mutants
- The Arabidopsis Resistance-Like Gene Is Activated by Mutations in and Contributes to Resistance to the Bacterial Effector AvrRps4
- Platelet-Activating Factor Receptor Plays a Role in Lung Injury and Death Caused by Influenza A in Mice
- Genetic and Structural Basis for Selection of a Ubiquitous T Cell Receptor Deployed in Epstein-Barr Virus Infection
- Ubiquitin-Regulated Nuclear-Cytoplasmic Trafficking of the Nipah Virus Matrix Protein Is Important for Viral Budding
- Pneumolysin Activates the NLRP3 Inflammasome and Promotes Proinflammatory Cytokines Independently of TLR4
- Immune Evasion by : Differential Targeting of Dendritic Cell Subpopulations
- Survival in Selective Sand Fly Vector Requires a Specific -Encoded Lipophosphoglycan Galactosylation Pattern
- PLOS Pathogens
- Archiv čísel
- Aktuální číslo
- Informace o časopisu
Nejčtenější v tomto čísle- Zn Inhibits Coronavirus and Arterivirus RNA Polymerase Activity and Zinc Ionophores Block the Replication of These Viruses in Cell Culture
- The Female Lower Genital Tract Is a Privileged Compartment with IL-10 Producing Dendritic Cells and Poor Th1 Immunity following Infection
- Crystal Structure and Size-Dependent Neutralization Properties of HK20, a Human Monoclonal Antibody Binding to the Highly Conserved Heptad Repeat 1 of gp41
- The Arabidopsis Resistance-Like Gene Is Activated by Mutations in and Contributes to Resistance to the Bacterial Effector AvrRps4
Kurzy
Zvyšte si kvalifikaci online z pohodlí domova
Autoři: prof. MUDr. Vladimír Palička, CSc., Dr.h.c., doc. MUDr. Václav Vyskočil, Ph.D., MUDr. Petr Kasalický, CSc., MUDr. Jan Rosa, Ing. Pavel Havlík, Ing. Jan Adam, Hana Hejnová, DiS., Jana Křenková
Autoři: MUDr. Irena Krčmová, CSc.
Autoři: MDDr. Eleonóra Ivančová, PhD., MHA
Autoři: prof. MUDr. Eva Kubala Havrdová, DrSc.
Všechny kurzyPřihlášení#ADS_BOTTOM_SCRIPTS#Zapomenuté hesloZadejte e-mailovou adresu, se kterou jste vytvářel(a) účet, budou Vám na ni zaslány informace k nastavení nového hesla.
- Vzdělávání


