-
Články
Top novinky
Reklama- Vzdělávání
- Časopisy
Top články
Nové číslo
- Témata
Top novinky
Reklama- Kongresy
- Videa
- Podcasty
Nové podcasty
Reklama- Kariéra
Doporučené pozice
Reklama- Praxe
Top novinky
ReklamaHIV Integration Targeting: A Pathway Involving Transportin-3 and the Nuclear Pore Protein RanBP2
Genome-wide siRNA screens have identified host cell factors important for efficient HIV infection, among which are nuclear pore proteins such as RanBP2/Nup358 and the karyopherin Transportin-3/TNPO3. Analysis of the roles of these proteins in the HIV replication cycle suggested that correct trafficking through the pore may facilitate the subsequent integration step. Here we present data for coupling between these steps by demonstrating that depletion of Transportin-3 or RanBP2 altered the terminal step in early HIV replication, the selection of chromosomal sites for integration. We found that depletion of Transportin-3 and RanBP2 altered integration targeting for HIV. These knockdowns reduced HIV integration frequency in gene-dense regions and near gene-associated features, a pattern that differed from that reported for depletion of the HIV integrase binding cofactor Psip1/Ledgf/p75. MLV integration was not affected by the Transportin-3 knockdown. Using siRNA knockdowns and integration targeting analysis, we also implicated several additional nuclear proteins in proper target site selection. To map viral determinants of integration targeting, we analyzed a chimeric HIV derivative containing MLV gag, and found that the gag replacement phenocopied the Transportin-3 and RanBP2 knockdowns. Thus, our data support a model in which Gag-dependent engagement of the proper transport and nuclear pore machinery mediate trafficking of HIV complexes to sites of integration.
Published in the journal: . PLoS Pathog 7(3): e32767. doi:10.1371/journal.ppat.1001313
Category: Research Article
doi: https://doi.org/10.1371/journal.ppat.1001313Summary
Genome-wide siRNA screens have identified host cell factors important for efficient HIV infection, among which are nuclear pore proteins such as RanBP2/Nup358 and the karyopherin Transportin-3/TNPO3. Analysis of the roles of these proteins in the HIV replication cycle suggested that correct trafficking through the pore may facilitate the subsequent integration step. Here we present data for coupling between these steps by demonstrating that depletion of Transportin-3 or RanBP2 altered the terminal step in early HIV replication, the selection of chromosomal sites for integration. We found that depletion of Transportin-3 and RanBP2 altered integration targeting for HIV. These knockdowns reduced HIV integration frequency in gene-dense regions and near gene-associated features, a pattern that differed from that reported for depletion of the HIV integrase binding cofactor Psip1/Ledgf/p75. MLV integration was not affected by the Transportin-3 knockdown. Using siRNA knockdowns and integration targeting analysis, we also implicated several additional nuclear proteins in proper target site selection. To map viral determinants of integration targeting, we analyzed a chimeric HIV derivative containing MLV gag, and found that the gag replacement phenocopied the Transportin-3 and RanBP2 knockdowns. Thus, our data support a model in which Gag-dependent engagement of the proper transport and nuclear pore machinery mediate trafficking of HIV complexes to sites of integration.
Introduction
To complete the early steps of infection, retroviral preintegation complexes (PICs) must access the nucleus of the infected cell and integrate the viral cDNA into host chromatin. Gammaretroviruses such as MLV require nuclear envelope breakdown during mitosis to access cellular chromosomes and complete integration [1], [2]. In contrast, lentiviruses such as HIV can enter the nucleus in non-cycling cells, presumably by traversing the nuclear pore [3]–[5].
Passage through the pore is likely a preferred route of nuclear entry for HIV-1 even in dividing cells – several components of the nuclear pore are required for efficient infection of dividing cells, even though PICs might access the nucleus during nuclear breakdown in mitosis [6]–[11]. Moreover, in infections initiated during interphase, integration occurs before mitosis, while integration in cells infected just prior to mitosis is delayed until the following interphase [12]. These data suggest that the steps of HIV import through the nuclear pore may be coupled to subsequent integration. In support of this hypothesis, König and colleagues found that in dividing cells depleted of some nuclear pore factors or karyopherins, HIV DNA entered the nucleus but did not integrate efficiently [7]. Thus the route of nuclear entry may influence subsequent integration, and the pore may provide the preferred route even in dividing cells.
Retroviral integration is known to be modulated by several host components. Integration target site selection is guided by the genomic environment of the integration acceptor site [13]–[18]. Lentiviruses such as HIV show a preference for integration in active transcription units, which may promote efficient expression after integration [13], [19]–[21]. Gammaretroviruses such as MLV show a preference for integration near gene 5′ ends and CpG islands [13]–[15]. Target site preferences of HIV integration are due in part to tethering by a host chromatin binding protein, Ledgf/p75 (product of the PSIP1 gene), which binds lentiviral IN [22], [23] and mediates IN-chromatin binding [24], [25]. In the absence of Ledgf/p75, HIV integration is severely compromised and integration in transcription units is diminished [26]–[28]. Recently, the tethering model for Ledgf/p75 function was bolstered by the finding that fusion proteins containing the IN-binding domain of Ledgf/p75 fused to alternative chromatin binding domains retargeted lentiviral integration efficiently [29]–[31].
Here we analyze host factors identified in genome-wide siRNA screens [6]–[8] and find links between transport into the nucleus and subsequent integration targeting. We chose factors whose depletion, like that of Ledgf/p75, led to an infection block at nuclear entry or integration. We initially surveyed effects of knocking down expression of ten genes, then focused on two of them, TNPO3 and RANBP2, which encode components of the nuclear pore and import machinery. TNPO3 encodes Transportin-3, a karyopherin [32] that has been shown to be required for import of HIV PICs into the nucleus in cycling cell lines and macrophages [6], [7], [9]. RanBP2 (originally named Nup358), is a large cyclophilin-related nuclear pore protein involved in the Ran-GTPase cycle that orchestrates much of nuclear import and export [33], and is also required for import of HIV PICs [7]. Recently, Lee and colleagues isolated a capsid mutant (N74D) [34] that bypassed the requirement for Transportin-3 and RanBP2, but acquired a requirement for other nuclear pore factors. HIV capsid had previously been suggested to be a viral determinant of nuclear entry [35] and these data suggest a possible direct interaction of capsid with Transportin-3 and RanBP2.
Using RNA interference, we reduced the expression of candidate genes, confirmed that HIV titer was reduced as a result, and then investigated the distribution of integration sites in the human genome using DNA bar coding and 454/Roche pyrosequencing. As controls, we studied infections and targeting by MLV. We also studied integration targeting by a derivative of HIV containing the gag gene (encoding the capsid structural proteins) of MLV. We found that depletion of Transportin-3 and RanBP2 resulted in marked alterations in the distribution of HIV integration sites, providing a link between nuclear entry and integration targeting. MLV integration patterns were not altered in Tranportin-3 knockdowns, and substitution of MLV Gag into HIV phenocopied the effects of the knockdowns. Several additional host gene products were also identified as candidate members of the pathway. Thus we can begin to specify a "railroad track" through the nuclear pore to favored sites of HIV DNA integration.
Results
Surveying integration site distributions after siRNA knockdown
We initially analyzed 10 genes previously implicated as HIV cofactors at or near the integration step to determine whether they had effects on integration targeting (Table S1). We selected NUP98 [7], [11], MAP4 [6], [7], IK [7], ANAPC2 [7], [8], PRPF38A [7], RANBP2 [6], [7], SNW1 [7], and TNPO3 [6], [7] from siRNA screens, and two other genes, WDR46 and WDHD1, the products of which bind Ledgf/p75 in yeast two-hybrid screens (unpublished data). For each gene, we tested several different siRNAs in HEK-293T cells. Reduction of mRNA levels was confirmed by quantitative RT-PCR (Figure S1), and we assessed inhibition of infection by a VSVG-pseudotyped GFP reporter virus, as defined as percent of cells expressing the GFP marker 48 h after infection (Figure S2), as well as toxicity of the siRNAs (Figure S3). Selected knockdowns were verified by Western blot (Figure S4 and Figure 1A).
Fig. 1. Effects of siRNA treatments on HIV integration in gene dense regions. 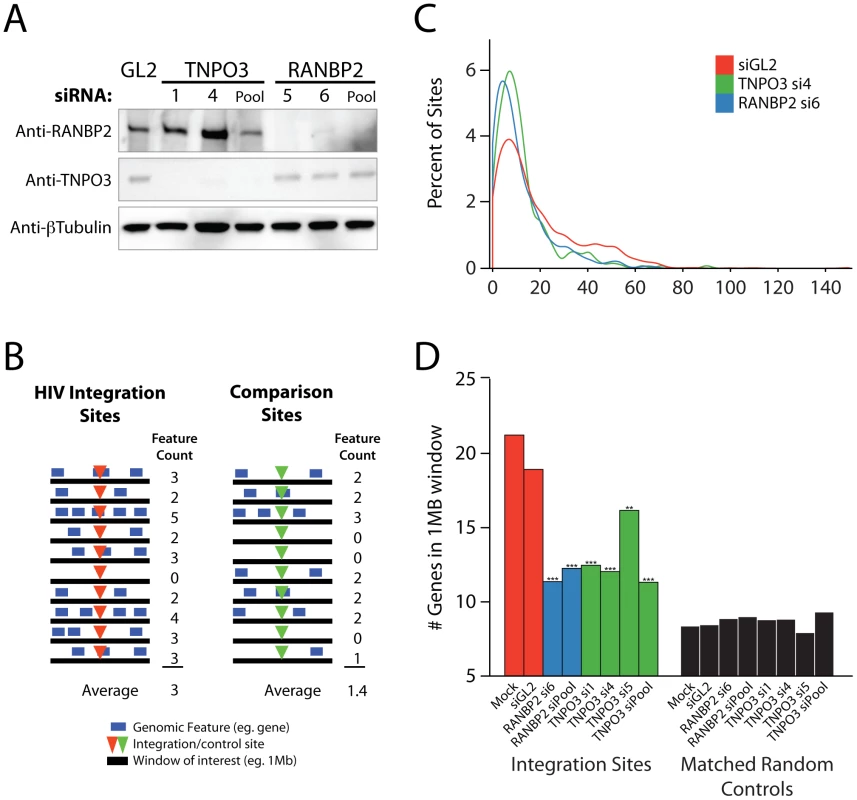
Cells were transfected with individual siRNAs or an siRNA pool of four siRNAs targeting the same gene as indicated, and infected 48 hr later for an additional period of 48 hr prior to integration site analysis. (A) Reduction in Transportin-3 and RanBP2 protein levels after RNAi. Protein abundance was measured at the time of infection by Western blot with β-tubulin as a loading control. For comparison, protein levels are shown in cells treated with an siRNA against firefly luciferase (GL2), a gene not found in HEK-293T cells. (B) Overview of the approach for integration site analysis. The number of genomic features of interest (blue bars), such as transcription units, is tabulated within genomic intervals (black bars) surrounding integration sites (red arrowheads) or computationally-generated matched random control sites (green arrowheads). The average number of times the genomic feature occurs within that window can be compared across datasets. (C) Histogram indicating distribution of integration sites with respect to gene density. Cells were transfected with individual siRNAs and infected as above. Sample names in legend indicate the gene targeted followed by the individual siRNA number. The number of genes in 1 Mb windows surrounding each integration site was counted as in 1B. Integration sites in each dataset were binned (along the X-axis) according to the number of genes within 1 MB interval surrounding each site. Curves were computed from histogram plot using Gaussian kernal density estimates. (D) Barplot of the average number of RefSeq genes in 1 Mb windows surrounding sites of HIV integration or computationally generated matched random controls. Mock transfected cells (no RNAi) and cells treated with the siRNA targeting luciferase GL2 (siGL2) are shown as controls. Asterisks denote significant difference from control GL2 siRNA treated cells as determined by the nonparametric Mann–Whitney test (*P<0.05; **P<0.01; ***P<0.001). This initial scan showed robust effects on infection efficiency for the nuclear import factors Transportin-3 and RanBP2, confirming observations from earlier studies [6], [7], [9], [34]; therefore, these genes were studied in detail as described in the following sections. Results for Transportin-3 and RanBP2 have been corroborated by further studies using stable knockdowns with shRNAs in HeLa cells that achieved efficient reductions in mRNA levels (Schaller et al., submitted). The remaining 8 genes were also analyzed for integration targeting using our high throughput pipeline. We return to findings for this group of genes at the end of the Results.
HIV integration site selection is modified by depletion of Transportin-3 and RanBP2
Having confirmed that knockdown of Transportin-3 and RanBP2 reduced the efficiency of HIV infection (Figure S2), we examined the effect of these factors on integration site selection using ligation-mediated PCR and 454-pyrosequencing as previously described [36]. Recovered genomic sequences were mapped to the human genome draft hg18. Association of integration sites with genomic features was then assessed (e. g. Figure 1B).
In the human genome, many types of features are linked–for example, gene dense regions are rich in CpG islands and DNAseI sites, high in G/C content, and rich in highly expressed genes [37], [38]. As a first step in illustrating the results, we present integration site distributions as a function of gene density. In cells depleted of Transportin-3 or RanBP2, the distribution of HIV integration sites was altered towards regions of lower gene density in comparison to control cells treated with siGL2, which targets firefly luciferase GL2, a gene not found in the HEK-293T cells (Figure 1C). The trend towards integration in less gene dense regions was significant for both RANBP2 and TNPO3 knockdowns (p<0.001, see below). There was no evidence of a bimodal distribution integration sites with respect to gene density, which would have suggested knockdown of the factors in only a portion of the cells (Figure 1C).
The average gene density in a one megabase window surrounding integration sites in cells depleted of either Transportin-3 or RanBP2 is plotted in Figure 1D. For comparison, matched random control sites within the human genome were computationally generated and are shown in black (described in [14], [18] and Text S1). The average gene density at integration sites in the RANBP2 and TNPO3 knockdown cells was reduced compared to cells treated with siGL2, though it remained higher than would be expected for random integration. Thus integration in gene dense regions is promoted in part by RanBP2 and Transportin-3. As a control for the fact the knockdowns diminished infection, we investigated whether infections at low MOI altered the distribution of integration sites, but MOI was not found to affect integration targeting detectably (data not shown).
Analysis of integration frequency relative to a large collection of genomic features (described in Text S1) showed a common set of changes in both the Transportin-3 and RanBP2 depleted cells relative to the controls (Figure 2 and Figure S5). The reduction in integration in gene dense regions was significant for both TNPO3 and RANBP2 knockdowns when analyzed over multiple genomic intervals of different lengths. Significant differences were also seen when only expressed genes (identified by Affymetrix chip transcriptional profiling) were considered in a similar analysis (labeled “Expression Intensity” in Figure 2). Genomic features that correlate with gene density such as DNase I hypersensitive sites and CpG islands were similarly enriched near control HIV integration sites but less enriched near sites from TNPO3 and RANBP2 knockdown cells. GC-rich regions, normally favored by HIV [13], were disfavored in most window sizes in the Transportin-3 and RanBP2 knockdowns.
Fig. 2. Effects of Transportin-3 and RanBP2 depletion on integration near multiple chromosomal features. 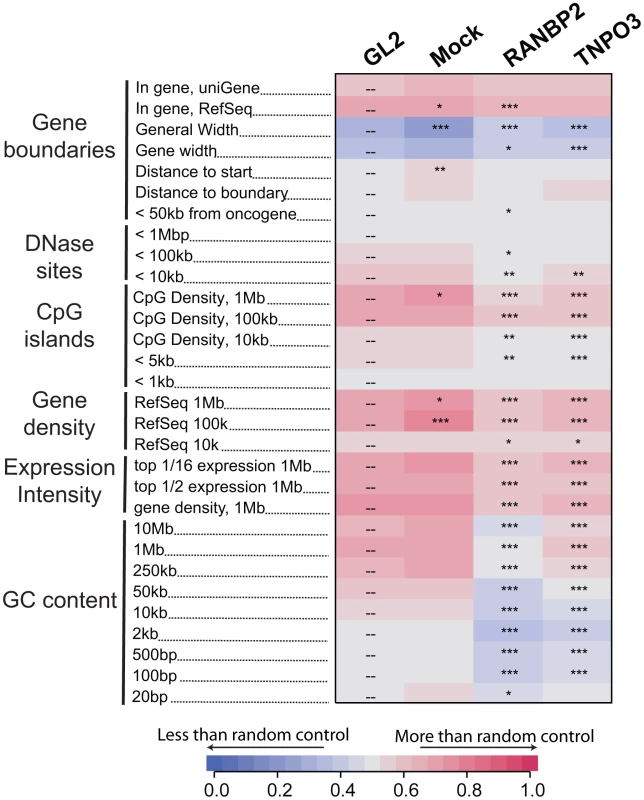
Genes targeted by siRNA in infected cells including the control, GL2, are shown above the columns. Mock cells received no siRNA. The genomic features analyzed are shown in the rows and labeled on the left. Relationships between integration frequency and feature density are summarized using ROC curve areas [18], where increasing shades of blue indicate a negative correlation with integration frequency and increasing shades of red indicate a positive correlation with integration frequency relative to matched random control distributions. The control GL2 siRNA set was used for pairwise statistical comparisons (overlay dashes). P values summarizing the significance of the departure from the GL2 control are shown with asterisks (*P<0.05; **P<0.01; ***P<0.001). Note that the asterisks and the heat map summarize different comparisons (to siGL2 and matched random controls, respectively). The base pair values in the row labels indicate the size of the genomic interval used for analysis–often the most appropriate interval is not known, so several different interval sizes are compared. A more detailed guide to the data presented in this figure can be found in Text S1. An interactive version of this figure is available as Figure S5. By contrast, gene density at integration sites was not significantly affected in Ledgf/p75 knockdowns compared to the control. The GC content and the density of CpG islands within one kb of integration sites actually increased in Ledgf/p75-depleted cells [26]–[28], indicating divergent effects on integration targeting. Integration within genes, which is reproducibly diminished in Ledgf/p75-depleted cells [26]–[28], was not affected by TNPO3 knockdown, and showed only a slight decrease in the RANBP2 knockdown cells. Together these data suggest that Transportin-3 and RanBP2 influence HIV integration targeting relative to a collection of features associated with gene dense regions, and do so in a manner that differs from Ledgf/p75 tethering.
Effect of Transportin-3 depletion on integration site selection can be partially rescued by expression from an siRNA insensitive TNPO3 allele
Multiple different siRNAs directed against TNPO3 and RANBP2 mRNAs yielded similar effects on integration targeting that were not observed in control knockdowns, indicating that off-target effects were unlikely to explain the observed alterations in integration targeting. As an additional control, we analyzed complementation of the Transportin-3 depletion using a plasmid-encoded siRNA-insensitive allele generated by site-directed mutagenesis of the siRNA target sequence. The RANBP2 coding region is very large (11,711 bp), and so rescue experiments were not attempted for this factor. Co-transfection of the resistant Transportin-3 expression vector with the corresponding siRNA resulted in overexpression of Transportin-3 and restored HIV infection, increasing reporter virus GFP expression above control levels (Figure 3a and b).
Fig. 3. Transfection of a Transportin-3 allele insensitive to TNPO3 si4 restores protein expression, HIV infectivity, and partially restores wild-type HIV integration site distributions. 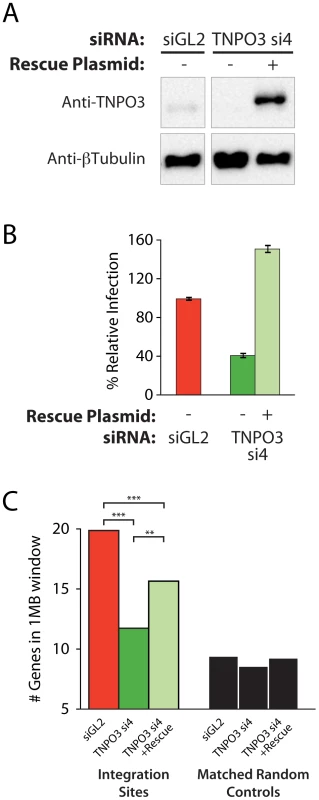
(A) Western blot showing Transportin-3 levels in cells treated with TNPO3 si4 in the presence or absence of the Transportin-3 rescue plasmid. Cells were cotransfected with siRNA and either empty vector plasmid or rescue plasmid encoding siRNA-resistant alleles of Transportin-3 expressed from the CMV promoter and harvested at 48 hr post-transfection for analysis. Transportin-3 is reduced after co-transfection with siRNA and empty vector, and overexpressed after co-transfection with siRNA and rescue plasmid. Endogenous levels of Transportin-3 are shown in cells transfected with the control siRNA targeting GL2 and an empty vector. (B) HIV infection in cells treated with TNPO3 si4 in the presence or absence of the Transportin-3 rescue plasmid. Cells were co-transfected as above. 48 hr after transfection cells were infected with a VSVG-pseudotyped HIV-1 vector carrying a GFP reporter. At 48 hpi cells were harvested and the percent of cells expressing GFP was determined by flow cytometry. The Y-axis shows relative infection compared to infection in the control (GL2 siRNA + empty vector-transfected) cells. (C) Average gene density in 1 Mb windows surrounding HIV integration sites in cells depleted or rescued for Transportin-3 expression. Asterisks denote significant differences as determined by the Mann–Whitney test (*P<0.05; **P<0.01; ***P<0.001). We observed an increase in gene density near integration sites in knockdown cells co-transfected with the siRNA-insensitive TNPO3 allele compared to vector-only controls (Figure 3c and Figure S6). The average number of genes within 1 Mb of HIV integration sites increased from 11 (in the presence of TNPO3 si4 and an empty vector) to 14 when Transportin-3 expression was rescued (p<0.01, Figure 3c). The effect of knockdown in the presence and absence of rescue on additional genomic features is described in Text S2. It is unclear why restoring Transportin-3 protein levels did not fully rescue the integration defect, but this result may be due to the abnormally high levels of Transportin-3 expressed from the siRNA-resistant construct. Nevertheless, these data support the idea that off-target effects of the TNPO3 siRNA do not account for the phenotypes observed.
Transportin-3 depletion has no detectable effect on gene density surrounding MLV integration sites
As a control, we tested whether MLV integration, which requires cell division for infection and is not dependent on Transportin-3 [7], [39], showed altered integration targeting in the Transportin-3-depleted cells. We found that treatment with siRNA targeting TNPO3 mRNA, either in the presence or absence of the rescue plasmid, did not affect MLV infection efficiency (Figure 4a). We sequenced MLV integration sites from knockdown and control cells (Table S1), and found no significant changes in MLV integration frequency in gene dense regions (Figure 4b), within transcription units, or with respect to GC content (data not shown). These data indicate that Transportin-3 depletion does not affect MLV integration targeting as it does for HIV.
Fig. 4. Depletion of Transportin-3 does not alter MLV integration targeting. 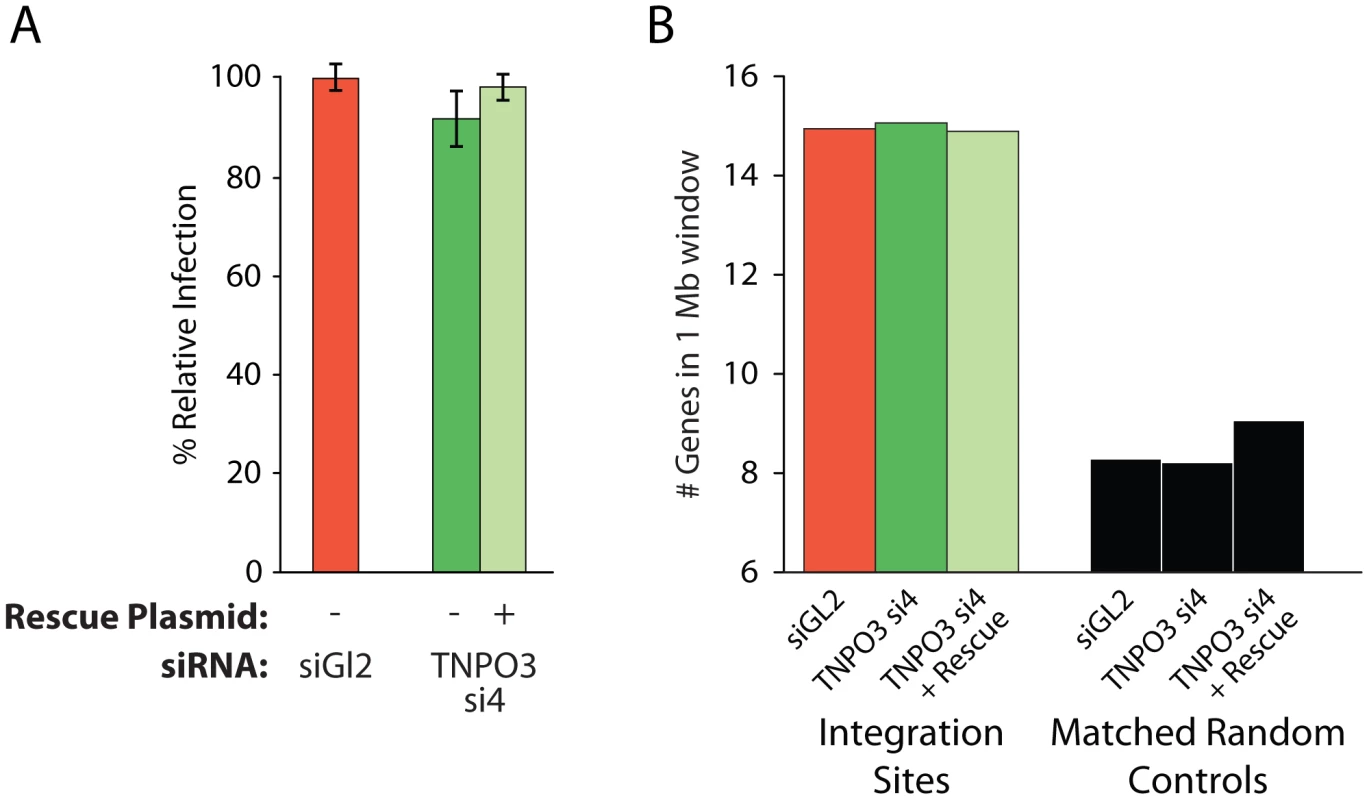
(A) Infection levels of MLV in cells co-transfected with the control siRNA to GL2 plus an empty vector, TNPO3-si4 plus an empty vector, or TNPO3 si4 plus a vector encoding the siRNA-resistant Transportin-3 allele. (B) Average gene density in 1 Mb windows surrounding MLV integration sites in cells depleted or rescued for Transportin-3 expression. No sets showed significant differences from GL2-treated cells as determined by the Mann–Whitney test. Other nuclear factors may participate in directing integration to gene dense regions
Integration site data sets were also acquired for cells treated with siRNAs for NUP98, MAP4, IK, ANAPC2, PRPF38A, SNW1, WDR46 and WDHD1 (Table S1). For many of these, considerable toxicity was detected (Figure S3). Thus interpretation of integration targeting results for these factors is more tentative than for Transportin-3 and RanBP2. Data sets were analyzed for their association with gene density as for Transportin-3 and RanBP2 (Figure 5). Knockdown of several of the factors (ANAPC2, SNW1, PRPF38, WDH1, and IK) led to decreased integration in gene dense regions. MAP4 depletion was also seen to modestly decrease integration preference for gene dense regions in some experiments. For two of these genes, SNW1 and ANAPC2, we confirmed that although MLV infection is diminished in the knockdowns as previously noted [7], the gene density at MLV integration sites is unchanged (Figure S7), suggesting that, like Transportin-3, the factors encoded by these genes are potentially involved in targeting pathways specific for HIV. By contrast, gene density at integration sites in cells stably depleted of Ledgf was not significantly decreased compared to the siGL2 control.
Fig. 5. Depletion of additional host factors and their effects on HIV integration in gene dense regions. 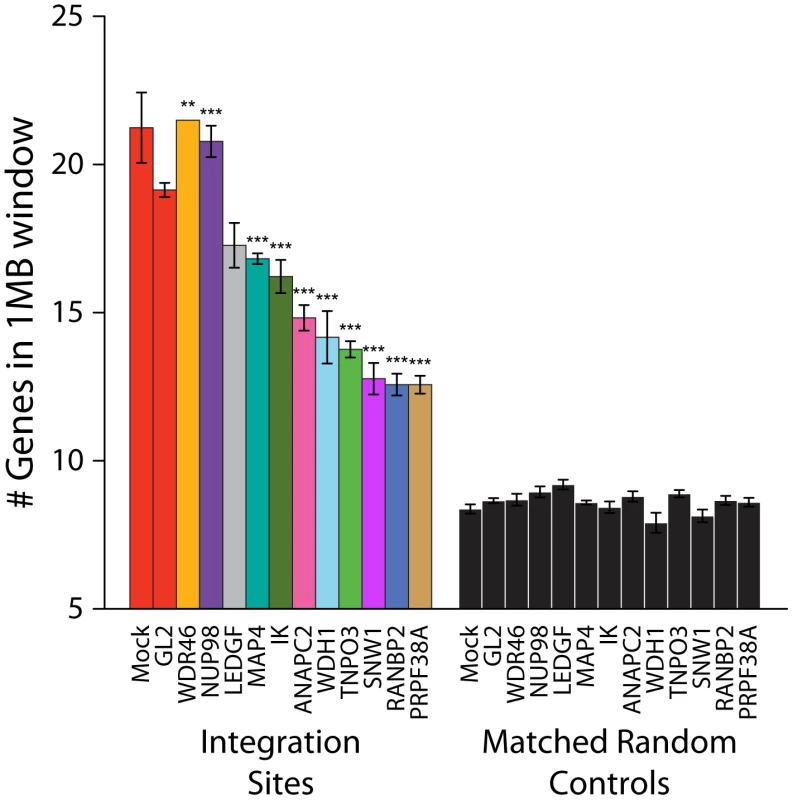
Integration sites were isolated from cells treated with siRNAs targeting the indicated genes. The average numbers of RefSeq genes in 1 Mb windows surrounding integration sites are shown. Data for a given gene knockdown is the average over multiple siRNA knockdowns using different siRNAs and pools of siRNAs targeted to the same gene, except for Mock, control siRNA (GL2), and LEDGF knockdown conditions for which single treatments were used. Asterisks denote significant difference from control GL2 siRNA-treated cells as determined by the Mann–Whitney test (*P<0.05; **P<0.01; ***P<0.001). Error bars represent standard error for biological replicates. For LEDGF only one dataset was available. For those knockdowns where we could sequence at least 200 integration sites, the global integration site patterns were investigated by assessing integration frequency relative to many genomic features for each knockdown, and the patterns were clustered using a conditional logit model to conduct pairwise comparisons of the datasets (details are in Text S3). The dendrogram in Figure 6 shows that the controls clustered in a group separate from Transportin-3 and RanBP2 knockdowns. Data sets for several additional gene knockdowns clustered in the TNPO3/RANBP2 group, including IK, ANAPC2, SNW1, WDHD1 and PRPF38A. For MAP4 and WDR46 different siRNAs fell in different groups, and so these have an indeterminate effect. Thus the IK, ANAPC2, SNW1, WDHD1 and PRPF38A genes encode candidates for additional factors acting in the same pathway with Transportin-3 and RanBP2. The Ledgf/p75 knockdown was an outlier in the control cluster. This is consistent with Ledgf/p75 knockdown leading to effects not seen in depletion of RanBP2, or Transportin-3. For this analysis we investigated both low MOI (30–60% infected wild type cells) and high MOI (90–100% infected cells) infections. In most cases the MOI made no difference on the overall position of a knockdown within the tree, suggesting that the roles of the factors are not saturable under the conditions tested.
Fig. 6. Dendrogram showing clustering of integration site data sets from knockdowns of Transportin-3, RanBP2, and several additional factors. 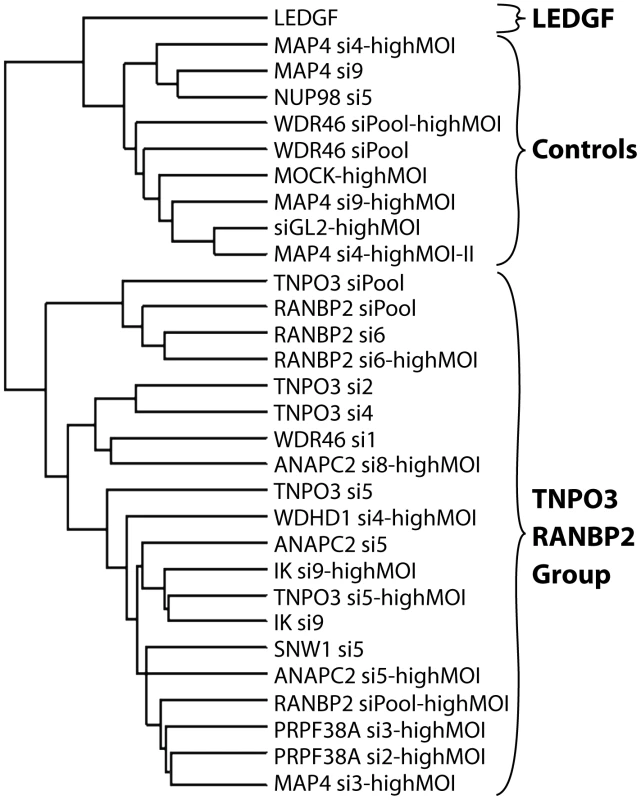
Only sets containing at least 200 integration sites were used for the analysis. A conditional logit model was used to cluster integration sites data sets based on annotation of in or out of annotated transcription units, gene density, expression density, CpG islands, G/C content, nearby oncogenes, and local sequence features (Text S3). Sets were clustered based on their overall similarity in a pairwise analysis. The "Control" cluster is so named because it contains the Mock and siGL2 control data sets. Branch labels indicate the siRNA used for the analysis, and indicates the name of the targeted gene (e.g. TNPO3 si4). Infections were performed using enough HIV vector stock to infect 30–60% of untreated cells except where marked as “highMOI” where 90–100% of untreated cells were infected. HIV gag is a determinant of integration targeting to gene dense regions
We previously studied integration targeting in HeLa cells using HIV chimeras containing MLV gag, MLV IN, or both, in place of their HIV counterparts [40]. We found that MLV IN was a dominant determinant of MLV-like integration, resulting in integration near transcription start sites by HIV derivatives containing MLV IN. Similar chimeric viruses have been used to show that HIV capsid is a dominant viral determinant of HIV nuclear entry in non-dividing cells [41]. Recently, Lee and colleagues [34] suggested that the HIV CA protein might determine the interactions between HIV PICs and nuclear pore components. These findings led us to reinvestigate integration targeting by the HIV chimera containing MLV gag in place of HIV gag (HIVmGag; Fig. 7A) [40]. We found that HIVmGag showed a shift in distribution of integration sites towards less gene dense regions compared to the unmodified control (Figure 7B). The average number of genes within 1 MB of HIVmGag integration sites was 11 as compared to 20 for the unmodified HIV control (A Chi square test over ranked comparisons of gene density values between the two sets attains a p value of <2.22–16). A comparison over many genomic features (Figure 7C and Figure S8) showed a pattern of HIVmGag integration similar to that seen for HIV in Transportin-3 and RanBP2 depleted cells (compare Figure 2), including reduced density of genes, CpG islands, DNase I hypersensitive sites and reduced GC content surrounding integration sites. Thus substitution of HIV gag with MLV gag phenocopied the TNPO3 and RANBP2 knockdowns.
Fig. 7. A chimeric derivative of HIV containing MLV gag (HIVmGag) shows reduced integration frequency in gene dense regions. 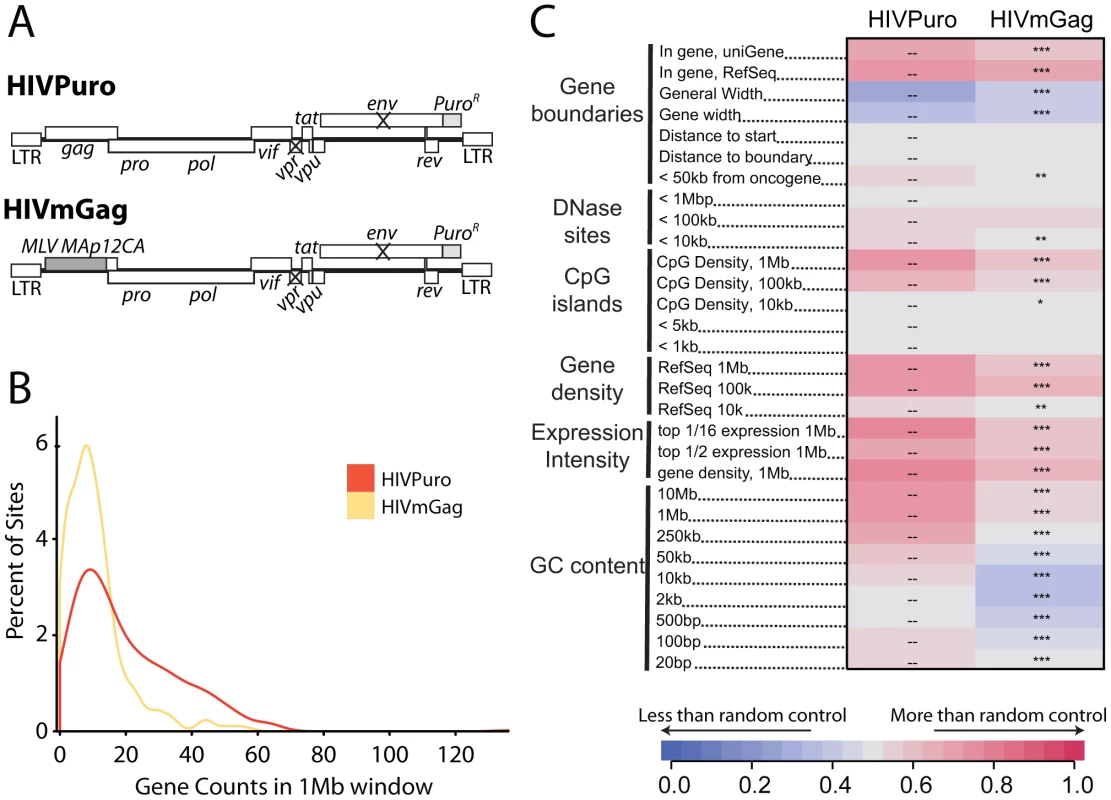
(A) Genetic map of HIV proviruses containing wild type gag (HIVPuro) or a chimera encoding MLV Gag (MA, p12, and CA) in place of HIV MA and CA (HIVmGag). Both viruses have inactivated vpr and env and a puromycin selectable marker in place of nef. (B) Histogram indicating distribution of HIVPuro and HIVmGag integration sites with respect to gene density measured in 1 Mb intervals surrounding integration events. Data is plotted as in Fig. 1C and curves are computed using Gaussian kernel density estimates. (C) Genomic heatmap of HIVPuro and HIVmGag datasets. Significant differences are shown by asterisks (*p<0.05; **p<0.01; ***p<0.001). Annotations at the left of the heat map are as in Figure 2 and described in Text S1. An interactive version of this figure is available as Figure S8. Knockdowns of RANBP2 or TNPO3 do not cause HIV to favor integration near transcription start sites
A model to explain the altered integration site patterns of HIV in TNPO3 or RANBP2 knockdowns is that in the absence of these pore proteins the HIV PIC accesses chromatin during nuclear breakdown during mitosis. MLV employs such a mechanism for nuclear entry, so we wondered whether the HIV integration site distributions in the knockdowns might resemble the normal pattern for MLV. We asked whether HIV integration in cells knocked down for TNPO3 and RANBP2 shows the most characteristic feature of MLV integration, favored integration near transcription start sites (Figure 8). We found that HIV in the knockdowns disfavors transcription start sites, paralleling HIV integration in unmodified cells. MLV showed strongly favored integration in transcription start sites in the 293T cells studied, and in 293T cells knocked down for TNPO3. We conclude that obstructing the normal HIV pathway of integration by knocking down RANBP2 or TNPO3 does not result in an MLV-like integration targeting pattern. This is consistent with the observation that IN is the dominant determinant of MLV like integration patterns at transcription start sites for chimeric viruses where HIV IN is replaced with MLV IN [40], [41].
Fig. 8. HIV and MLV integration patterns at transcription start sites are unaffected by knockdown of TNPO3 or RANBP2. 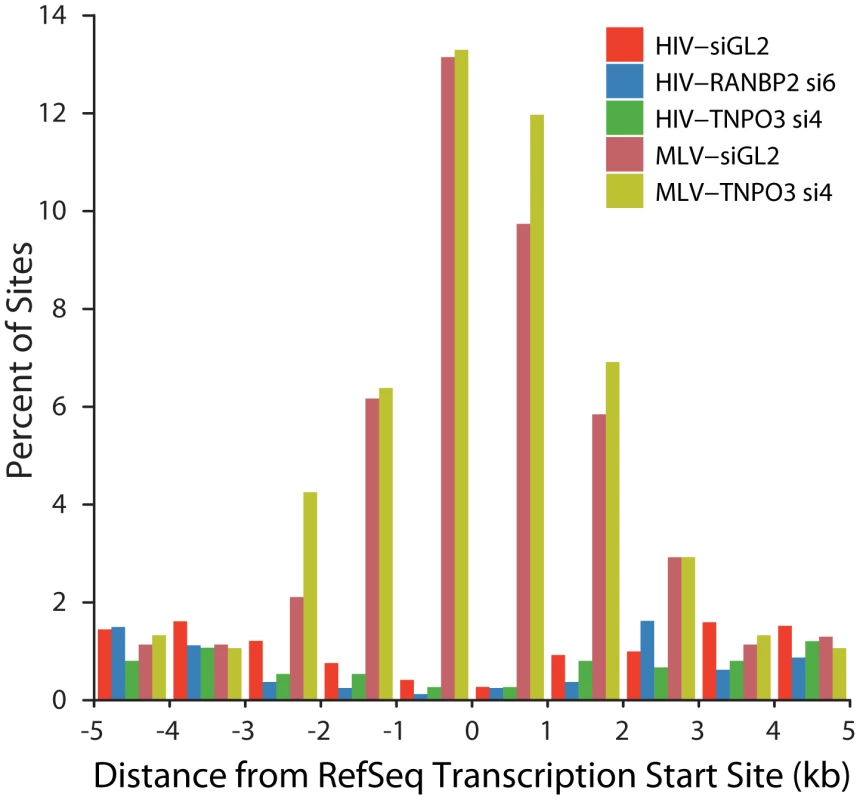
The percent of integration sites within the indicated genomic distances (kb) from the transcription start site (RefSeq genes) is plotted for each dataset. Sample names indicate the VSVG-pseudotyped viral vector used (HIV or MLV) followed by the cell treatment (either control siGL2 or gene-specific siRNA used). Discussion
Here we report that depletion of Transportin-3 and RanBP2 by RNAi affects the downstream choice of targets for HIV DNA integration, providing evidence for coupling of the nuclear translocation and integration steps. As others have noted, Transportin-3 has little or no effect on infection efficiency of MLV [6], [7], [9], which is not thought to traverse the nuclear pore, and we report that Transportin-3 did not affect integration targeting by MLV. Replacing HIV gag with MLV gag phenocopied the effects of the Transportin-3 and RanBP2 knockdowns on HIV integration targeting. These findings support a model in which HIV Gag proteins interact with Transportin-3 and RanBP2 to mediate HIV integration targeting to chromosomal regions rich in genes and associated features.
We found that depletion of several additional factors previously shown to be required for efficient integration also resulted in HIV integration targeting patterns similar to those seen in Transportin-3 and RanBP2 depleted cells. These factors include a component of the anaphase promoting complex (ANAPC2) splicing factors (SNW1 and PRPF38), a WD-repeat protein (WDHD1), and nuclear DNA binding proteins (IK and SNW1). The analysis of some of these was complicated by cell toxicity, and in some cases conflicting results were obtained with different siRNAs, so effects of these factors are less well supported than those of Transportin-3 and RanBP2. It is possible that each of these factors acts in a common pathway with Transportin-3 and RanBP2 to direct integration to regions dense in genes and associated features, though depletion of some of these factors could also alter the synthesis or function of other factors acting more directly.
Our studies support the hypothesis that nuclear import of HIV is linked to integration, and suggest that normal interactions with the nuclear pore help to determine integration target site distributions (Figure 9). We favor a two-step model, in which passage through the pore first places the PIC in regions of high gene density, and then Ledgf/p75 tethers the PIC for integration to provide the final distribution in active transcription units. Several studies suggest that chromosomes and genes are nonrandomly distributed in the nucleus, though the organization is not fully clarified [42]–[44]. Although the nuclear periphery is thought to be rich in heterochromatic chromosomal regions that promote gene silencing, studies in yeast and Drosophila suggested that genes can relocate to the nuclear pore upon transcriptional induction [45]–[50]. Thus passage through the pore may deliver HIV to locally concentrated active gene-dense chromatin. Alternatively, interaction with Transportin-3 and RanBP2 at the pore might engage a nuclear transport system leading to gene-dense chromatin.
Fig. 9. Model for coupling of nuclear import and integration targeting. 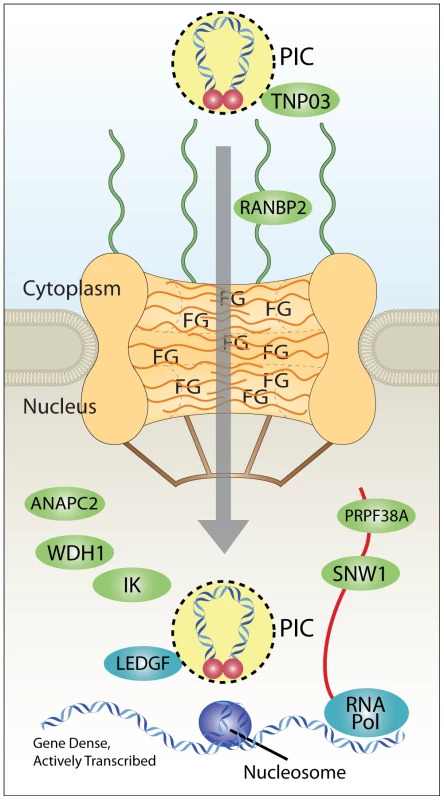
Interaction with Transportin-3 and RanBP2 shuttles the PIC through the nuclear pore and toward gene dense regions favored for HIV integration. Interactions with additional factors in the nucleus (ANAPC2, WDH1, IK, PRPF38A, and SNW1) may also play a role in site selection upstream of the known integration cofactor Ledgf/p75, which targets integration to active transcription units. RNA Pol indicates RNA polymerase II, which is known to be required for transcriptional activity, and which promotes integration [13]–[15], [18]. Nucleosomes are shown because target DNA is known to be wrapped in nucleosomes during the integration step [36], [57]–[60]. PIC, preintegration complex; FG, phenylalanine-glycine repeat sequences of nuclear pore proteins. Our data is consistent with the idea that correct engagement of the Transportin-3/RanBP2-dependent targeting pathway leads to efficient integration in chromosomal regions rich in genes and associated features. Failure to engage this pathway results in targeting to less gene dense regions. Two possible scenarios can be imagined for nuclear entry and integration targeting in cells depleted for pore factors Transporting-3 and RanBP2.
The first model is that in the absence of Transportin-3 or RanBP2, nuclear access of HIV is restricted to times of nuclear envelope breakdown during cell division. The shift in integration away from gene-dense regions in the TNPO3 and RANBP2 knockdowns may thus reflect changes in chromatin availability during mitosis or shortly afterwards. Consistent with this idea, the HIVmGag virus requires nuclear envelope breakdown during mitosis for infection [41], and it phenocopied HIV integration in the knockdown cells, showing reduced integration frequency in gene dense regions.
An extreme version of this model would hold that HIV integration targeting in TNPO3 and RANBP2 knockdowns might mimic MLV targeting because in both cases the virus accesses chromatin during nuclear breakdown. However, MLV strongly favors integration near transcription start sites, and this is not seen for HIV in knockdown cells (Figure 8).
Similarly, if passage through the nuclear pore delivers the HIV PIC to transcription units and gene dense regions, growth arrest of cells might increase favoring of these features, since all integrants must enter through the pore in arrested cells. Integration site distributions have been investigated in growth arrested IMR90 lung fibroblasts and macrophages [28], [51]. In IMR90 cells, arrest did result in more integration in transcription units and gene dense regions, but in macrophages the favoring is in fact weaker than that observed in many other cell types [27]. Thus it is possible that passage through the nuclear pore results in favored integration in gene dense regions, but additional assumptions are needed to explain the data from macrophages.
The second model (not exclusive of the first) holds that in cells depleted of TNPO3 and RanBP2, HIV integration complexes may pass through the pore but on a different pathway, interacting with different pore proteins. The idea that alternative pathways through the pore exist is supported by findings of Lee and colleagues, who found that the N74D substitution in HIV CA disrupted normal interactions with Transportin-3 and RanBP2 but created dependence on other pore proteins [34]. From our data, it is not possible to determine whether in cells depleted of Transportin-3 and RanBP2 HIV integration complexes pass through the pore on alternate pathways, or whether nuclear access during mitosis fully explains the data. Thus it will be important to analyze targeting when integration complexes pass through the pore on alternative pathways, as in the presence of the N74D CA substitution (Schaller et al., submitted).
Materials and Methods
Cell culture and viral infections
HEK 293T cells were grown in D10 media (DMEM supplemented with 10% FBS and 50 ug/µL Gentamicin). For gene knockdowns, cells were grown to confluency, trypsinized and reverse transfected (100,000 cells/well in 12 well plates, 50,000/well in 24 well plates, and 8,000/well in 96 well plates) using RNAiMax (Invitrogen, Carlsbad CA) with 25 pmol/mL siRNA. The siRNAs were purchased from Qiagen (Qiagen, Valencia, CA) and are listed in Table S2. Toxicity of siRNAs was measured 48 hr after transfection both visually and by the CellTiter-Glo Luminescent Cell Viability Assay (Promega, Madison WI; see Figure S3 for details). Transfection media was replaced after 48 hr by 500 µL of D10 plus 5 ug DEAE dextran and virus in 12 well plates. Two viral inoculums were used (0.06 µL or 1 µL concentrated virus stock corresponding to 1.32 ng or 22 ng p24 per well, values determined by titration to result in infection of 30–60% or 80–100% of cells, respectively). Virus-containing media was replaced after 10–12 hours with 1 mL D10 and incubated an additional 38 hours before harvest. Infections of LEDGF stable knockdown cell lines were performed essentially as described [28].
VSV-G pseudotyped HIV vector particles were produced in HEK 293T cells by Lipofectamine (Invitrogen, Carlsbad CA) transfection of p156RRLsin-PPTCMVGFPWPRE [52], the packaging construct pCMVdeltaR9 [53], and the vesicular stomatitis virus G-producing plasmid pMD.G. VSV-G pseudotyped MLV particles were produced in a similar manner but using the MLV vector segment (pMX-eGFP) and packaging construct pCGP (pCGP, kindly provided by Paul Bates).
Percent infection was measured using GFP fluorescence, which is not strongly affected by integration site placement in the HIV-based vectors with strong artificial promoters used here [30].
HIV infection and targeting rescue experiments were performed as described for siRNA knockdowns but with the co-transfection of siRNA-resistant or empty expression vectors (333 ng plasmid/mL). The siRNA-resistant TNPO3 allele was constructed by introducing six conservative mutations in the third position of each codon and an N-terminal 3xFLAG-tag into the TNPO3 cDNA amplified HEK-293T cells. This product was then cloned into the mammalian expression vector pLNCX (kind gift of Paul Bates), engineered to contain a WPRE.
Gene expression by RNA and protein levels
Q-PCR (see Figure S1 for details) and immunoblotting were used to monitor the extent of siRNA knockdowns. Protein levels were measured by immunoblotting using antibodies against Transportin-3 (ab54353, Abcam Inc., Cambridge, MA) and RanBP2 (ab2938, Abcam Inc., Cambridge, MA). HRP conjugated secondary antibodies (p0260, DAKO A/S, Denmark, and ab6721-1, Abcam, Cambridge, MA) were used for detection with SuperSignal West Pico Chemiluminescent Substrate (Thermo Scientific, Pierce Protein Research Products, Rockford, IL). Beta-tubulin was used as a loading control, detected by the HRP conjugated antibody (ab21058, Abcam, Cambridge, MA).
Integration site analysis
For integration site recovery, purified genomic DNA was digested overnight with MseI, ligated at 16°C to PCR adapters, and digested a second time with SacI. Nested PCR was then performed using primers and conditions described previously [36], [54]. Amplification products between 200–600 bp were then gel-excised, purified, and sequenced on a Genome Sequencer FLX Titanium Series (Roche 454 Sequencing) at either the University of Pennsylvania or the University of Florida. Only sequences that began within three base pairs of the LTR end and showed unique best alignments to the human genome by BLAT (hg18, version 36.1, >98% match score) were considered true integration sites. Identical integration sites identified in two or more separately amplified samples were considered to be PCR contamination and were omitted.
Comparisons to genomic features were carried out as described previously [18], [55] using a combination of conditional logit regression and Bayesian model averaging. Details of statistical methods are available in [14], [18], [55], [56]. Methods used for statistical analysis of ROC areas (Figures 3 and 8) are summarized in [56]. Gene expression analyses utilized data from 293T cells [28] with expression measured using the Affymetrix HU133 plus 2.0 gene chip array. All integration site sequences will be deposited in publicly accessible databases (NCBI) upon acceptance of this manuscript for publication.
Entrez Gene ID numbers for genes mentioned in the text
NUP98 : 4928, MAP4 : 4134, IK: 3550, ANAPC2 : 29882, PRPF38A: 84950, RANBP2/NUP358 : 5903, SNW1 : 22938, TNPO3 : 23534, WDR46 : 9277, WDHD1 : 11169, PSIP1/LEDGF/p75 : 493969.
Supporting Information
Zdroje
1. RoeT
ReynoldsTC
YuG
BrownPO
1993 Integration of murine leukemia virus DNA depends on mitosis. EMBO J 12 2099 2108
2. LewisPF
EmermanM
1994 Passage through mitosis is required for oncoretroviruses but not for the human immunodeficiency virus. J Virol 68 510 516
3. BukrinskyMI
SharovaN
DempseyMP
StanwickTL
BukrinskayaAG
1992 Active nuclear import of human immunodeficiency virus type 1 preintegration complexes. Proc Natl Acad Sci U S A 89 6580 6584
4. von SchwedlerU
KornbluthRS
TronoD
1994 The nuclear localization signal of the matrix protein of human immunodeficiency virus type 1 allows the establishment of infection in macrophages and quiescent T lymphocytes. Proc Natl Acad Sci U S A 91 6992 6996
5. HeinzingerNK
BukrinskyMI
HaggertySA
RaglandAM
Kewalramani VK
1994 The vpr protein of human immunodeficiency virus type 1 influences nuclear localization of viral nucleic acids in nondividing host cells. Proc Natl Acad Sci U S A 91 7311 7315
6. BrassAL
DykxhoornDM
BenitaY
YanN
EngelmanA
2008 Identification of host proteins required for HIV infection through a functional genomic screen. Science 319 921 926
7. KonigR
ZhouY
EllederD
DiamondTL
BonamyGM
2008 Global analysis of host-pathogen interactions that regulate early-stage HIV-1 replication. Cell 135 49 60
8. ZhouH
XuM
HuangQ
GatesAT
ZhangXD
2008 Genome-scale RNAi screen for host factors required for HIV replication. Cell Host Microbe 4 495 504
9. ChristF
ThysW
De RijckJ
GijsbersR
AlbaneseA
2008 Transportin-SR2 imports HIV into the nucleus. Curr Biol 18 1192 1202
10. SuzukiY
CraigieR
2007 The road to chromatin - nuclear entry of retroviruses. Nat Rev Microbiol 5 187 196
11. EbinaH
AokiJ
HattaS
YoshidaT
KoyanagiY
2004 Role of Nup98 in nuclear entry of human immunodeficiency virus type 1 cDNA. Microbes Infect 6 715 724
12. KatzRA
GregerJG
BoimelP
SkalkaAM
2003 Human immunodeficiency virus type 1 DNA nuclear import and integration are mitosis independent in cycling cells. J Virol 77 13412 13417
13. SchroderAR
ShinnP
ChenH
BerryC
EckerJR
2002 HIV-1 integration in the human genome favors active genes and local hotspots. Cell 110 521 529
14. MitchellRS
BeitzelBF
SchroderAR
ShinnP
ChenH
2004 Retroviral DNA integration: ASLV, HIV, and MLV show distinct target site preferences. PLoS Biol 2 E234
15. WuX
LiY
CriseB
BurgessSM
2003 Transcription start regions in the human genome are favored targets for MLV integration. Science 300 1749 1751
16. CarteauS
HoffmannC
BushmanFD
1998 Chromosome structure and HIV-1 cDNA integration: Centromeric alphoid repeats are a disfavored target. J. Virol 72 4005 4014
17. HolmanAG
CoffinJM
2005 Symmetrical base preferences surrounding HIV-1, avian sarcoma/leukosis virus, and murine leukemia virus integration sites. Proc Natl Acad Sci U S A 102 6103 6107
18. BerryC
HannenhalliS
LeipzigJ
BushmanFD
2006 Selection of target sites for mobile DNA integration in the human genome. PLoS Comput Biol 2 e157
19. VerdinE
1991 DNase I-hypersensitive sites are associated with both long terminal repeats and with the intragenic enhancer of integrated human immunodeficiency virus type 1. J Virol 65 6790 6799
20. LewinskiM
BisgroveD
ShinnP
ChenH
VerdinE
2005 Genome-wide analysis of chromosomal features repressing HIV transcription. J Virol 79 6610 6619
21. WeinbergerLS
BurnettJC
ToettcherJE
ArkinAP
SchafferDV
2005 Stochastic gene expression in a lentiviral positive-feedback loop: HIV-1 tat fluctuations drive phenotypic diversity. Cell 122 169 182
22. CherepanovP
MaertensG
ProostP
DevreeseB
Van BeeumenJ
2003 HIV-1 integrase forms stable tetramers and associates with LEDGF/p75 protein in human cells. J Biol Chem 278 372 381
23. EmilianiS
MousnierA
BusschotsK
MarounM
Van MaeleB
2005 Integrase mutants defective for interaction with LEDGF/p75 are impaired in chromosome tethering and HIV-1 replication. J Biol Chem 280 25517 25523
24. MaertensG
CherepanovP
PluymersW
BusschotsK
De ClercqE
2003 LEDGF/p75 is essential for nuclear and chromosomal targeting of HIV-1 integrase in human cells. J Biol Chem 278 33528 33539
25. LlanoM
VanegasM
FregosoO
SaenzD
ChungS
2004 LEDGF/p75 determines cellular trafficking of diverse lentiviral but not murine oncoretroviral integrase proteins and is a component of functional lentiviral preintegration complexes. J Virol 78 9524 9537
26. ShunMC
RaghavendraNK
VandegraaffN
DaigleJE
HughesS
2007 LEDGF/p75 functions downstream from preintegration complex formation to effect gene-specific HIV-1 integration. Genes Dev 21 1767 1778
27. MarshallH
RonenK
BerryC
LlanoM
SutherlandH
2007 Role of PSIP1/LEDGF/p75 in lentiviral infectivity and integration targeting. PLoS One 2 e1340
28. CiuffiA
LlanoM
PoeschlaE
HoffmannC
LeipzigJ
2005 A role for LEDGF/p75 in targeting HIV DNA integration. Nat Med 11 1287 1289
29. SilversRM
SmithJA
SchowalterM
LitwinS
LiangZ
2010 Modification of integration site preferences of an HIV-1-based vector by expression of a novel synthetic protein. Hum Gene Ther 21 337 349
30. GijsbersR
RonenK
VetsS
MalaniN
De RijckJ
2010 LEDGF hybrids efficiently retarget lentiviral integration into heterochromatin. Mol Ther 18 552 560
31. FerrisAL
WuX
HughesCM
StewartC
SmithSJ
2010 Lens epithelium-derived growth factor fusion proteins redirect HIV-1 DNA integration. Proc Natl Acad Sci U S A 107 3135 3140
32. LaiMC
LinRI
HuangSY
TsaiCW
TarnWY
2000 A human importin-beta family protein, transportin-SR2, interacts with the phosphorylated RS domain of SR proteins. J Biol Chem 275 7950 7957
33. WuJ
MatunisMJ
KraemerD
BlobelG
CoutavasE
1995 Nup358, a cytoplasmically exposed nucleoporin with peptide repeats, ran-GTP binding sites, zinc fingers, a cyclophilin A homologous domain, and a leucine-rich region. J Biol Chem 270 14209 14213
34. LeeK
AmbroseZ
MartinTD
OztopI
MulkyA
2010 Flexible use of nuclear import pathways by HIV-1. Cell Host Microbe 7 221 233
35. YamashitaM
PerezO
HopeTJ
EmermanM
2007 Evidence for direct involvement of the capsid protein in HIV infection of nondividing cells. PLoS Pathog 3 1502 1510
36. WangGP
CiuffiA
LeipzigJ
BerryCC
BushmanFD
2007 HIV integration site selection: Analysis by massively parallel pyrosequencing reveals association with epigenetic modifications. Genome Res 17 1186 1194
37. LanderE
2001 Initial sequencing and analysis of the human genome. Nature 409 860 921
38. VenterJC
2001 The sequence of the human genome. Science 291 1304 1351
39. KrishnanL
MatreyekKA
OztopI
LeeK
TipperCH
2010 The requirement for cellular transportin 3 (TNPO3 or TRN-SR2) during infection maps to human immunodeficiency virus type 1 capsid and not integrase. J Virol 84 397 406
40. LewinskiMK
YamashitaM
EmermanM
CiuffiA
MarshallH
2006 Retroviral DNA integration: Viral and cellular determinants of target-site selection. PLoS Pathog 2 e60
41. YamashitaM
EmermanM
2004 Capsid is a dominant determinant of retrovirus infectivity in nondividing cells. J Virol 78 5670 5678
42. XingY
JohnsonCV
MoenPT
Jr
McNeilJA
LawrenceJ
1995 Nonrandom gene organization: Structural arrangements of specific pre-mRNA transcription and splicing with SC-35 domains. J Cell Biol 131 1635 1647
43. SimonisM
KlousP
SplinterE
MoshkinY
WillemsenR
2006 Nuclear organization of active and inactive chromatin domains uncovered by chromosome conformation capture-on-chip (4C). Nat Genet 38 1348 1354
44. OsborneCS
ChakalovaL
BrownKE
CarterD
HortonA
2004 Active genes dynamically colocalize to shared sites of ongoing transcription. Nat Genet 36 1065 1071
45. CasolariJM
BrownCR
KomiliS
WestJ
HieronymusH
2004 Genome-wide localization of the nuclear transport machinery couples transcriptional status and nuclear organization. Cell 117 427 439
46. BricknerJH
WalterP
2004 Gene recruitment of the activated INO1 locus to the nuclear membrane. PLoS Biol 2 e342
47. CabalGG
GenovesioA
Rodriguez-NavarroS
ZimmerC
GadalO
2006 SAGA interacting factors confine sub-diffusion of transcribed genes to the nuclear envelope. Nature 441 770 773
48. TaddeiA
Van HouweG
HedigerF
KalckV
CubizollesF
2006 Nuclear pore association confers optimal expression levels for an inducible yeast gene. Nature 441 774 778
49. KurshakovaMM
KrasnovAN
KopytovaDV
ShidlovskiiYV
NikolenkoJV
2007 SAGA and a novel drosophila export complex anchor efficient transcription and mRNA export to NPC. EMBO J 26 4956 4965
50. MendjanS
TaipaleM
KindJ
HolzH
GebhardtP
2006 Nuclear pore components are involved in the transcriptional regulation of dosage compensation in drosophila. Mol Cell 21 811 823
51. BarrSD
CiuffiA
LeipzigJ
ShinnP
EckerJR
2006 HIV integration site selection: Targeting in macrophages and the effects of different routes of viral entry. Mol Ther 14 218 225
52. FollenziA
AilesLE
BakovicS
GueunaM
NaldiniL
2000 Gene transfer by lentiviral vectors is limited by nuclear translocation and rescued by HIV-1 pol sequences. Nat Genetics 25 217 222
53. NaldiniL
BlomerU
GallayP
OryD
MulliganR
1996 In vivo gene delivery and stable transduction of nondividing cells by a lentiviral vector. Science 272 263 267
54. WangGP
GarrigueA
CiuffiA
RonenK
LeipzigJ
2008 DNA bar coding and pyrosequencing to analyze adverse events in therapeutic gene transfer. Nucleic Acids Res 36 e49
55. BradyT
AgostoLM
MalaniN
BerryCC
O'DohertyU
2009 HIV integration site distributions in resting and activated CD4+ T cells infected in culture. AIDS 23 1461 1471
56. BradyT
LeeYN
RonenK
MalaniN
BerryCC
2009 Integration target site selection by a resurrected human endogenous retrovirus. Genes Dev 23 633 642
57. PryciakPM
VarmusHE
1992 Nucleosomes, DNA-binding proteins, and DNA sequence modulate retroviral integration target site selection. Cell 69 769 780
58. PryciakPM
SilA
VarmusHE
1992 Retroviral integration into minichromosomes in vitro. EMBO J 11 291 303
59. PrussD
BushmanFD
WolffeAP
1994 Human immunodeficiency virus integrase directs integration to sites of severe DNA distortion within the nucleosome core. Proc Natl Acad Sci U S A 91 5913 5917
60. PrussD
ReevesR
BushmanFD
WolffeAP
1994 The influence of DNA and nucleosome structure on integration events directed by HIV integrase. J Biol Chem 269 25031 25041
Štítky
Hygiena a epidemiologie Infekční lékařství Laboratoř
Článek Spatial Distribution and Risk Factors of Highly Pathogenic Avian Influenza (HPAI) H5N1 in ChinaČlánek The Stealth Episome: Suppression of Gene Expression on the Excised Genomic Island PPHGI-1 from pv.Článek Sex and Death: The Effects of Innate Immune Factors on the Sexual Reproduction of Malaria ParasitesČlánek KIR Polymorphisms Modulate Peptide-Dependent Binding to an MHC Class I Ligand with a Bw6 MotifČlánek Viral EncephalomyelitisČlánek Longistatin, a Plasminogen Activator, Is Key to the Availability of Blood-Meals for Ixodid Ticks
Článek vyšel v časopisePLOS Pathogens
Nejčtenější tento týden
2011 Číslo 3- Stillova choroba: vzácné a závažné systémové onemocnění
- Perorální antivirotika jako vysoce efektivní nástroj prevence hospitalizací kvůli COVID-19 − otázky a odpovědi pro praxi
- Diagnostika virových hepatitid v kostce – zorientujte se (nejen) v sérologii
- Parazitičtí červi v terapii Crohnovy choroby a dalších zánětlivých autoimunitních onemocnění
- Choroby jater v ordinaci praktického lékaře – význam jaterních testů
-
Všechny články tohoto čísla
- The Strain-Encoded Relationship between PrP Replication, Stability and Processing in Neurons is Predictive of the Incubation Period of Disease
- Blood Meal-Derived Heme Decreases ROS Levels in the Midgut of and Allows Proliferation of Intestinal Microbiota
- Human Macrophage Responses to Clinical Isolates from the Complex Discriminate between Ancient and Modern Lineages
- Dendritic Cells and Hepatocytes Use Distinct Pathways to Process Protective Antigen from
- Spatial Distribution and Risk Factors of Highly Pathogenic Avian Influenza (HPAI) H5N1 in China
- Rhesus TRIM5α Disrupts the HIV-1 Capsid at the InterHexamer Interfaces
- HIV Integration Targeting: A Pathway Involving Transportin-3 and the Nuclear Pore Protein RanBP2
- Antigenic Variation in Malaria Involves a Highly Structured Switching Pattern
- The Stealth Episome: Suppression of Gene Expression on the Excised Genomic Island PPHGI-1 from pv.
- Invasive Extravillous Trophoblasts Restrict Intracellular Growth and Spread of
- Novel Escape Mutants Suggest an Extensive TRIM5α Binding Site Spanning the Entire Outer Surface of the Murine Leukemia Virus Capsid Protein
- Global Functional Analyses of Cellular Responses to Pore-Forming Toxins
- Sex and Death: The Effects of Innate Immune Factors on the Sexual Reproduction of Malaria Parasites
- Lung Adenocarcinoma Originates from Retrovirus Infection of Proliferating Type 2 Pneumocytes during Pulmonary Post-Natal Development or Tissue Repair
- Botulinum Neurotoxin D Uses Synaptic Vesicle Protein SV2 and Gangliosides as Receptors
- The Moving Junction Protein RON8 Facilitates Firm Attachment and Host Cell Invasion in
- KIR Polymorphisms Modulate Peptide-Dependent Binding to an MHC Class I Ligand with a Bw6 Motif
- The Coxsackievirus B 3C Protease Cleaves MAVS and TRIF to Attenuate Host Type I Interferon and Apoptotic Signaling
- Dissection of the Influenza A Virus Endocytic Routes Reveals Macropinocytosis as an Alternative Entry Pathway
- Viral Encephalomyelitis
- Sheep and Goat BSE Propagate More Efficiently than Cattle BSE in Human PrP Transgenic Mice
- Longistatin, a Plasminogen Activator, Is Key to the Availability of Blood-Meals for Ixodid Ticks
- Metabolite Cross-Feeding Enhances Virulence in a Model Polymicrobial Infection
- A Toxin that Hijacks the Host Ubiquitin Proteolytic System
- Dynamic Imaging of the Effector Immune Response to Infection
- The Lectin Receptor Kinase LecRK-I.9 Is a Novel Resistance Component and a Potential Host Target for a RXLR Effector
- Host Iron Withholding Demands Siderophore Utilization for to Survive Macrophage Killing
- The Danger Signal S100B Integrates Pathogen– and Danger–Sensing Pathways to Restrain Inflammation
- The RNome and Its Commitment to Virulence
- A Novel Nuclear Factor TgNF3 Is a Dynamic Chromatin-Associated Component, Modulator of Nucleolar Architecture and Parasite Virulence
- PLOS Pathogens
- Archiv čísel
- Aktuální číslo
- Informace o časopisu
Nejčtenější v tomto čísle- A Toxin that Hijacks the Host Ubiquitin Proteolytic System
- Invasive Extravillous Trophoblasts Restrict Intracellular Growth and Spread of
- Blood Meal-Derived Heme Decreases ROS Levels in the Midgut of and Allows Proliferation of Intestinal Microbiota
- Metabolite Cross-Feeding Enhances Virulence in a Model Polymicrobial Infection
Kurzy
Zvyšte si kvalifikaci online z pohodlí domova
Autoři: prof. MUDr. Vladimír Palička, CSc., Dr.h.c., doc. MUDr. Václav Vyskočil, Ph.D., MUDr. Petr Kasalický, CSc., MUDr. Jan Rosa, Ing. Pavel Havlík, Ing. Jan Adam, Hana Hejnová, DiS., Jana Křenková
Autoři: MUDr. Irena Krčmová, CSc.
Autoři: MDDr. Eleonóra Ivančová, PhD., MHA
Autoři: prof. MUDr. Eva Kubala Havrdová, DrSc.
Všechny kurzyPřihlášení#ADS_BOTTOM_SCRIPTS#Zapomenuté hesloZadejte e-mailovou adresu, se kterou jste vytvářel(a) účet, budou Vám na ni zaslány informace k nastavení nového hesla.
- Vzdělávání


