-
Články
Top novinky
Reklama- Vzdělávání
- Časopisy
Top články
Nové číslo
- Témata
Top novinky
Reklama- Kongresy
- Videa
- Podcasty
Nové podcasty
Reklama- Kariéra
Doporučené pozice
Reklama- Praxe
Top novinky
ReklamaMixed Effects Modeling of Proliferation Rates in Cell-Based Models: Consequence for Pharmacogenomics and Cancer
The International HapMap project has made publicly available extensive genotypic data on a number of lymphoblastoid cell lines (LCLs). Building on this resource, many research groups have generated a large amount of phenotypic data on these cell lines to facilitate genetic studies of disease risk or drug response. However, one problem that may reduce the usefulness of these resources is the biological noise inherent to cellular phenotypes. We developed a novel method, termed Mixed Effects Model Averaging (MEM), which pools data from multiple sources and generates an intrinsic cellular growth rate phenotype. This intrinsic growth rate was estimated for each of over 500 HapMap cell lines. We then examined the association of this intrinsic growth rate with gene expression levels and found that almost 30% (2,967 out of 10,748) of the genes tested were significant with FDR less than 10%. We probed further to demonstrate evidence of a genetic effect on intrinsic growth rate by determining a significant enrichment in growth-associated genes among genes targeted by top growth-associated SNPs (as eQTLs). The estimated intrinsic growth rate as well as the strength of the association with genetic variants and gene expression traits are made publicly available through a cell-based pharmacogenomics database, PACdb. This resource should enable researchers to explore the mediating effects of proliferation rate on other phenotypes.
Published in the journal: . PLoS Genet 8(2): e32767. doi:10.1371/journal.pgen.1002525
Category: Research Article
doi: https://doi.org/10.1371/journal.pgen.1002525Summary
The International HapMap project has made publicly available extensive genotypic data on a number of lymphoblastoid cell lines (LCLs). Building on this resource, many research groups have generated a large amount of phenotypic data on these cell lines to facilitate genetic studies of disease risk or drug response. However, one problem that may reduce the usefulness of these resources is the biological noise inherent to cellular phenotypes. We developed a novel method, termed Mixed Effects Model Averaging (MEM), which pools data from multiple sources and generates an intrinsic cellular growth rate phenotype. This intrinsic growth rate was estimated for each of over 500 HapMap cell lines. We then examined the association of this intrinsic growth rate with gene expression levels and found that almost 30% (2,967 out of 10,748) of the genes tested were significant with FDR less than 10%. We probed further to demonstrate evidence of a genetic effect on intrinsic growth rate by determining a significant enrichment in growth-associated genes among genes targeted by top growth-associated SNPs (as eQTLs). The estimated intrinsic growth rate as well as the strength of the association with genetic variants and gene expression traits are made publicly available through a cell-based pharmacogenomics database, PACdb. This resource should enable researchers to explore the mediating effects of proliferation rate on other phenotypes.
Introduction
The International HapMap project [1], [2] has made available a vast amount of genetic variation data from a large number of individuals with diverse ethnic background. A recent population based whole-genome sequencing initiative (1000 Genomes Project [3]) sought to expand on this effort by providing a more comprehensive catalog of human genome sequence variation, including rare variants in these samples. These data can be used to study the effect of genetic variants on disease processes, pharmacologic traits, and environmental responses. As part of the HapMap project, EBV-transformed lymphoblastoid cell lines (LCLs) derived from individuals of diverse ancestry were established, which provide renewable sources of DNA and RNA. The commercial availability of these cell lines and the rich genetic information publicly available have enabled a large number of researchers to adopt them as in vitro models for the study of genotype-phenotype relationships in human cells [4]. Consistent with this trend, a vast amount of phenotypic data such as gene expression levels, drug response, and radiation response have been made publicly available [5]–[8]. Furthermore, an enormous amount of genotype-phenotype relationships have been generated [4], [9]–[11]. Our group has therefore constructed a database, PACdb [6], a public central repository of pharmacology-related phenotypes, to host these integrative results obtained in HapMap LCLs.
Although there are many advantages in utilizing the cell-based system for genotype-phenotype studies, the problem of biological and experimental noise when dealing with LCL-based phenotypes and the potential for spurious results has been recognized by several researchers [12], [13]. Indeed, it has been proposed [14] that non-genetic confounders and other technical factors in generating phenotypes from these cell lines may hamper efforts to evaluate the genetic contributions to phenotype. One common factor, cellular growth rate, has undergone scrutiny for its effect on various phenotypes, particularly drug-induced cytotoxicity, a phenotype of interest in pharmacogenomic studies [12], [13]. For example, aberrant growth rate is one of the distinctive features of cancer cells and growth inhibition following exposure to chemotherapeutics and other cytotoxics is intimately related to growth rate [13]. Thus, studying cellular proliferation rate is likely to advance our understanding of cancer pathogenesis. In this study, we set out to extract and combine data from various sources and calculate intrinsic cellular growth rate using a novel mixed effects model (MEM) for over 500 HapMap cell lines.
Previous studies have shown the presence of a strong correlation between gene expression traits and growth rate in other organisms such as yeast and bacteria [15]–[17]. Brauer et al. [15] measured gene expression traits in yeast under several controlled growth conditions and reported that 25% of the gene expression phenotypes were correlated with growth rate. In addition, genes important for cellular proliferation have been found to be differentially expressed in most cancer tissues [18]–[20]. Such genes were shown to be strong prognostic factors in breast cancer [21]–[23], renal cancer [21], lung cancer [21], mantle cell lymphoma patients [24]. Thus, to gain insights into the factors contributing to intrinsic growth rate phenotype, we also evaluated the relationship between gene expression and cellular growth.
Results
Our laboratory has assayed over 500 HapMap LCLs for drug-induced cellular sensitivity phenotypes for a wide spectrum of chemotherapeutic agents and investigated the genetic variants and genes that affect drug response [25], [26]. This set comprises the 180 Utah residents of Western European ancestry (CEU), 180 African from Ibaban, Nigeria (YRI), 90 Asian (ASN, composed of 45 Han Chinese from Beijing and 45 Janapase from Tokyo), and 90 African American from the Southwestern US (ASW) cell lines. For more than 10 chemotherapeutic drugs, cellular growth inhibition after exposure to a range of concentrations of the drug was measured using the alamarBlue assay as described previously [12]. For every single drug sensitivity experiment, the cellular growth rate without drug was also determined, which provided us with a large number of replicated measures of cellular growth rate under a wide range of biological conditions (e.g., freeze and thaw, passage of cells, personnel performing experiments). For example for 90 of CEU phase I and II and 90 of YRI phase I and II LCLs, we had 10 different measurements performed over the course of several years (2006–2011).
Intrinsic growth rate
We have computed the intrinsic growth rate of these cell lines using MEM (described in Materials and Methods section) and provide the values in Table S1. Figure 1 shows these values in comparison with the raw data. The rightmost boxplot in each panel (label 12) represents the intrinsic growth rate. The other boxplots correspond to the raw data. It is clear that the variability of the raw data is in general much larger than the intrinsic growth. Unless otherwise stated, all subsequent analyses are done on the intrinsic growth rate.
Fig. 1. Growth rate measurements by HapMap panel and experiment. 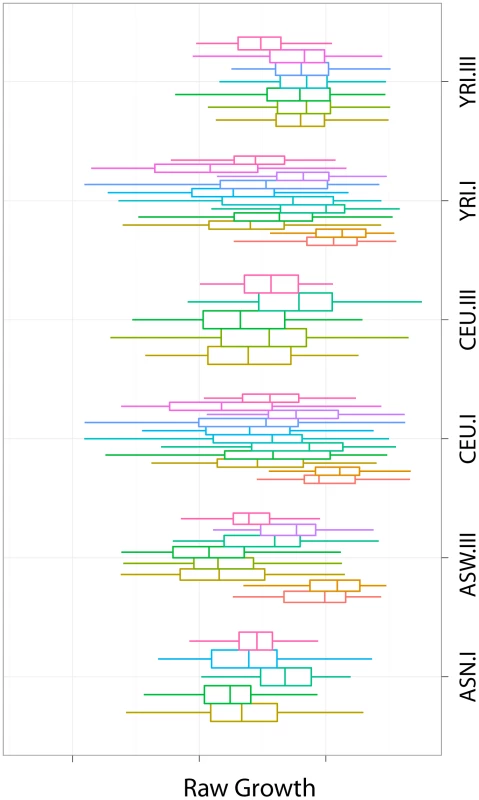
We illustrate the intrinsic growth rate computed with MEM in comparison with the raw data. The rightmost boxplot in each panel (label 12) represents the intrinsic growth rate. The other boxplots correspond to the raw data. The variability of the raw data is in general much larger than that of the intrinsic growth. Population and gender differences exist in LCL intrinsic growth rate
The mean and standard deviation of the intrinsic growth by population is shown in Table 1. The effect of population on growth rate was significant (likelihood ratio test ) with ASW growing the fastest, followed by YRI and ASN, and CEU being the slowest. In pairwise comparison, only CEU's growth was significantly () lower than ASW's. Similar results had been reported for YRI, ASN and CEU by Stark et al. [13] but the wide range of experimental conditions used in the current study strengthens the evidence. Figure 2 shows boxplots of intrinsic growth rate by population. Since we have reduced the effect of confounders by combining data from multiple experiments, the differences we find are likely to be intrinsic to the cell lines. However, the generalizability of these results to in vivo population differences is not obvious. One factor that may explain the slow growth of CEU cell lines is the time from the establishment of these lines and merits further study.
Fig. 2. Intrinsic growth rate by population. 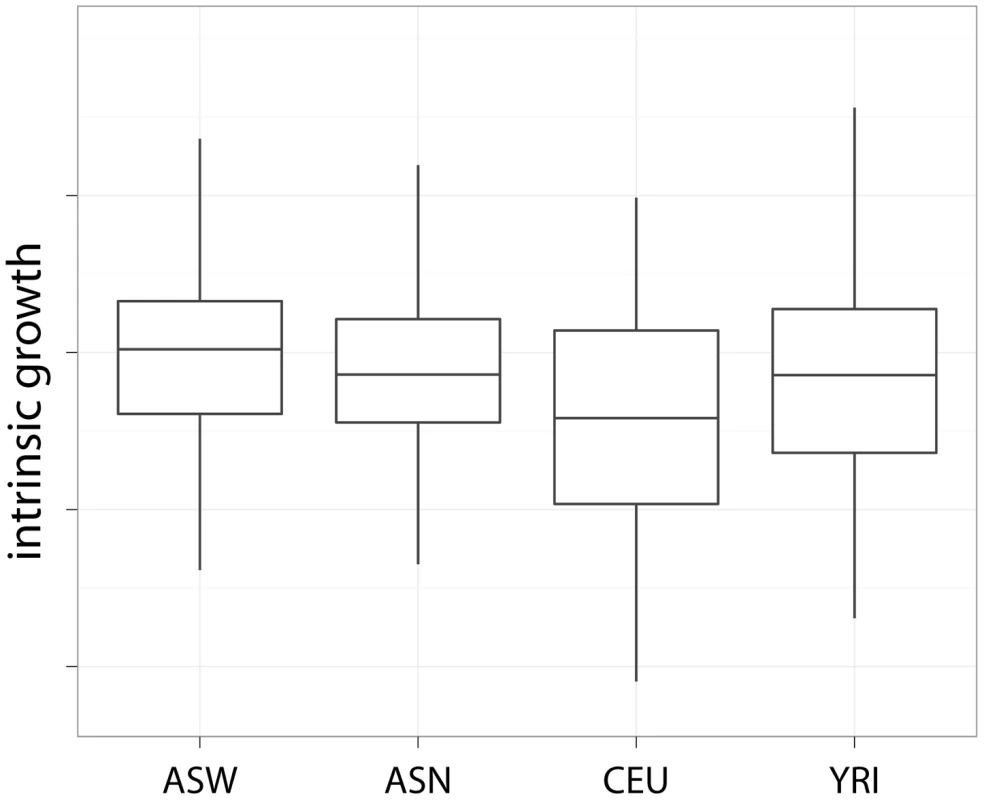
This plot shows the intrinsic growth rate as a function of population. The fastest growing population was ASW, followed by YRI and ASN with roughly similar growth rate, and lastly CEU. Tab. 1. Average intrinsic growth rate by population and gender. 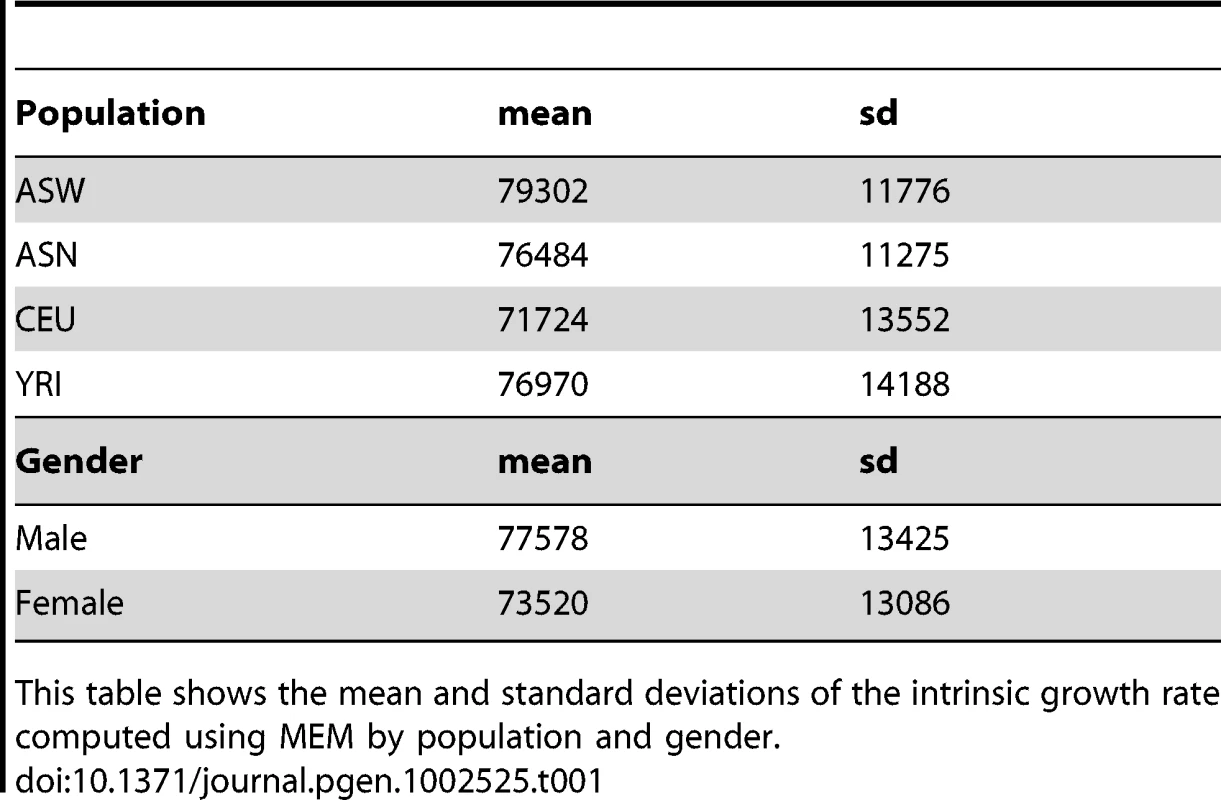
This table shows the mean and standard deviations of the intrinsic growth rate computed using MEM by population and gender. The mean and standard deviation of the intrinsic growth rate by gender are also shown in Table 1. Figure 3 shows the boxplot of the latter by gender and population. The effect of gender on growth rate was found to be significant. Across all experiments, female cell lines grew approximately 7% (95% CI) slower than male cell lines. This finding remained quite consistent across individual experiments. Gender differences are not likely to be due to experimental differences since both female and male cell lines are handled similarly. Differential effect of estrogen and other hormones in media could explain part of this difference.
Fig. 3. Slower growth for female cell lines. 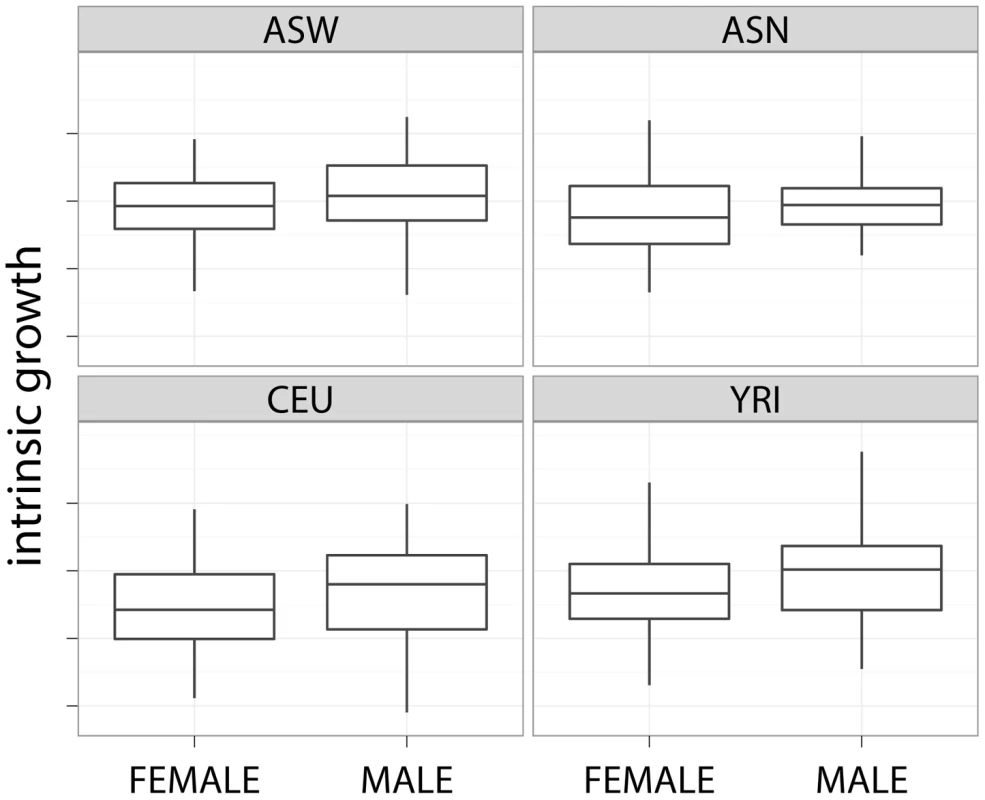
This plot shows the slower growth of female cell lines across different populations. Comparison with other publicly available LCL growth rate dataset
Choy et al. [14] measured growth rate on some of the same cell lines and made the data publicly available (CEU I/II, YRI I/II, and ASN). They performed cell counting for five consecutive days and estimated growth rate as the slope of the fitted line (log concentration vs. time). This growth rate is based on only one biological replicate (although they did measure an additional biological replicate at one time point for a subset of cell lines for internal validation). We compared our estimated intrinsic growth rate with the growth rate measured by Choy et al. [14]. The correlation between Choy's growth rate and ours was 0.30, which supports the idea that both our intrinsic growth and Choy's growth are realizations of the true intrinsic growth rate albeit with different degree of noise. We analyzed Choy's data and found comparable magnitude of the effect of gender (slightly less than 4%; p = 0.07) and cell lines from CEU population grew at the slowest pace in both datasets.
Cellular growth rate is important for gene expression
Baseline gene expression data for CEU and YRI phase I and II described in Zhang et al. [27] were used to examine the association with the intrinsic growth rate. We found that almost 3000 out of the 10748 genes examined were associated with the intrinsic growth rate at FDR0.10; the result held regardless of whether we adjusted for expression heterogeneity or not [28]. The list of genes whose expression level associated with intrinsic growth rate in CEU and YRI LCLs is provided in Table S2. Figure 4 shows the QQ-plot of p-values from the association between gene expression phenotypes and intrinsic growth rate adjusted by gender and population. The upper left panel shows the QQ-plot for the unadjusted analysis and the upper right panel shows the plot for the Surrogate Variable Analysis (SVA; expression heterogeneity) adjusted analysis. The lower panels show the corresponding histograms with p-values highly concentrated near the zero. The gray dots in each of the QQ-plots correspond to p-values under the null hypothesis of no association, which was computed by randomly permuting the phenotype. Actual p-values lie well above the null hypothesis p-values, which indicate that the significance found is not due to model misspecification or correlation between gene expression phenotypes. Stark et al. [13] had not been able to find significant association (FDR0.10) between gene expression and growth rate in the first phase CEU population because of the noisier version of growth rate and smaller sample size used at the time. The strong correlation between gene expression traits and cellular growth rate is consistent with similar findings in yeast [15] and in bacteria [16], [17].
Fig. 4. Intrinsic growth versus gene expression with Surrogate Variable Analysis adjustment. 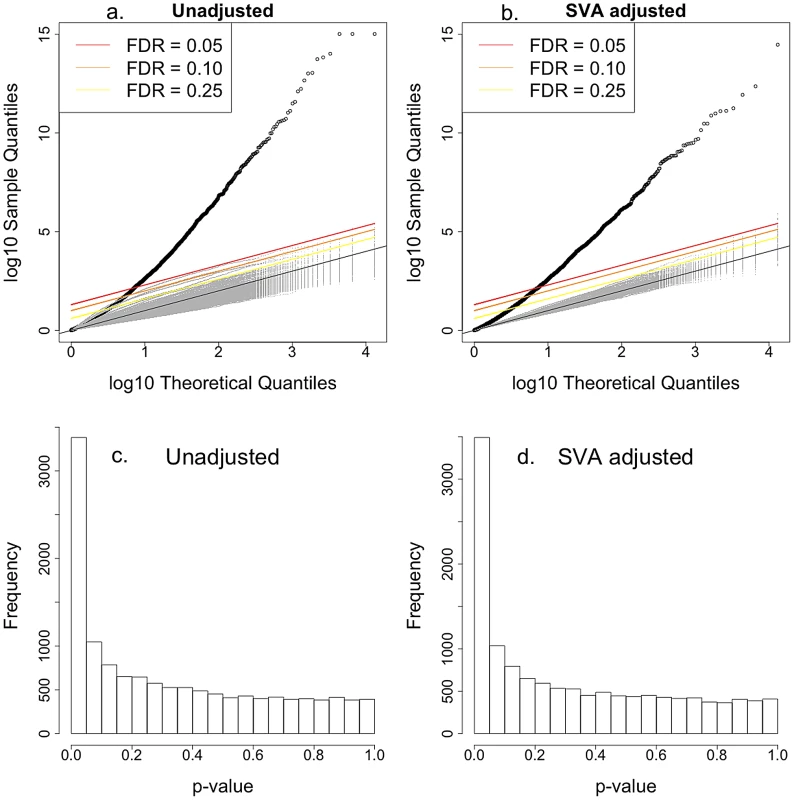
a. QQ-plot of the association p-values between gene expression and intrinsic growth adjusted by gender and population. b. QQ-plot of the association p-values between gene expression and intrinsic growth adjusted by gender, population, and expression heterogeneity. Points above the red, orange, and yellow lines have FDR less than 0.05, 0.10, and 0.25 under the assumption of no correlation between gene expressions. Gray line is the one to one line. Gray dots correspond to 200 associations estimated after permuting the growth rate so the null hypothesis of no association would hold. It is clear that the high significance of p-values is not due to model misspecification nor correlations between gene expression levels. c. Histogram of association p-values from a. d. Histogram of association p-values from b. A clear advantage of using our method is shown by the fact that our power to detect association between gene expression phenotype and growth rate is substantially increased. This is illustrated in Figure 5, which compares the p-values from the association between gene expression phenotype and growth rate when the intrinsic value computed with MEM is used vs. when the individual experiment's values are used. The left panel shows the p-values from the SVA (expression heterogeneity) adjusted analysis and the right panel shows the results from the unadjusted analysis. All points lie below the one-to-one line, which means that the intrinsic growth rate achieves greater power in identifying association than any of the individual experiment's data. The red dots correspond to growth rate data from Choy et al. [14].
Fig. 5. Comparison of significance between intrinsic growth and individual experiment's growth. 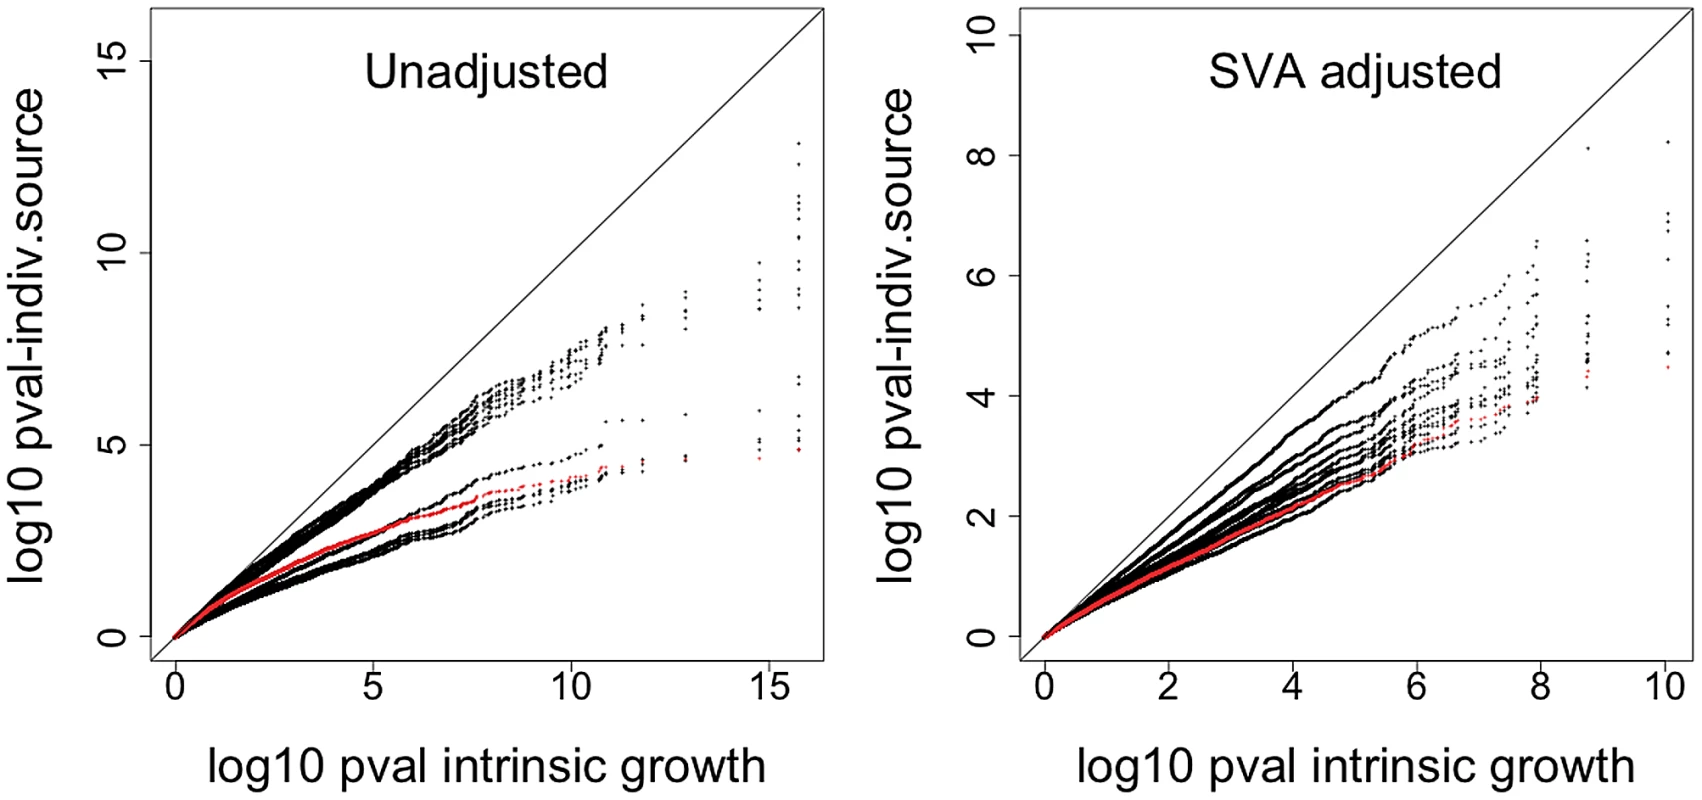
The plot shows the QQ-plot comparing the p-values from the association between gene expression phenotype and growth rate when the intrinsic value computed with MEM is used vs. when the individual experiment's values are used. The left panel shows the p-values from the SVA-adjusted analysis and the right panel shows the results from the unadjusted analysis. All points are below the one to one line, which means that the intrinsic growth rate achieves greater power in identifying association than any of the individual experiment's data. The red line corresponds to growth rate data from Choy et al. [14]. Functional significance of growth-rate associated genes
Functional enrichment analysis was performed using DAVID Bioinformatics Resources [29], [30]. Table 2 shows the GO terms that were enriched in our intrinsic growth rate-associated gene set. They clustered into cell cycle, cell death, intracellular transport, protein transport and phosphorylation. For comparison, we checked the proportion of cell cycle, mitosis, cell death and phosphorylation genes among metabolic process genes (from GO) and immune response genes (from GO). The proportion of growth-associated genes annotated to these terms were 6.8%, 2.7%, 6.1%, and 6.2%, respectively. In comparison, among immune response genes 0.2%, 0.16%, 1.1%, and 0% were annotated to these terms. For metabolic process genes none of these terms reached significance at the loose threshold of .
Tab. 2. GO enrichment analysis of growth-associated genes. 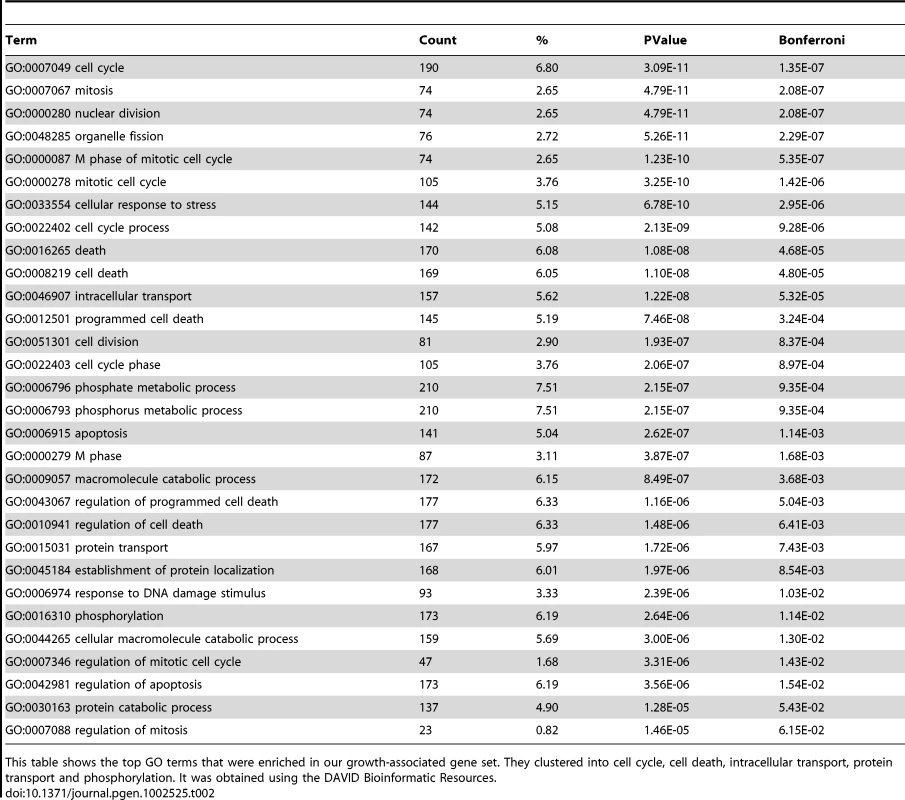
This table shows the top GO terms that were enriched in our growth-associated gene set. They clustered into cell cycle, cell death, intracellular transport, protein transport and phosphorylation. It was obtained using the DAVID Bioinformatic Resources. Table 3 shows the SP-PIR keywords enriched in our growth gene set; more than half of the growth-associated genes were associated with phosphoprotein (p) and 22% of them were associated with acetylation (p). For comparison, we checked the proportion of genes related to phosphoprotein keyword for two other cellular functions: metabolism (metabolic process from GO) and immune response. None of these genes were annotated with the phosphoprotein keyword in the SP-PIR database.
Tab. 3. SP-PIR keyword enrichment of growth-associated genes. 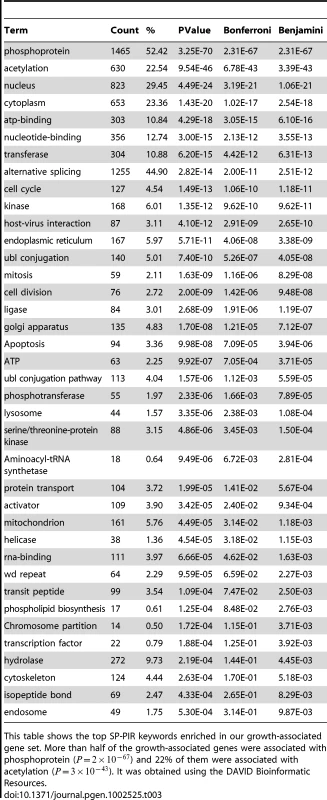
This table shows the top SP-PIR keywords enriched in our growth-associated gene set. More than half of the growth-associated genes were associated with phosphoprotein () and 22% of them were associated with acetylation (). It was obtained using the DAVID Bioinformatic Resources. Table S3 shows the Kegg pathways enriched in our set.
Cell proliferation signatures
We compared the growth-associated genes with two recently published proliferation signatures. The first one was obtained by performing a meta-analysis of over 2833 breast tumor expression profiles by Wirapati et al. [31]. The second one was compiled by Starmans et al. [21] based on cell cycle in cervix cancer cell lines [32] and human fibroblasts [33]. We found that 44% of Wirapati's proliferation genes belonged [31] to our growth-associated gene list (defined as ) and 75% of them had a positive effect on growth (higher expression associated with faster growth). This enrichment is not likely to occur by chance as can be seen in Figure 6. The figure shows a histogram of the number of growth-associated genes we would get if we randomly sampled the set of all genes we considered. The vertical line indicates the actual number of growth-associated genes in Wirapati's list. We performed the same analysis with Starmans et al. [21] proliferation signature but did not find any significant enrichment. Nevertheless, 80% of the Starmans' proliferation genes had a positive effect on LCL growth rate.
Fig. 6. Growth gene overlap with Wirapati et al's proliferation signature. 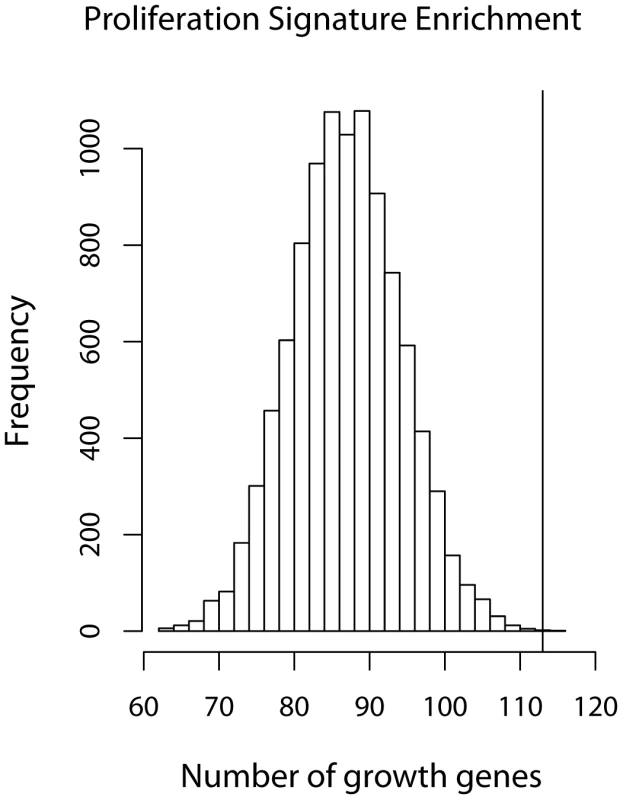
Histogram of the number of growth genes (as defined by ) when a random set of 235 genes were sampled out of 10748 genes. The maximum number of growth genes was 101 after 10000 simulations. The black circle indicates the 104 growth genes found in Wirapati's proliferation signature [31]. Enrichment of growth-associated gene eQTLs among top growth-associated SNPs
We performed a genome wide association study (GWAS) of the intrinsic growth rate for CEU and YRI unrelated cell lines. Even though we were unable to find genome-wide significant SNPs, we did find that the top intrinsic growth-associated SNPs were more likely to target (as eQTLs) intrinsic growth-associated genes. We have quantified the enrichment using three different procedures described in the Methods section. The first one uses the hypergeometric distribution to test the enrichment of growth associated genes among targets of growth associated SNPs. The Fisher's test p-value was . The second method accounts for the correlation between genes and yielded an empirical (none of the 1000 simulations yielded Fisher's test p-value smaller than the observed ). The third method accounts for the fact that the data from the same individuals are used when computing the intrinsic growth-gene association as well as the intrinsic growth-SNP association. The empirical p-value with this method was 0.026.
Growth-associated gene eQTLs
Since eQTLs have been shown to be more likely to be associated with complex phenotypes [34]–[37], we focused the analysis on growth-associated gene eQTLs but the enrichment was not strong enough to render significant SNPs after adjusting for multiple testing. Interestingly however, among the growth-gene eQTLs we found two well-replicated colorectal cancer SNPs: rs4779584 [38], [39] and rs3802842 [39], [40]. A target gene of rs4779584 is a growth-associated gene NEU1 [MIM:608272] (growth gene expression association ), which has been reported to contribute to the suppression of metastasis of human colon cancer [41]. A target gene of rs3802842, MED13 [MIM: 603808] (growth gene association q-value = 0.052), is part of the CDK8 subcomplex [42] and CDK8 is a colorectal oncogene that regulates beta catenin activity [43]. To our knowledge, the potential functional connection between these two established colorectal cancer SNPs and the growth-associated genes NEU1 and MED13 has not been made previously. The association between these SNPs and intrinsic growth rate however was not significant.
Effect of EBV copy number on intrinsic growth accounted by SVA
As an attempt to address the concern of whether these associations may be confounded by EBV transformation, we cross-checked the growth-associated genes with the list of EBV transformation-associated genes reported by Caliskan et al. [44] and found no evidence of enrichment of EBV genes among our growth genes. Furthermore, we analyzed the effect of EBV copy numbers on intrinsic growth. For this purpose, we used measurements of EBV copy numbers on a large portion of cells used for the association with gene expression (86 CEU, 74 YRI) from Choy et al. [14]. We found a small but significant effect () of EBV on intrinsic growth. However, once we accounted for SVA variables (expression heterogeneity), the effect was no longer significant. Similar results were found using EBV data generated in our lab for a subset of the samples. This result suggests that the intrinsic growth-gene expression associations we found (SVA adjusted) are not mediated by EBV copy numbers, consistent with the lack of enrichment in EBV-related genes among our top growth genes.
Discussion
In this study, we propose a novel method, MEM, that combines data from multiple sources using a mixed effects model and estimates an intrinsic phenotype that is more reflective of the true phenotype than each of the individual experiment's data. We apply it to generate intrinsic cellular growth rate, which is a phenotype with important implications for disease biology and phamacogenomics. Using MEM we computed the intrinsic growth rate of over 500 HapMap cell lines and studied their properties. To our knowledge, this is the most comprehensive analysis to date of intrinsic cellular growth rate for the HapMap cell lines, for which various biological conditions were included in the estimation. We understand that estimates of intrinsic growth can be further improved as more experiments are included. A Bayesian approach would fit well for this purpose. Existing data would make up the prior distribution for the intrinsic growth rates and the addition of new data would generate posterior distributions, presumably more concentrated on the true intrinsic growth rates. We plan to regularly update the HapMap LCL intrinsic growth rate phenotype data and make them widely available to the research community through PACdb [6].
We found significant in vitro population differences in cellular growth rate in the HapMap populations included in our study. The ASW lines (African American) proliferated at the fastest rate followed by YRI and ASN (Asian), and CEU were the slowest. We analyzed Choy et al.'s [14] growth rate data and also found CEU lines to grow slower than other populations. Since we combined data from multiple sources and reduced the level of noise, the observed population differences are likely to be intrinsic to the cell lines and may in part be due to genetic factors; however, the methods used in establishing the LCLs and the experimental conditions during the EBV-transformation could also contribute to this observation. The fact that CEU cell lines were established much earlier than other populations could in part explain their slow growth. Of the populations included in the HapMap Project, only the CEU LCLs existed as previously established cell lines. The other populations were collected and established as cell lines specifically for the HapMap Project over the years 2002 through 2007 [12], [13]. Nonetheless, the observed population difference in intrinsic cellular growth rate needs to be considered when studying population differences in complex traits using these cell lines.
Interestingly, we found that female cell lines grow at roughly 7% slower pace than male cell lines consistently across different experiments. We found similar gender effect when we analyzed Choy et al.'s data [14]. Gender differences are not likely to be due to experimental differences since both female and male cell lines are handled similarly. Differential effect of estrogen and other hormones in media could explain part of this difference.
It is not clear whether these observed population and gender differences are extensible beyond these cell lines. However, these initial observations warrant further studies.
We found that almost 3000 gene expression phenotypes were associated with the intrinsic growth rate, which is consistent with findings in yeast [15]. This finding held robustly, whether or not we accounted for expression heterogeneity using Surrogate Variable Analysis [28]. Our top growth-related genes were enriched in cell cycle, mitosis, cell death, and phosphorylation terms. We also found a significant overlap between our intrinsic growth genes and a proliferation signature inferred from breast tumor microarray data [31]. Thus, our study provides a comprehensive list - combining both germline and tumor cells - of potential biomarkers and therapeutic targets for proliferation-mediated phenotypes. Furthermore, the gene expression traits associated with intrinsic growth determined by our study are much more significant than their corresponding associations with growth rate data generated from any individual experiment, including Choy et al.'s [14] growth rate. This strongly suggests that our method to combine data from several experiments is succeeding at yielding a more intrinsic measure of growth rate.
Despite the limited power given the relatively small sample size used for eQTL mapping, we demonstrate evidence of genetic effect on intrinsic growth rate by determining the enrichment of growth-associated genes among genes targeted by top growth-associated SNPs (as eQTLs) after accounting for LD structure and correlation between gene expressions. Interestingly, among intrinsic growth gene eQTLs, we found two well replicated colorectal cancer SNPs (rs4779584 [38], [39] and rs3802842 [39], [40]), which target growth-associated genes NEU1 and MED13; both genes have been implicated in colorectal cancer [41]–[43].
We deposited our findings into PACdb [6], which should be a useful addition to the already rich set of phenotype data currently available for the HapMap cell lines. In addition to the intrinsic growth rates (Table S1), the significance of the association with gene expression phenotypes (Table S2) is available from the same database. This resource should be useful to explore any mediation effect of growth rate on the phenotype of interest either by using the intrinsic growth rate as a covariate in the analysis or by looking at overlap between the phenotype of interest and the top growth related genes. We also make the R code to apply MEM and generate intrinsic growth available on PACdb (http://pacdb.org/growthrate/generate-igrowth.r and http://pacdb.org/growthrate/rawgrowth.txt)
Materials and Methods
Mixed Effects Model averaging MEM
MEM pools phenotype data from multiple sources and computes an intrinsic value of the phenotype for each individual after accounting for different experimental conditions and covariates.where the index identifies the individual or cell line, i represents the intrinsic phenotype of the individual, experimental conditions can represent a large range of different experimental conditions (for example different sites, technicians, method, passage number, etc.), 's are relevant covariates, and is an error term. The index represents different replications of the data for given individual and experimental condition. The intrinsic phenotype and experimental conditions are treated as random effects and covariates 's are treated as fixed effects. Extension to generalized linear model is straightforward.
Hapmap cell lines and intrinsic growth
HapMap cell lines were purchased from the non-profit Coriell Institute for Medical Research (http://www.coriell.org/) and growth rates were measured using alamarBlue assay as described in Stark et al. [12].
The alamarBlue assay gives a measure of the number of proliferating cells at time :where is some increasing function. Thus growth rate can in principle be computed aswhich is also some function of the alamar number. With a slight abuse of notation, we will refer to this alamar number as the growth rate. It should be noted that the approach we describe here holds generally regardless of the assay used to measure the number of proliferating cells.
We use MEM to compute an intrinsic growth rate for each cell with the following model:where the index identifies the cell line, pop is the population to which the cell line belongs to (CEU,YRI, ASW, or ASN), iGrowth0 represents the intrinsic growth rate of the cell line, experimental conditions can represent a large range of different experimental conditions, and is an error term. The index represents different replications of the data for given individual and experimental condition. We set the gender and population as fixed effects and experimental conditions and iGrowth0 as random effects.
The term iGrowth0 is a cell line specific intercept (so it is different for each cell line) and can be interpreted as (some monotone function of) the intrinsic growth rate of each individual. This term is (by construction) orthogonal to gender and population. In general, it may make more sense to include the population and gender effect in the intrinsic growth rate so we define iGrowth as the sum of the iGrowth0 and the estimated effects of population and gender.The term “experimental conditions” could be allowed to be more than one-dimensional. For our dataset it was sufficient to use “technician” as the experimental condition. The reason for this choice was that each technician's work was for the most part concentrated at roughly the same time (within 6 months) so the experimental conditions such as thaw history are likely to be reasonably homogeneous. Our results were robust to using other combinations of experimental conditions such as a combination of technician, drug and population. We found no need to account for the trio structure since the correlation coefficient between parent and child was not significantly different from zero. This fact should not be interpreted as lack of heritability but that the level of noise was too high to be able to estimate the correlation with the given sample size.
Growth rate itself was quite normally distributed. The additivity assumption of the model may be better achieved in the log scale but we did not notice much difference in the overall results when we tried different transformations so we used the untransformed variable. We fit the mixed effects model using the lme4 [45] package for the R Statistical Software [46]. P-values for the fixed effects were calculated using likelihood ratio tests after fitting the models with maximum likelihood option (REML = FALSE).
Gene expression data was generated by our lab for phase I/II CEU and YRI cell lines using Affymetrix GeneChip Human Exon 1.0 ST array as described by Zhang et al. [27]. Association between gene expression and growth rate was calculated using a linear model with log-transformed gene expression data as response and intrinsic growth, population and gender as covariates.Surrogate Variable adjustment was done using the SVA package [28], [47]. FDR was computed using Storey's qvalue package[48], [49]. Figures were generated using the graphic capabilities of R and the ggplot2 package [50] in R. Functional term enrichment was assessed using DAVID [29], [30]. Genes associated with intrinsic growth at % were used as significant genes and the default Homo Sapiens list was used as background.
Genome wide association between genotype and intrinsic growth was performed using the PLINK v1.97 software [51] (http://pngu.mgh.harvard.edu/purcell/plink/). CEU (I/II and II) and YRI (I/II and III) unrelated cell lines were used with draft release 2 consensus genotype (which passed QC across all 11 populations from HapMap 3 samples) downloaded from the HapMap Project website.
Enrichment of growth associated genes among targets of growth associated SNPs
We use three methods to assess the enrichment of growth associated genes among targets of growth associated SNPs.
First we use the hypergeometric distribution and tests (Fisher's test) whether the overlap is more significant than one would get with a random set of genes. This method computes the exact p-value but assumes independence between genes.
The second method accounts for the correlation structure between target genes by simulation, which will induce a correlation structure between simulated genes similar to the observed one. For this purpose, we permute the phenotype 1000 times and for each permutation we perform GWAS, select the top SNPs (), query the target genes for the top SNPs () using SCANdb, and calculate the Fisher's test p-value for the overlap between growth genes and target genes. Finally, we compute an empirical p-value for the enrichment as the proportion of times the simulated Fisher's p-value was smaller than the observed Fisher's p-value.
The third method accounts for the fact that the data from the same individuals are used when computing the intrinsic growth-gene association as well as the intrinsic growth-SNP association. The simulated target genes are generated as described in the second method. The intrinsic growth associated genes are generated using the same permuted phenotype used to generate the target genes (FDR). The association p-value is computed by regressing the simulated intrinsic growth on gene expressions (without expression heterogeneity adjustment, ). For each simulation, the Fisher's p-value is computed for the overlap between simulated target genes and simulated intrinsic growth associated genes. Finally, we compute an empirical p-value for the enrichment as the proportion of times the simulated p-value was smaller than the observed p-value.
Supporting Information
Zdroje
1. International HapMap Consortium 2003 The international hapmap project. Nature 426 789 96
2. International HapMap Consortium 2007 A second generation human haplotype map of over 3.1 million snps. Nature 449 851 61
3. Genomes Project Consortium 2010 A map of human genome variation from population-scale sequencing. Nature 467 1061 73
4. WelshMMangraviteLMedinaMTantisiraKZhangW 2009 Pharmacogenomic discovery using cell-based models. PHARMACOLOGICAL REVIEWS 61 413
5. GamazonERZhangWKonkashbaevADuanSKistnerEO 2010 Scan: Snp and copy number annotation. Bioinformatics 26 259 262
6. GamazonERDuanSZhangWHuangRSKistnerEO 2010 Pacdb: a database for cell-based pharmacogenomics. Pharmacogenet Genomics 20 269 273
7. ThornCFKleinTEAltmanRB 2005 Pharmgkb: the pharmacogenetics and pharma-cogenomics knowledge base. Methods Mol Biol 311 179 91
8. KleinTEChangJTChoMKEastonKLFergersonR 2001 Integrating genotype and phenotype information: an overview of the pharmgkb project. pharmacogenetics research network and knowledge base. The Pharmacogenomics Journal 1 167 70
9. WheelerHEGamazonERStarkALODonnellPHGorsicLK 2011 Genome-wide meta-analysis identifies variants associated with platinating agent susceptibility across populations. The Pharmacogenomics Journal
10. WenYGorsicLKWheelerHEZiliakDMHuangRS 2011 Chemotherapeutic - induced apoptosis: a phenotype for pharmacogenomics studies. Pharmacogenet Genomics 21
11. SmirnovDAMorleyMShinESpielmanRSCheungVG 2009 Genetic analysis of radiation-induced changes in human gene expression. Nature 459 587 591
12. StarkALZhangWMiSDuanSO'DonnellPH 2010 Heritable and non-genetic factors as variables of pharmacologic phenotypes in lymphoblastoid cell lines. The Pharmacogenomics Journal 10 505
13. StarkAZhangWZhouTO'DonnellPBeiswangerC 2010 Population differences in the rate of proliferation of international hapmap cell lines. The American Journal of Human Genetics
14. ChoyEYelenskyRBonakdarSPlengeRMSaxenaR 2008 Genetic analysis of human traits in vitro: Drug response and gene expression in lymphoblastoid cell lines. PLoS Genet 4 e1000287 doi:10.1371/journal.pgen.1000287
15. BrauerMHuttenhowerCAiroldiERosensteinRMateseJ 2008 Coordination of growth rate, cell cycle, stress response, and metabolic activity in yeast. Molecular Biology of the Cell 19 352
16. ScottMGundersonCWMateescuEMZhangZHwaT 2010 Interdependence of cell growth and gene expression: origins and consequences. Science 330 1099 102
17. KlumppSZhangZHwaT 2009 Growth rate-dependent global effects on gene expression in bacteria. Cell 139 1366 1375
18. WhitfieldMGeorgeLGrantGPerouC 2006 Common markers of proliferation. Nat Rev Cancer 6 99 106
19. RossDScherfUEisenMPerouCReesC 2000 Systematic variation in gene expression patterns in human cancer cell lines. Nature genetics 24 227 235
20. RhodesDYuJShankerKDeshpandeNVaramballyR 2004 Large-scale meta-analysis of cancer microarray data identifies common transcriptional profiles of neoplastic transformation and progression. Proc Natl Acad Sci USA 101 9309
21. StarmansMHWKrishnapuramBSteckHHorlingsHNuytenDSA 2008 Ro - bust prognostic value of a knowledge-based proliferation signature across large patient microarray studies spanning different cancer types. Br J Cancer 99 1884
22. DamascoCLemboASommaMPGattiMCuntoFD 2011 A signature inferred from drosophila mitotic genes predicts survival of breast cancer patients. PLoS ONE 6 e14737 doi:10.1371/journal.pone.0014737
23. DaiH 2005 A cell proliferation signature is a marker of extremely poor outcome in a subpopulation of breast cancer patients. Cancer Res 65 4059 4066
24. RosenwaldAWrightGWiestnerAChanWCConnorsJM 2003 The pro-liferation gene expression signature is a quantitative integrator of oncogenic events that predicts survival in mantle cell lymphoma. Cancer Cell 3 185 197
25. HuangRSDuanSBleibelWKistnerEZhangW 2007 A genome-wide approach to identify genetic variants that contribute to etoposide-induced cytotoxicity. Proceedings of the National Academy of Sciences 104 9758
26. HuangRSDuanSShuklaSJKistnerEOClarkTA 2007 Identification of genetic variants contributing to cisplatin-induced cytotoxicity by use of a genomewide approach. The American Journal of Human Genetics 81 427 437
27. ZhangWDuanSKistnerEBleibelWHuangRS 2008 Evaluation of genetic variation contributing to differences in gene expression between populations. The American Journal of Human Genetics 82 631 640
28. LeekJStoreyJ 2008 A general framework for multiple testing dependence. Proceedings of the National Academy of Sciences 105 18718
29. HuangDWShermanBTLempickiRA 2009 Systematic and integrative analysis of large gene lists using david bioinformatics resources. Nat Protoc 4 44 57
30. HuangDWShermanBTLempickiRA 2009 Bioinformatics enrichment tools: paths toward the comprehensive functional analysis of large gene lists. Nucleic Acids Res 37 1 13
31. WirapatiPSotiriouCKunkelSFarmerPPradervandS 2008 Meta-analysis of gene expression profiles in breast cancer: toward a unified understanding of breast cancer subtyping and prognosis signatures. Breast Cancer Res 10 R65
32. WhitfieldMSherlockGSaldanhaAMurrayJBallC 2002 Identification of genes periodically expressed in the human cell cycle and their expression in tumors. Molecular Biology of the Cell 13 1977
33. ChangHSneddonJAlizadehASoodRWestR 2004 Gene expression signature of fibroblast serum response predicts human cancer progression: similarities between tumors and wounds. PLoS Biol 2 e7 doi:10.1371/journal.pbio.0020007
34. NicolaeDGamazonEZhangWDuanSDolanM 2010 Trait-associated snps are more likely to be eqtls: Annotation to enhance discovery from GWAS. PLoS Genet 6 e1000888 doi:10.1371/journal.pgen.1000888
35. GamazonERHuangRSCoxNJDolanME 2010 Chemotherapeutic drug susceptibility associated snps are enriched in expression quantitative trait loci. Proc Natl Acad Sci USA 107 9287 9292
36. NicaACMontgomerySBDimasASStrangerBEClaudeBeazley 2010 Candidate causal regulatory effects by integration of expression qtls with complex trait genetic associations. PLoS Genet 6 e1000895 doi:10.1371/journal.pgen.1000895
37. FehrmannRJansenRCVeldinkJHWestraHJArendsD 2011 Trans-eqtls reveal that independent genetic variants associated with a complex phenotype converge on intermediate genes, with a major role for the hla. PLoS Genet e1002197 doi:10.1371/journal.pgen.1002197
38. JaegerEWebbEHowarthKCarvajal-CarmonaLRowanA 2007 Common genetic variants at the crac1 (hmps) locus on chromosome 15q13. 3 inuence colorectal cancer risk. Nat Genet 40 26 28
39. HoJChoiSf LeeYHuiTChernyS 2011 Replication study of snp associations for colorectal cancer in hong kong chinese. Br J Cancer 104 369 375
40. TenesaAFarringtonSMPrendergastJGPorteousMEWalkerM 2008 Genome-wide association scan identifies a colorectal cancer susceptibility locus on 11q23 and replicates risk loci at 8q24 and 18q21. Nat Genet 40 631 637
41. UemuraTShiozakiKYamaguchiKMiyazakiSSatomiS 2009 Contribution of sialidase neu1 to suppression of metastasis of human colon cancer cells through desia-lylation of integrin 4. Oncogene
42. KnueselMTMeyerKDBerneckyCTaatjesDJ 2009 The human cdk8 subcomplex is a molecular switch that controls mediator coactivator function. Genes & Development 23 439 451
43. FiresteinRBassAJKimSYDunnIFSilverSJ 2008 Cdk8 is a colorectal cancer oncogene that regulates -catenin activity. Nature 455 547 551
44. ÇalşkanMCusanovichDAOberCGiladY 2011 The effects of ebv transformation on gene expression levels and methylation profiles. Human molecular genetics 20 1643 52
45. BatesDMaechlerMBolkerB 2011 lme4: Linear mixed-effects models using S4 classes. URL http://CRAN.R-project.org/package=lme4. R package version 0.999375-38
46. R Development Core Team 2010 R: A Language and Environment for Statistical Computing. R Foundation for Statistical Computing, Vienna, Austria. URL http://www.R-project.org/. ISBN 3-900051-07-0
47. LeekJT sva: Surrogate Variable Analysis. Key: sva.package Annotation: R package version 1.1.0
48. DabneyAStoreyJD with assistance from Gregory R Warnes 2010 qvalue: Q-value estimation for false discovery rate control. URL http://CRAN.R-project.org/package=qvalue. R package version 1.24.0
49. StoreyJDTibshiraniR 2003 Statistical significance for genomewide studies. Proc Natl Acad Sci USA 100 9440 5
50. WickhamH 2009 ggplot2: elegant graphics for data analysis. Springer New York. URL http://had.co.nz/ggplot2/book
51. PurcellSNealeBTodd-BrownKThomasLFerreiraMAR 2007 Plink: a tool set for whole-genome association and population-based linkage analyses. The American Journal of Human Genetics 81 559 575
Štítky
Genetika Reprodukční medicína
Článek vyšel v časopisePLOS Genetics
Nejčtenější tento týden
2012 Číslo 2- Akutní intermitentní porfyrie
- Růst a vývoj dětí narozených pomocí IVF
- Farmakogenetické testování pomáhá předcházet nežádoucím efektům léčiv
- Pilotní studie: stres a úzkost v průběhu IVF cyklu
- IVF a rakovina prsu – zvyšují hormony riziko vzniku rakoviny?
-
Všechny články tohoto čísla
- Upsetting the Dogma: Germline Selection in Human Males
- A Strong Deletion Bias in Nonallelic Gene Conversion
- Positive Selection for New Disease Mutations in the Human Germline: Evidence from the Heritable Cancer Syndrome Multiple Endocrine Neoplasia Type 2B
- Genome-Wide Association Study in East Asians Identifies Novel Susceptibility Loci for Breast Cancer
- Mixed Effects Modeling of Proliferation Rates in Cell-Based Models: Consequence for Pharmacogenomics and Cancer
- Reduction of NADPH-Oxidase Activity Ameliorates the Cardiovascular Phenotype in a Mouse Model of Williams-Beuren Syndrome
- Genome-Wide Association Study Identifies Chromosome 10q24.32 Variants Associated with Arsenic Metabolism and Toxicity Phenotypes in Bangladesh
- Structural Basis of Transcriptional Gene Silencing Mediated by MOM1
- Genomic Restructuring in the Tasmanian Devil Facial Tumour: Chromosome Painting and Gene Mapping Provide Clues to Evolution of a Transmissible Tumour
- Genome-Wide Association Study Identifies Novel Loci Associated with Circulating Phospho- and Sphingolipid Concentrations
- Contrasting Properties of Gene-Specific Regulatory, Coding, and Copy Number Mutations in : Frequency, Effects, and Dominance
- The Origin and Nature of Tightly Clustered Deletions in Precursor B-Cell Acute Lymphoblastic Leukemia Support a Model of Multiclonal Evolution
- Ultrafast Evolution and Loss of CRISPRs Following a Host Shift in a Novel Wildlife Pathogen,
- Phosphorylation of Chromosome Core Components May Serve as Axis Marks for the Status of Chromosomal Events during Mammalian Meiosis
- Psoriasis Patients Are Enriched for Genetic Variants That Protect against HIV-1 Disease
- A Pathogenic Mechanism in Huntington's Disease Involves Small CAG-Repeated RNAs with Neurotoxic Activity
- The Mitochondrial Chaperone Protein TRAP1 Mitigates α-Synuclein Toxicity
- Homeobox Genes Critically Regulate Embryo Implantation by Controlling Paracrine Signaling between Uterine Stroma and Epithelium
- Developmental Transcriptional Networks Are Required to Maintain Neuronal Subtype Identity in the Mature Nervous System
- Down-Regulating Sphingolipid Synthesis Increases Yeast Lifespan
- Gene Expression and Stress Response Mediated by the Epigenetic Regulation of a Transposable Element Small RNA
- Loss of Tgif Function Causes Holoprosencephaly by Disrupting the Shh Signaling Pathway
- Sequestration of Highly Expressed mRNAs in Cytoplasmic Granules, P-Bodies, and Stress Granules Enhances Cell Viability
- Discovery of a Modified Tetrapolar Sexual Cycle in and the Evolution of in the Species Complex
- The Role of Glypicans in Wnt Inhibitory Factor-1 Activity and the Structural Basis of Wif1's Effects on Wnt and Hedgehog Signaling
- Nondisjunction of a Single Chromosome Leads to Breakage and Activation of DNA Damage Checkpoint in G2
- A Regulatory Network for Coordinated Flower Maturation
- Coexpression Network Analysis in Abdominal and Gluteal Adipose Tissue Reveals Regulatory Genetic Loci for Metabolic Syndrome and Related Phenotypes
- Diced Triplets Expose Neurons to RISC
- The Williams-Beuren Syndrome—A Window into Genetic Variants Leading to the Development of Cardiovascular Disease
- The Empirical Power of Rare Variant Association Methods: Results from Sanger Sequencing in 1,998 Individuals
- Systematic Detection of Epistatic Interactions Based on Allele Pair Frequencies
- Familial Identification: Population Structure and Relationship Distinguishability
- Raf1 Is a DCAF for the Rik1 DDB1-Like Protein and Has Separable Roles in siRNA Generation and Chromatin Modification
- Loss of Function of the Cik1/Kar3 Motor Complex Results in Chromosomes with Syntelic Attachment That Are Sensed by the Tension Checkpoint
- Computational Prediction and Molecular Characterization of an Oomycete Effector and the Cognate Resistance Gene
- The Dynamics and Prognostic Potential of DNA Methylation Changes at Stem Cell Gene Loci in Women's Cancer
- GTPase Activity and Neuronal Toxicity of Parkinson's Disease–Associated LRRK2 Is Regulated by ArfGAP1
- Evaluation of the Role of Functional Constraints on the Integrity of an Ultraconserved Region in the Genus
- Neurophysiological Defects and Neuronal Gene Deregulation in Mutants
- Genetic and Functional Analyses of Mutations Suggest a Multiple Hit Model of Autism Spectrum Disorders
- Negative Supercoiling Creates Single-Stranded Patches of DNA That Are Substrates for AID–Mediated Mutagenesis
- Rewiring of PDZ Domain-Ligand Interaction Network Contributed to Eukaryotic Evolution
- The Eph Receptor Activates NCK and N-WASP, and Inhibits Ena/VASP to Regulate Growth Cone Dynamics during Axon Guidance
- Repression of a Potassium Channel by Nuclear Hormone Receptor and TGF-β Signaling Modulates Insulin Signaling in
- The Retrohoming of Linear Group II Intron RNAs in Occurs by Both DNA Ligase 4–Dependent and –Independent Mechanisms
- Cell Lineage Analysis of the Mammalian Female Germline
- Association of a Functional Variant in the Wnt Co-Receptor with Early Onset Ileal Crohn's Disease
- PLOS Genetics
- Archiv čísel
- Aktuální číslo
- Informace o časopisu
Nejčtenější v tomto čísle- Gene Expression and Stress Response Mediated by the Epigenetic Regulation of a Transposable Element Small RNA
- Contrasting Properties of Gene-Specific Regulatory, Coding, and Copy Number Mutations in : Frequency, Effects, and Dominance
- Homeobox Genes Critically Regulate Embryo Implantation by Controlling Paracrine Signaling between Uterine Stroma and Epithelium
- Nondisjunction of a Single Chromosome Leads to Breakage and Activation of DNA Damage Checkpoint in G2
Kurzy
Zvyšte si kvalifikaci online z pohodlí domova
Autoři: prof. MUDr. Vladimír Palička, CSc., Dr.h.c., doc. MUDr. Václav Vyskočil, Ph.D., MUDr. Petr Kasalický, CSc., MUDr. Jan Rosa, Ing. Pavel Havlík, Ing. Jan Adam, Hana Hejnová, DiS., Jana Křenková
Autoři: MUDr. Irena Krčmová, CSc.
Autoři: MDDr. Eleonóra Ivančová, PhD., MHA
Autoři: prof. MUDr. Eva Kubala Havrdová, DrSc.
Všechny kurzyPřihlášení#ADS_BOTTOM_SCRIPTS#Zapomenuté hesloZadejte e-mailovou adresu, se kterou jste vytvářel(a) účet, budou Vám na ni zaslány informace k nastavení nového hesla.
- Vzdělávání


