-
Články
Top novinky
Reklama- Vzdělávání
- Časopisy
Top články
Nové číslo
- Témata
Top novinky
Reklama- Kongresy
- Videa
- Podcasty
Nové podcasty
Reklama- Kariéra
Doporučené pozice
Reklama- Praxe
Top novinky
ReklamaMouse Genome-Wide Association Mapping Needs Linkage Analysis to Avoid False-Positive Loci
We carried out genome-wide association (GWA) studies in inbred mouse strains characterized for their lung tumor susceptibility phenotypes (spontaneous or urethane-induced) with panels of 12,959 (13K) or 138,793 (140K) single-nucleotide polymorphisms (SNPs). Above the statistical thresholds, we detected only SNP rs3681853 on Chromosome 5, two SNPs in the pulmonary adenoma susceptibility 1 (Pas1) locus, and SNP rs4174648 on Chromosome 16 for spontaneous tumor incidence, urethane-induced tumor incidence, and urethane-induced tumor multiplicity, respectively, with the 13K SNP panel, but only the Pas1 locus with the 140K SNP panel. Haplotype analysis carried out in the latter panel detected four additional loci. Loci reported in previous GWA studies failed to replicate. Genome-wide genetic linkage analysis in urethane-treated (BALB/c×C3H/He)F2, (BALB/c×SWR/J)F2, and (A/J×C3H/He)F2 mice showed that Pas1, but none of the other loci detected previously or herein by GWA, had a significant effect. The Lasc1 gene, identified by GWA as a functional element (Nat. Genet., 38 : 888–95, 2006), showed no genetic effects in the two independent intercross mouse populations containing both alleles, nor was it expressed in mouse normal lung or lung tumors. Our results indicate that GWA studies in mouse inbred strains can suffer a high rate of false-positive results and that such an approach should be used in conjunction with classical linkage mapping in genetic crosses.
Published in the journal: . PLoS Genet 5(1): e32767. doi:10.1371/journal.pgen.1000331
Category: Research Article
doi: https://doi.org/10.1371/journal.pgen.1000331Summary
We carried out genome-wide association (GWA) studies in inbred mouse strains characterized for their lung tumor susceptibility phenotypes (spontaneous or urethane-induced) with panels of 12,959 (13K) or 138,793 (140K) single-nucleotide polymorphisms (SNPs). Above the statistical thresholds, we detected only SNP rs3681853 on Chromosome 5, two SNPs in the pulmonary adenoma susceptibility 1 (Pas1) locus, and SNP rs4174648 on Chromosome 16 for spontaneous tumor incidence, urethane-induced tumor incidence, and urethane-induced tumor multiplicity, respectively, with the 13K SNP panel, but only the Pas1 locus with the 140K SNP panel. Haplotype analysis carried out in the latter panel detected four additional loci. Loci reported in previous GWA studies failed to replicate. Genome-wide genetic linkage analysis in urethane-treated (BALB/c×C3H/He)F2, (BALB/c×SWR/J)F2, and (A/J×C3H/He)F2 mice showed that Pas1, but none of the other loci detected previously or herein by GWA, had a significant effect. The Lasc1 gene, identified by GWA as a functional element (Nat. Genet., 38 : 888–95, 2006), showed no genetic effects in the two independent intercross mouse populations containing both alleles, nor was it expressed in mouse normal lung or lung tumors. Our results indicate that GWA studies in mouse inbred strains can suffer a high rate of false-positive results and that such an approach should be used in conjunction with classical linkage mapping in genetic crosses.
Introduction
Association studies are based on linkage disequilibrium (LD) between genetic markers and a disease locus affecting a particular phenotype [1],[2]. Such studies may allow the fine mapping of loci affecting monogenic diseases, as well as loci affecting complex diseases if the relevant alleles are common in the general population under investigation. This approach can be quite powerful when disease chromosomes are descended from a single founder mutation and the markers analyzed are tightly linked to the disease locus. In these cases, the LD approach has proven successful not only in humans for the fine mapping of rare diseases in isolated populations, but also in experimental animals. Indeed, our LD analysis in mouse inbred strains served in refining the mapping region of Pas1, the major locus affecting susceptibility to mouse lung tumorigenesis [3]. Subsequently, we found that the Pas1 locus consists of a conserved haplotype spanning ∼400 kb and including 6 genes, whose polymorphisms define a susceptibility allele that is frequent in laboratory mouse inbred strains and apparently derived from an ancestral progenitor [4]. More recently, we used LD analysis to show that the Pas1 locus affects not only carcinogen-induced lung tumor multiplicity, but also spontaneous lung tumor incidence [5].
The availability of single nucleotide polymorphism (SNP) data for many inbred strains has led to the proposal of in silico genome-wide mapping of mouse quantitative trait loci (QTLs) [6]. In three genome-wide association (GWA) studies aimed at detecting lung tumor modifier loci, 5 loci (named SLT loci) affecting incidence of spontaneous lung tumors [7], 4 loci (named Clas loci) affecting incidence of urethane-induced lung tumors [8], and 5 loci affecting incidence of N-nitroso-N-ethylurea-induced lung adenomas or adenocarcinomas [9] were identified. Each of these three reports detected a unique, non-overlapping set of loci, despite analysis of similar populations of mouse strains and highly correlated tumor phenotypes, i.e., spontaneous, urethane-, or N-nitroso-N-ethylurea-induced lung tumor incidences [5].
The identification of authentic lung tumor modifier loci in the population of mouse inbred strains is fundamental to revealing the genetic elements that control tumor susceptibility in this mammalian model. To assess the reproducibility and functional relevance of GWA results, we carried out this analysis using a larger number of mouse strains and more phenotypes describing the lung tumor susceptibility trait than in previous studies and compared the results with those obtained from standard genetic linkage analyses in intercross populations.
Results
GWAs Detect Putative Lung Tumor Modifier Loci
Strain susceptibility to lung tumorigenesis can be described using different phenotypes, such as tumor incidence, tumor multiplicity, and tumor volume. Mouse inbred strains show a wide range of lung tumor phenotypes, with mean spontaneous tumor incidence ranging from 0 to 82%, mean urethane-induced lung tumor incidence from 0 to 100%, and mean urethane-induced lung tumor multiplicity ranging from 0 to 28.3 tumors/mouse (Table 1). A highly significant correlation was found between the spontaneous tumor incidence and urethane-induced tumor multiplicity phenotypes (r = 0.94, −log P = 8.9), whereas correlation between the spontaneous tumor incidence and urethane-induced tumor incidence phenotypes was weaker (r = 0.76, −log P = 3.8) (Figure 1).
Fig. 1. Spontaneous lung tumor incidence correlates with both urethane-induced lung tumor multiplicity (green) and incidence (red) in mouse inbred strains. 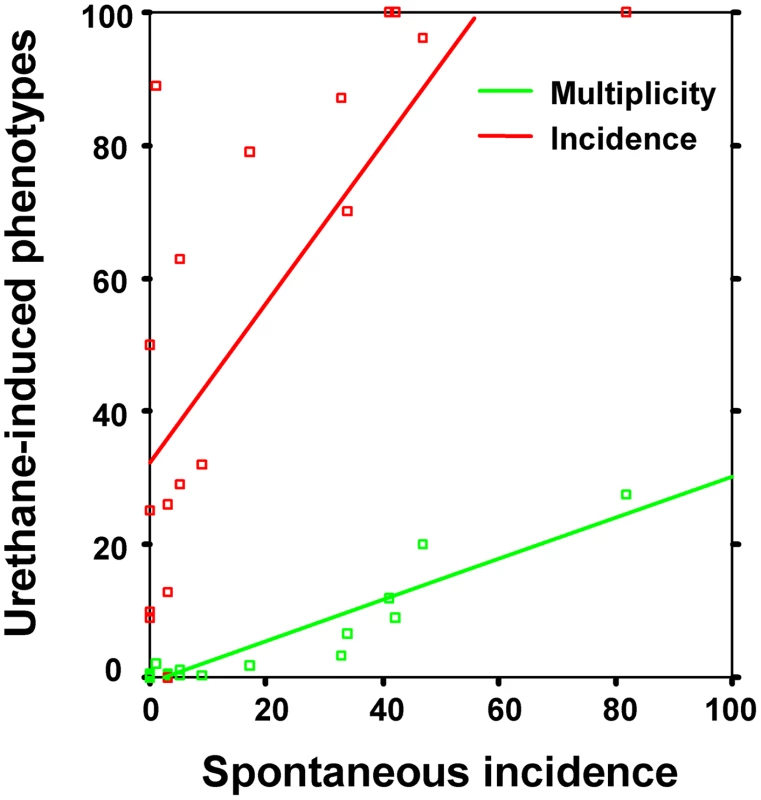
Incidence is given as mean percentages, whereas multiplicity is mean number of tumors/mouse. See Table 1 for phenotype values. Tab. 1. Lung tumor phenotypes (spontaneous and urethane-induced incidence and urethane-induced tumor multiplicity) of mouse inbred strains used in this study. 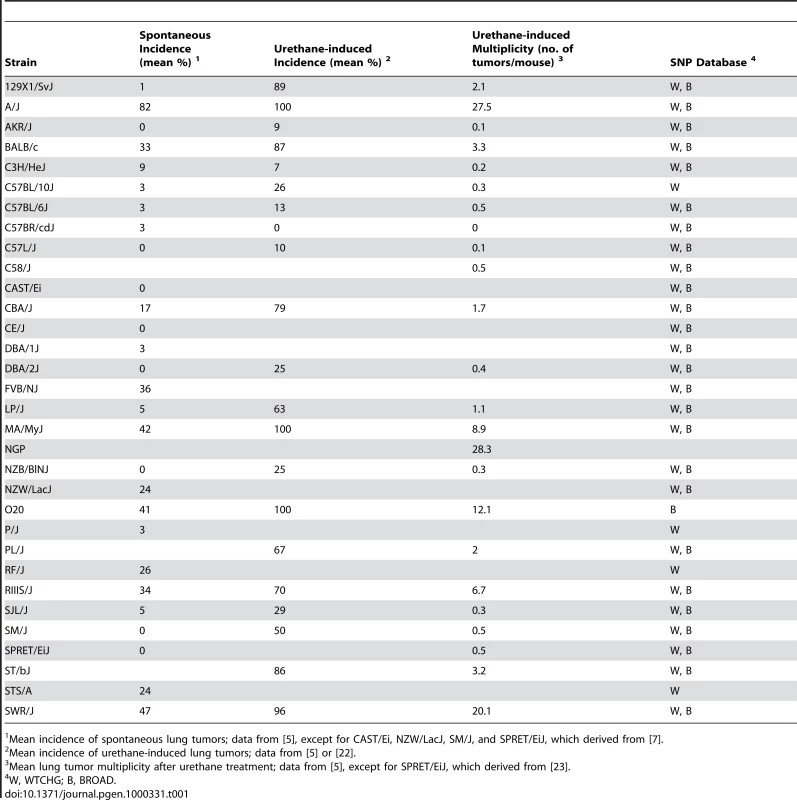
Mean incidence of spontaneous lung tumors; data from [5], except for CAST/Ei, NZW/LacJ, SM/J, and SPRET/EiJ, which derived from [7]. GWA using the WTCHG 13K SNP panel was carried out in 20 to 27 strains for which phenotype-genotype data were available (Table 1). For any of the lung tumor phenotypes, the Bonferroni's statistical threshold (α = 0.1 significance level) accounting for the number of statistical tests (i.e., 12,959) would result in a −log P value = 5.1. GWA analyses revealed that only rs3681853 on Chromosome 5 reached this statistical threshold for spontaneous tumor incidence, whereas no SNPs were associated with urethane-induced tumor incidence and only one SNP (rs4174648) on Chromosome 16 was associated with urethane-induced tumor multiplicity. Surprisingly, the known Pas1 locus was not detected. Using the suggestive thresholds obtained by permutation tests (α = 0.10, Table 2), which also account for the correlation structure of the data, we detected only SNP rs3681853 on Chromosome 5, (−log P = 5.3, spontaneous incidence, SLT6), SNPs rs13459098 and rs13479086 in the Pas1 region (both SNPs at −log P = 4.7, urethane-induced tumor incidence, Clas1) and SNP rs4174648 on Chromosome 16 (−log P = 6.5, urethane-induced tumor multiplicity, Clas5) (Table 3). When Mus spretus was excluded from the analysis, rs3681853 did not reach any statistical thresholds and the other results remained the same.
Tab. 2. Threshold probabilities (expressed as −log P) corresponding to experiment-wide type I risk errors α = 0.05 and α = 0.10. 
Tab. 3. Putative lung tumor modifier loci identified by previous genome-wide association studies or by the present study using the WTCHG SNP panel. 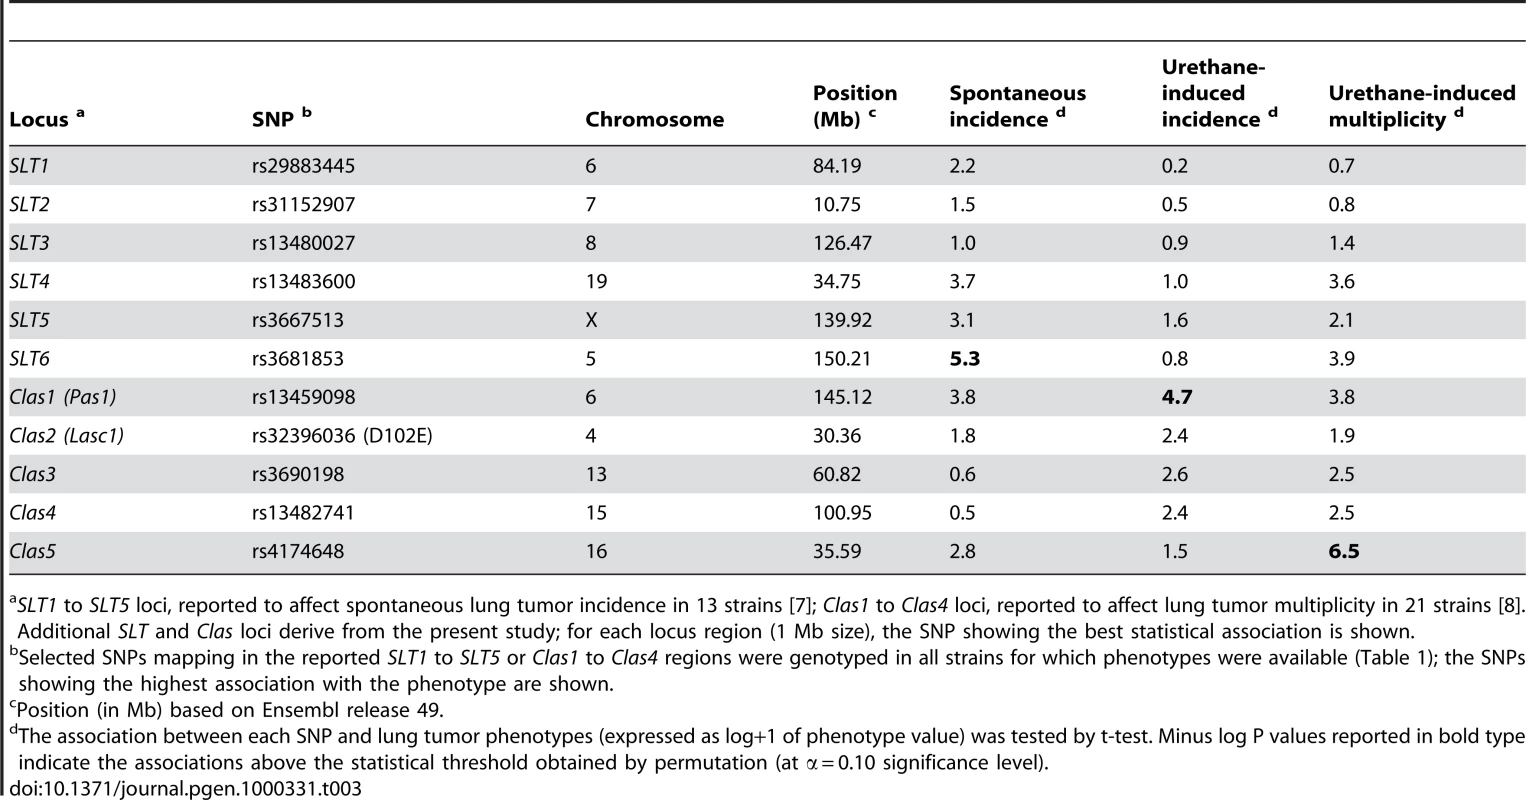
SLT1 to SLT5 loci, reported to affect spontaneous lung tumor incidence in 13 strains [7]; Clas1 to Clas4 loci, reported to affect lung tumor multiplicity in 21 strains [8]. Additional SLT and Clas loci derive from the present study; for each locus region (1 Mb size), the SNP showing the best statistical association is shown. Due to the low sensitivity of detection of putative loci based on statistical thresholds, as demonstrated by the significant association of the known Pas1 locus with only one of three lung tumor phenotypes, we also examined putative loci whose associations were below the statistical thresholds. For example, at −log P≥4, 10 and 11 SNPs showed significant association with spontaneous incidence (SLT loci) and urethane-induced multiplicity (Clas loci), respectively, of lung tumors. No other SNPs above −log P = 4, except the two Pas1-associated SNPs at −log P = 4.7, were detected for the phenotype “incidence of urethane-induced lung tumors.” By attributing a locus definition to chromosomal regions spanning less than 1 Mb in length and containing one or more SNPs associated with lung tumor phenotypes, these associations identified 8 new SLT loci that included Pas1, the previous Clas1 (Pas1), and 5 new Clas loci (not shown).
We then replicated the GWA using the BROAD SNP panel, which provided a higher SNP density (140K) but a lower number of strains (i.e., 20 to 23) (Table 1). To reduce the risk of false-positives due to the inclusion of genetically distant strains, we excluded the Mus spretus strain (SPRET/EiJ). Above the suggestive thresholds (α = 0.10, Table 2), we detected only SNPs rs30118733 and rs30752783 (−log P = 7.5 and 6.9, respectively, urethane-induced incidence), both of which were located in the Pas1 region. SLT1 to SLT6 and Clas2 to Clas5 were not confirmed by analysis using the BROAD SNP panel, although SLT6 and Clas5 were detected by the WTCHG SNP panel (Table 3).
Finally, our haplotype-based GWA analysis using the BROAD dataset and a three-SNP sliding window revealed haplotype-associated lung tumor (Halt) loci (Table 4, Figure 2). For spontaneous lung tumor incidence, no haplotype reached statistical threshold (α = 0.10, Table 2), whereas for urethane-induced lung tumor incidence, two associated haplotypes were detected: Halt1 in the Pas1 region and Halt2 on Chromosome 14 (Table 4). Associated to the urethane-induced tumor multiplicity phenotype, we detected five statistically significant haplotypes (Halt3 - Halt7), two of which mapped in the Pas1 locus (Halt5) or in its flanking region (Halt6) (Table 4).
Fig. 2. Genome wide scans for haplotype association with urethane-induced lung tumor multiplicity in mouse inbred strains using F-test for window size of 3 SNPs against the marker map plot. 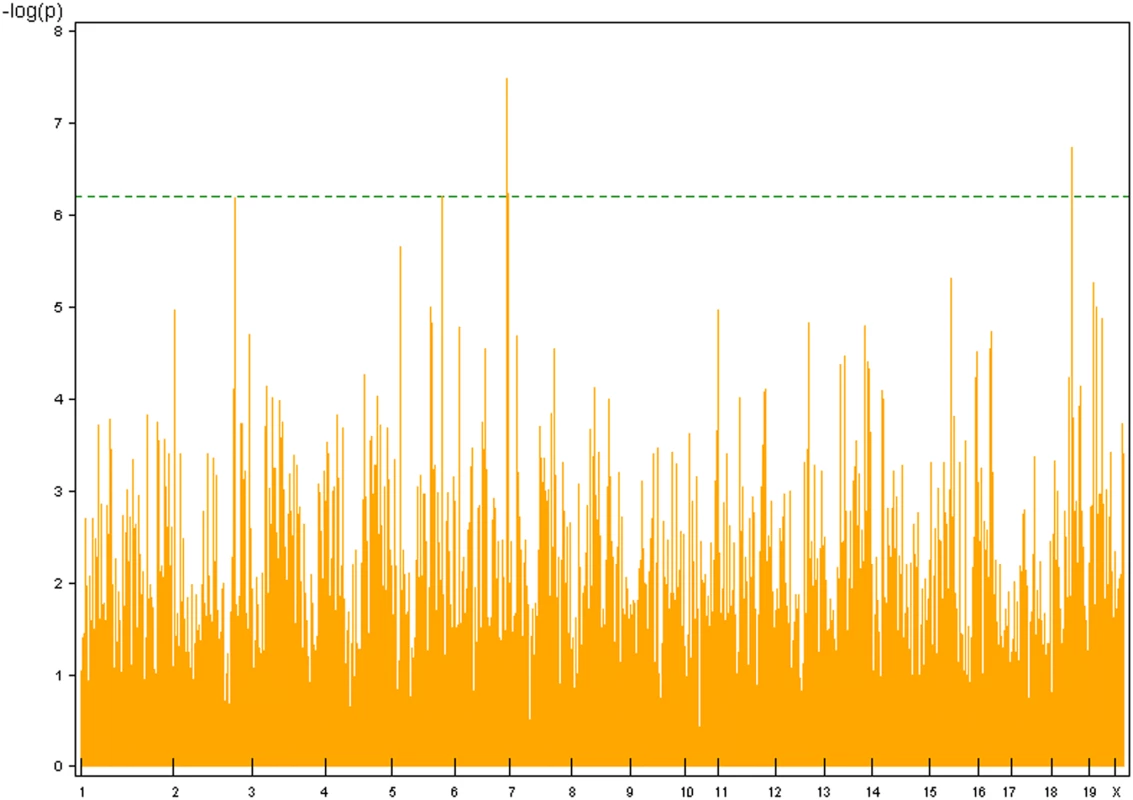
Threshold (in dotted green line) p value (α = 0.10) was calculated according to Bonferroni's criterion. Tab. 4. Haplotype-associated lung tumor modifier (Halt) loci identified by haplotype analysis, using the 140K BROAD SNP panel. 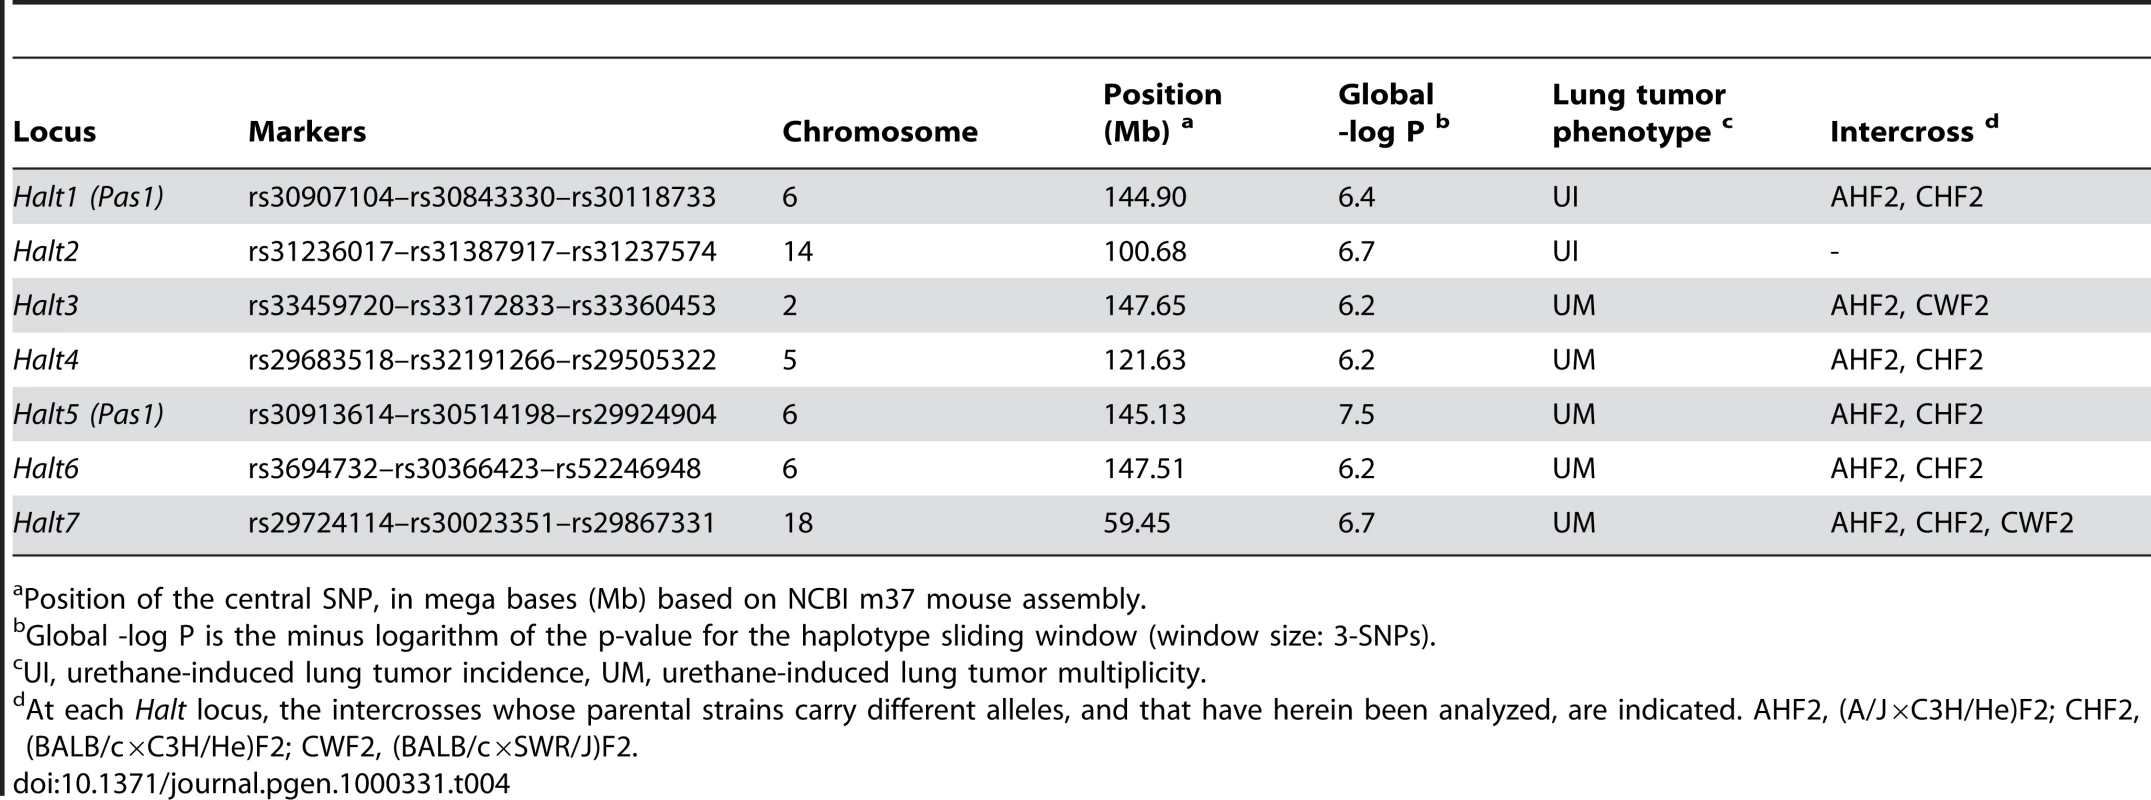
Position of the central SNP, in mega bases (Mb) based on NCBI m37 mouse assembly. Results of GWA Studies Fail to Replicate
A previous GWA study in 13 inbred strains detected 5 loci, named SLT1 to SLT5, associated with spontaneous incidence of lung tumors [7]. Our analysis in 27 strains contained 12, 4, 10, 11, and 19 SNPs in the SLT1 to SLT5 regions, respectively. However, none of the SLT loci were confirmed in our GWA analysis (Table 3). To rule out the possibility that the non-replication of previous results [7] was due to the lack of inclusion of relevant SNPs in the SNP database used, we identified and selected SNPs in the same SLT regions showing exactly the same 13 strain distribution pattern reported [7] and genotyped the selected SNPs in the 27 strains of our study (Table 1) plus the O20/A strain [5]. However, none of the SNPs located in SLT1 (rs13478866), SLT2 (rs13479117), SLT3 (Galnt2 JC10664_20, Agt JC10667_5, Agt JC10669_3), SLT4 (rs13483600), and SLT5 (rs3667513) confirmed an association with spontaneous lung tumor incidence (not shown) and none of the SLT loci showed an association with urethane-induced lung tumor incidence or multiplicity (Table 3).
We also tested whether previous GWA results on lung tumor multiplicity [8] might be confirmed in our study. Unlike the spontaneous incidence data, the sizes of the two datasets on lung tumor multiplicity are almost identical (n = 21–22) [8], with very similar strain composition (Table 1 and [8]). Differences included two BALB/c substrains and the O20/A strain analyzed in [8], whereas we analyzed only one BALB/c substrain and did not include the O20/A strain but did include the C58/J and the NZB/BlGd strains not analyzed in [8]. Overall, we expected to observe essentially overlapping results. Using the WTCHG 13K SNP panel, we confirmed the association at the Pas1 locus, with 2 SNPs showing P values above the statistical threshold for the tumor incidence phenotype (Table 3). At the Clas2 locus on Chromosome 4, (CEL-4_30653207, alias rs27801920), [8], we found a −log P = 2.8. Genotyping at this locus in the strains of the genome-wide scan plus the NGP/N and O20/A strains for the functional Lasc1 SNP D102E (rs32396036) revealed no significant associations with lung tumor phenotypes (−log P = 1.8 to 2.4). Furthermore, we detected no significant associations at the Clas3 and Clas4 regions (Table 3), despite the inclusion of 6 and 9 SNPs in the Clas3 and Clas4 regions, respectively. Even the higher SNP density offered by the BROAD SNP panel failed to reveal any Clas loci except Pas1 (Clas1).
Another recent GWA study conducted in 20 inbred strains treated with N-nitroso-N-ethylurea and scanned with the WTCHG SNP database detected several putative lung tumor susceptibility loci on Chromosomes 3, 6, 9, and 15 [9]; these loci did not correspond to Clas loci or to regions detected in the present study. Authors of [9] did not detect the Pas1 locus, which has been implicated in lung tumorigenesis independently of the type of chemical carcinogen [5]. In contrast with the GWA results, the Pas1 locus but none of the GWA loci was detected in a genetic linkage study that used the same carcinogen as in the GWA study, i.e., N-nitroso-N-ethylurea [10]. We observed no association with any lung tumor phenotype at any of the loci reported in [9], using either the WTCHG or the BROAD SNP panel.
Loci Detected by Strain Survey Are Not Confirmed by Genetic Linkage Studies
Genetic linkage analysis of mouse crosses represents a formal approach to demonstrating functional activity of genetic loci on given phenotypes. In a single cross, not all loci affecting a specific complex phenotype in a given species are expected to be detected, since a locus can exert allele-specific effects only in crosses originating from two strains carrying different alleles and cannot be detected if the functional element(s) is non-polymorphic in the two parental strains. Accordingly, the Pas1 locus is easily detected in crosses between strains carrying either of the two Pas1 alleles (or haplotypes) but is not detectable in crosses between strains carrying the same haplotype [11],[12].
To test whether loci detected by genome-wide strain survey may be involved in modulating lung tumorigenesis, we carried out genome-wide genetic linkage analyses of three intercross populations previously analyzed for urethane-induced lung tumor multiplicity [11]–[13]. In our population of (BALB/c×C3H/He)F2 mice, genotyping by SNP array detected a total of 383 non-redundant informative SNPs widely dispersed over the whole mouse genome. There was complete coverage of all chromosomes, with a range of 12–43 non-redundant SNPs genotyped for each chromosome, except for Chromosome 9 which contained only 4 SNPs. Above the R/qtl threshold, only the effect of the Pas1 locus was observed, with LOD scores of 18.4 (Figure 3A, red line). By conditioning on the Pas1 genotype, no additional QTLs were detected (Figure 3A, black line). In (A/J×C3H/He)F2 mice, 192 markers ensured genome-wide coverage, and composite interval mapping scan detected the known Pas1 locus and no other locus (Figure 3B, red line), even by a separate conditioning for the Pas1 genotype (Figure 3B, black line). Analysis of the (BALB/c×SWR/J)F2 population by composite interval mapping scan confirmed the reported Chromosomes 4 (Papg1), 6 (Par4), and 18 (Par2) loci and detected an additional locus (LOD score = 5.3) on Chromosome 1 between D1Mit18 and D1Mit22 markers (not shown).
Fig. 3. Genome-wide genetic linkage analysis of loci affecting urethane-induced lung tumor multiplicity. 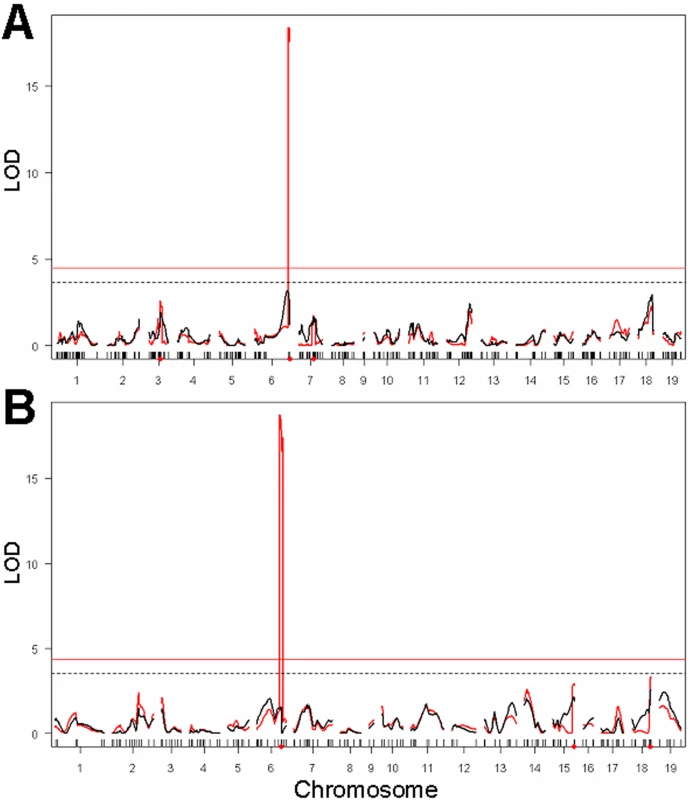
(A) (BALB/c×C3H/He)F2 cross detects the Pas1 locus at LOD score = 18.4. (B) (A/J×C3H/He)F2 cross detected the Pas1 locus at LOD score = 18.7. Red curves indicate the results of the composite interval mapping, whereas black curves indicate the results of genome scan using the Kras genotype as covariate (conditioning on the Pas1 alleles). Horizontal lines indicate the threshold values (α = 0.05) of the LOD score. The Clas2 locus (Chromosome 4) showed no significant linkage, despite the presence of the claimed functional polymorphism (D102E) in both crosses. No other locus detected by whole-genome strain survey showed significant linkage. Thus, none of the loci except Pas1 identified by previous or the present (Table 3) genome-wide strain survey were confirmed by genetic linkage analysis (Figure 3), although either the same or flanking SNPs detected by GWA at SLT1 to SLT6 loci and at Clas1 (Pas1) to Clas5 loci were, in fact, polymorphic in at least one of our three intercross populations.
Note that the Clas2 locus showed no effect in the (BALB/c×C3H/He)F2 cross, as indicated by the absence of any significant linkage of the whole Chromosome 4 (covered by 19 SNPs) to any lung tumor phenotype (Figure 3 and not shown). Moreover, since the claimed functional D102E polymorphism of the Lasc1 gene defining the Clas2 locus [8] was present in the (BALB/c×C3H/He)F2 cross, we genotyped that polymorphism; no significant linkage with lung tumor multiplicity was found at α = 0.10 significance level.
Further testing of the D102E polymorphism by genotyping in the (A/J×C3H/He)F2 cross (total of 163 mice) [13], which also carries the polymorphism, again revealed no significant associations with either lung tumor multiplicity or volume (Figure 3B).
With regard to the loci detected by haplotype analysis, none but those linked with the Pas1 locus were confirmed by genetic linkage analysis. Except for the Halt2 locus on Chromosome 14, which could not be detected since all four parental strains of our genetic crosses carried the same haplotype, all other Halt loci could be detected in at least one of the intercrosses that displayed informative haplotypes (Table 4). In the (BALB/c×SWR/J)F2 intercross, a significant linkage was found in the pulmonary adenoma resistance 2 (Par2) locus [12], with peak LOD score = 15.5 at D18Mit33, located at about 10 Mb distal from the Halt7 locus; no linkage near the Halt7 locus was found in the two other informative crosses (Table 4).
Absence of Lasc1 mRNA Expression in Mouse Lung
Notwithstanding the lack of significant linkage of the Lasc1 gene in two independent crosses, we examined Lasc1 mRNA expression in mouse normal lung and lung tumors. RT-PCR analysis of normal lung tissue from A/J and C57BL/6J mice, which carry different alleles of this gene, and of normal lung and tumor tissue from (A/J×C57BL/6J)F1 mice revealed no Lasc1-specific transcript fragments in either normal or tumor lung tissue, whereas genomic DNA was clearly amplified (Figure 4, top) and the Itpr2 or Gapdh positive controls were readily detected in cDNA samples (Figure 4, bottom and data not shown). In light of the reported widespread expression of Lasc1 [8], we examined Lasc1 mRNA expression in brain, liver, kidney, spleen, and testis of adult mice; only testis from which the AK076999 clone was originally derived revealed detectable Lasc1 mRNA (not shown).
Fig. 4. Absence of Lasc1 gene expression in mouse normal lung and lung tumors of (A/J×C57BL/6J)F1 mice. 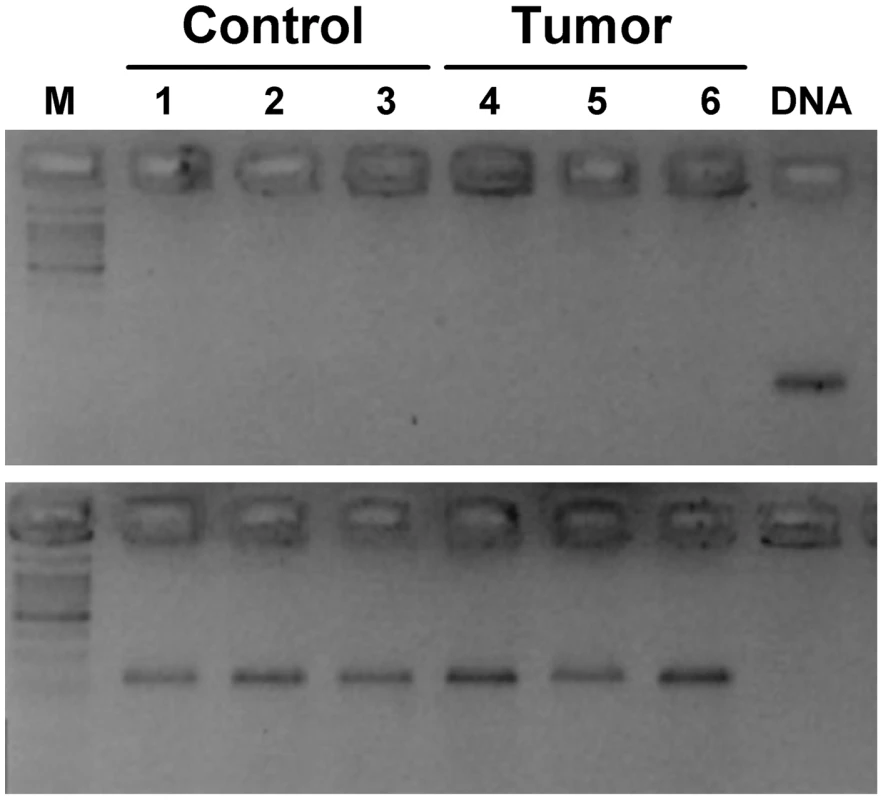
The ethidium bromide-stained gel shows the RT-PCR results: lanes 1–3, normal lung derived from adult mice; lanes 4–6, lung tumors derived from urethane-treated mice; lane M, DNA size marker; lane DNA, genomic DNA. Only genomic DNA (top panel) and the Itpr2 housekeeping gene (bottom panel) were amplified. Discussion
We found a highly significant correlation (r = 0.94) between the phenotypes of spontaneous incidence and carcinogen-induced multiplicity of mouse lung tumors (Figure 1). Although we cannot exclude the possibility that part of this correlation rests in population structure, the result suggests that the genetic control of both phenotypes resides mainly in the same genetic loci. The high correlation between the two phenotypes may be explained by the Pas1 locus and its strong effects on both phenotypes, i.e., odds ratios of ∼12 and ∼15 with spontaneous and chemically induced lung tumorigenesis, respectively [5]. At present, it is not known whether additional lung tumor modifier loci can control both phenotypes. Proof that the same genetic elements control both spontaneous and chemically induced lung tumorigenesis in the mouse model could have important implications for other species, including humans, and therefore warrants further study.
The design of the present GWA study was similar to that of two previous studies carried out for either spontaneous [7] or urethane-induced incidence of lung tumors [8], although we had the opportunity to analyze a larger number of mouse strains. Indeed, in the spontaneous tumorigenesis association, we analyzed 27 strains with 13K SNPs (WTCHG) and 23 strains with 140K SNPs (BROAD) versus 13 strains with ∼135,900 SNPs [7]. In the analysis of urethane-induced lung tumorigenesis, we analyzed 20–22 (WTCHG and BROAD) strains for tumor multiplicity and incidence (Table 1), respectively, versus an effective number of 19 strains with ∼123,000 SNPs in [8], where the two BALB/c substrains should count as a single strain because of their overlapping phenotypes and genotypes, and where lack of available genotype data from the Broad Institute for the C57BL/10J strain allowed analysis only with the 13K WTCHG panel of SNPs.
The power to detect genotype-phenotype associations depends on the genomic length over which LD between functional and marker polymorphisms extends. Since LD decays with distance, a high-density map provides better resolution power than a low-density map. However, the haplotype structure of mouse inbred strains shows a mosaic pattern [14], and haplotype segments ranging from 12 to 608 kb in length have been reported [15]. Those findings suggest that even a medium-density map is sufficient to detect QTLs, especially considering the limited pool of founder genomes of the mouse laboratory strains and their consequent relatedness [16]. Indeed, our use of the BROAD high-density SNP panel (∼20 kb per SNP) confirmed the Pas1 detection but not the SLT6 and Clas5 loci detected by the medium-density WTCHG SNP panel (average density of ∼160 kb per SNP). On the other hand, the power of QTL detection decreases as strain number decreases, and it has been proposed that there is little rationale supporting analysis of complex traits using less than 30 strains [17]. For comparisons, population-based association studies in humans require several hundreds or thousands of individuals, and confirmation of the results is also required [18].
We confirmed none of the 5 SLT loci detected in previous GWA studies. The previous association study on the urethane-induced lung tumor incidence phenotype detected 4 loci (Clas1 to Clas4) [8], none of which overlap with any of the SLT loci identified by the same group in another study [7]. Using the same phenotype, we confirmed the Pas1 locus (also called Clas1 in [8]), with 2 SNPs in both the WTCHG (rs13459098 in the Casc1 gene and rs13479086 in the genomic region between Kras and Ifltd1 genes) and the BROAD panel (rs30118733 at 5′-end of the Pas1 haplotype and rs30752783 near the Ifltd1 gene) showing statistical associations. However, the Clas2 to Clas4 loci were not confirmed; genotyping of the functional Clas2 element (D102E, rs32396036) in all strains for which phenotype data were available revealed a −log P = 2.4 for urethane-induced lung tumor incidence and a lower statistical association for the other tumor phenotypes (Table 3).
The discrepancy regarding Clas2 to Clas4 detection in our study and that of [8] may rest in small differences in strain composition. The reported functional D102E polymorphism at the Lasc1 gene (Clas2 locus) may represent either a locus with a very weak effect or a false-positive finding, since no significant linkage was detectable in either (BALB/c×C3H/He)F2 or (A/J×C3H/He)F2 intercrosses carrying that polymorphism, and no Lasc1 transcript was detectable in normal lung tissue, in lung tumors, or in several mouse organs, except testis, despite its reported widespread expression [8]. Thus, the reported allele-specific effects by in vitro-transfected expression vectors containing either the 102D or 102E Lasc1 allele (whose cDNA is contained in a single exon; Vega gene OTTMUSG00000004898, http://vega.sanger.ac.uk/index.html) cannot constitute evidence of a locus effect in the absence of such evidence by genetic linkage studies.
Haplotype analysis did not increase the reliability of GWA in comparison with single-point analysis, since the Halt loci detected by haplotype analysis, with the exception of those linked to Pas1, were not confirmed by genetic linkage studies despite the haplotype differences between the parental strains originating the crosses. The Halt7 locus might also represent a false-positive association, since significant genetic linkage near the Halt7 locus position was detected in only one of three informative intercrosses, and since the mapping position of Halt7 is ∼10 Mb apart from the LOD score peak defining the Par2 locus (69.83 Mb) [12] and its candidate gene Poli (70.67 Mb) [19].
Overall, our comparison of the results of GWA studies in inbred strains with the genetic linkage analysis results confirmed none of the putative loci identified by strain survey, except the Pas1 locus (Figure 3), notwithstanding the polymorphism of several loci in the genetic cross examined. Comparison of our GWA results with those of previous studies indicates a high variability of the statistical thresholds obtained by permutation. This is expected, since the thresholds are influenced by the number of SNPs and of strains, by the correlation structure of the data, and by the distribution of the phenotypes under study. Thus, inclusion or exclusion of even a single strain in a 20-strain study would strongly affect the statistical thresholds and the loci detected. Our study raises concern about the ability of GWA studies to detect authentic QTL loci and provides a note of caution to the mouse genetics field, where GWAs are seeing wide application across many phenotypes. In agreement with previous studies [17],[20], our results support the notion that association mapping in the population of inbred mouse strains is characterized by a high false-positive rate and that such a method must be carried out with a large number of strains (i.e., 40 to 150). Accordingly, extensive computer simulation analyses have shown that the power of GWAs studies is low for phenotypes controlled by polygenic traits and that spurious associations are expected [21]. Thus, GWA studies should be carried out in conjunction with genetic linkage analysis to detect relevant loci.
Materials and Methods
Mouse Phenotypes, DNAs, and RNAs
Table 1 lists the data for 32 mouse inbred strains on spontaneous lung tumor incidence (n = 28), urethane-induced lung tumor multiplicity, i.e., number of tumors/mouse (n = 24), and urethane-induced lung tumor incidence (n = 21) derived from [5],[7],[22],[23]. Genomic DNAs from the same inbred strains were obtained from The Jackson Laboratory Mouse DNA Resource (Bar Harbor, ME, USA). Intercross populations consisted of (BALB/cJ×C3H/HeJ)F2 mice (n = 182 males) [11], (A/J×C3H/He)F2 (n = 87 males and 87 females) [13], and (BALB/c×SWR/J)F2 mice (n = 106 males and 112 females) [12]; all three populations had been treated with a single dose of urethane, observed without any further treatment, and evaluated quantitatively for lung tumor multiplicity phenotype. RNA was extracted from normal lung of adult male A/J, C57BL/6J, and (A/J×C57BL/6J)F1 mice, from urethane-induced lung tumors of (A/J×C57BL/6J)F1 mice [4], and from brain, liver, kidney, spleen, and testis of a male SM/J adult mouse, using the NucleoSpin RNA II kit (Macherey-Nagel, Bethlehem, PA, USA).
SNP Genotype Extraction, Genome-Wide Scan, and SNP Genotyping
Genotypes of 12,959 and 138,793 SNPs publicly available at Wellcome Trust Centre for Human Genetics (WTCHG) (http://www.well.ox.ac.uk/mouse/INBREDS/) and at Broad Institute (http://www.broad.mit.edu/), respectively, were extracted. Table 1 lists the strains for which WTCHG or BROAD genotypes are available. Genomic DNAs of (BALB/cJ×C3H/HeJ)F2 mice were genotyped using Illumina SNP genotyping technology which allows the simultaneous analysis of 1536 SNPs [24]. Genomic DNAs of (A/J×C3H/He)F2 mice were genotyped using MassARRAY (Sequenom, Inc., San Diego, CA) with a multiplex PCR assays (iPLEX) designed by Sequenom SpectroDESIGNER software. The extension products were spotted onto a 384-well spectroCHIP before analysis by MALDI-TOF mass spectrometry. Selected SNPs were genotyped in mouse inbred strains by pyrosequencing on a PSQ96MA system (Biotage AB, Uppsala, Sweden). A short fragment containing the SNP was PCR-amplified using a biotinylated primer as one of the two PCR primers and pyrosequenced according to the manufacturer's instructions.
Lasc1 Expression Analysis
Lasc1 mRNA was searched by RT-PCR using primers: 5′-tactcactggtggtcctaagatcg-3′ and 5′-aggaaaaatggcccttccg-3′; which flank the reported D102E polymorphism of the AK076999 cDNA sequence and, according to the Lasc1 gene structure (Vega gene OTTMUSG00000004898, http://vega.sanger.ac.uk/index.html), are located in the same exon. The Itpr2 (5′-tgatggacaccaagctgaag-3′ and 5′-cgaacattgtttctgcctga-3′) and Gapdh (5′-tgttcctacccccaatgtgt-3′ and 5′-gtggaagagtgggagttgct-3′) genes served as positive controls. Normal lung tissue from 3 A/J, 3 C57BL/6J, and 3 (A/J×C57BL/6J)F1 mice and lung tumors from 3 urethane-treated (A/J×C57BL/6J)F1 mice were used, as well as brain, liver, kidney, spleen, and testis of a male SM/J mouse.
Statistical Analysis
The association between spontaneous and urethane-induced lung tumor phenotypes (mean percentages or mean multiplicities) was expressed as a correlation coefficient. The association between each SNP and lung tumor phenotypes (expressed as log+1 of phenotype value) was tested by t-test. Haplotype analysis was carried out according to [25], using a sliding window approach (window size of 3 SNPs) and the BROAD dataset. The association between each haplotype and lung tumor phenotypes (expressed as log+1 of phenotype value) was tested by F-test. To control the genome-wide false-positive fraction (12,959 and 138,793 t-tests for databases WTCHG and BROAD), statistical thresholds were computed both in accordance with the Bonferroni principle and with a permutation test (20,000 permutations). In particular, the distribution of the 20,000 smallest p-values among the 12,959 (or 138,793) p-values under the null hypothesis was obtained. This approach implicitly uses the correlation structure of the data [26]. The 5th and 10th centile of the reference distribution of the smallest p-values were used to guarantee a 0.05 or 0.10 overall false-positive fraction.
Genome-wide genetic linkage was carried out by interval mapping using R/qtl [27]. Marker order and position on chromosomes were established by multipoint analysis of the data using the MAPMAKER/EXP program [28]. Genetic distances were computed using Haldane's mapping function. Single-locus genome scans were carried out using the ‘scanone’ function of R/qtl (http://www.biostat.jhsph.edu/̃kbroman/qtl/) using the Haley-Knott regression analysis. To increase the power to detect weak QTLs and to condition on the presence of the Pas1 genotype, a composite interval mapping was carried out using the three most significant markers identified by a stepwise regression as covariates [29]. In addition, the Kras2 genotype was used as a covariate in a single-locus genome scan of (A/J×C3H/He)F2 and (BALB/c×C3H/He)F2 intercross populations. Genome-wide significance thresholds (α = 0.05) were generated through permutation tests (10,000 permutations) as described [30].
Zdroje
1. ChapmanNH
ThompsonEA
2001 Linkage disequilibrium mapping: the role of population history, size, and structure. Adv Genet 42 413 437
2. AbecasisGR
GhoshD
NicholsTE
2005 Linkage disequilibrium: ancient history drives the new genetics. Hum Hered 59 118 124
3. ManentiG
StaffordA
De GregorioL
GariboldiM
FalvellaFS
1999 Linkage disequilibrium and physical mapping of Pas1 in mice. Genome Res 9 639 646
4. ManentiG
GalbiatiF
Giannì-BarreraR
PettinicchioA
AcevedoA
2004 Haplotype sharing suggests that a genomic segment containing six genes accounts for the pulmonary adenoma susceptibility 1 (Pas1) locus activity in mice. Oncogene 23 4495 4504
5. ManentiG
DraganiTA
2005 Pas1 haplotype-dependent genetic predisposition to lung tumorigenesis in rodents: a meta-analysis. Carcinogenesis 26 875 882
6. GrupeA
GermerS
UsukaJ
AudD
BelknapJK
2001 In silico mapping of complex disease-related traits in mice. Science 292 1915 1918
7. WangD
YouM
2005 Five loci, SLT1 to SLT5, controlling the susceptibility to spontaneously occurring lung cancer in mice. Cancer Res 65 8158 8165
8. LiuP
WangY
VikisH
MaciagA
WangD
2006 Candidate lung tumor susceptibility genes identified through whole-genome association analyses in inbred mice. Nat Genet 38 888 895
9. FenskeTS
McMahonC
EdwinD
JarvisJC
CheverudJM
2006 Identification of candidate alkylator-induced cancer susceptibility genes by whole genome scanning in mice. Cancer Res 66 5029 5038
10. DevereuxTR
WisemanRW
KaplanN
GarrenS
FoleyJF
1994 Assignment of a locus for mouse lung tumor susceptibility to proximal chromosome 19. Mamm Genome 5 749 755
11. ManentiG
GariboldiM
FiorinoA
ZeddaAI
PierottiMA
1997 Pas1 is a common lung cancer susceptibility locus in three mouse strains. Mamm Genome 8 801 809
12. ManentiG
GariboldiM
FiorinoA
ZanesiN
PierottiMA
1997 Genetic mapping of lung cancer modifier loci specifically affecting tumor initiation and progression. Cancer Res 57 4164 4166
13. GariboldiM
ManentiG
CanzianF
FalvellaFS
RadiceMT
1993 A major susceptibility locus to murine lung carcinogenesis maps on chromosome 6. Nature Genet 3 132 136
14. WadeCM
KulbokasEJIII
KirbyAW
ZodyMC
MullikinJC
2002 The mosaic structure of variation in the laboratory mouse genome. Nature 420 574 578
15. FrazerKA
WadeCM
HindsDA
PatilN
CoxDR
2004 Segmental phylogenetic relationships of inbred mouse strains revealed by fine-scale analysis of sequence variation across 4.6 mb of mouse genome. Genome Res 14 1493 1500
16. YangH
BellTA
ChurchillGA
Pardo-Manueld
V
2007 On the subspecific origin of the laboratory mouse. Nat Genet 39 1100 1107
17. CervinoAC
DarvasiA
FallahiM
MaderCC
TsinoremasNF
2007 An integrated in silico gene mapping strategy in inbred mice. Genetics 175 321 333
18. VielandVJ
2001 The replication requirement. Nat Genet 29 244 245
19. LeeGH
NishimoriH
SasakiY
MatsushitaH
KitagawaT
2003 Analysis of lung tumorigenesis in chimeric mice indicates the Pulmonary adenoma resistance 2 (Par2) locus to operate in the tumor-initiation stage in a cell-autonomous manner: detection of polymorphisms in the Poli gene as a candidate for Par2. Oncogene 22 2374 2382
20. DarvasiA
2001 In silico mapping of mouse quantitative trait loci. Science 294 2423
21. PayseurBA
PlaceM
2007 Prospects for association mapping in classical inbred mouse strains. Genetics 175 1999 2008
22. MalkinsonAM
1989 The genetic basis of susceptibility to lung tumors in mice. Toxicology 54 241 271
23. ToMD
Perez-LosadaJ
MaoJH
HsuJ
JacksT
2006 A functional switch from lung cancer resistance to susceptibility at the Pas1 locus in Kras2LA2 mice. Nat Genet 38 926 930
24. ShenR
FanJB
CampbellD
ChangW
ChenJ
2005 High-throughput SNP genotyping on universal bead arrays. Mutat Res 573 70 82
25. ZaykinDV
WestfallPH
YoungSS
KarnoubMA
WagnerMJ
2002 Testing association of statistically inferred haplotypes with discrete and continuous traits in samples of unrelated individuals. Hum Hered 53 79 91
26. SimonRM
KornEL
McShaneLM
RadmacherMD
WrightGM
2004 Design and analysis of DNA microarray investigations New York Springer-Verlag 80
27. BromanKW
WuH
SenS
ChurchillGA
2003 R/qtl: QTL mapping in experimental crosses. Bioinformatics 19 889 890
28. LincolnSE
DalyM
LanderES
1992 Constructing genetic maps with MAPMAKER/EXP. 3.0. Whitehead Institute Technical Report
29. ZengZ-B
1994 Precision mapping of quantitative trait loci. Genetics 136 1457 1468
30. SenS
ChurchillGA
2001 A statistical framework for quantitative trait mapping. Genetics 159 371 387
Štítky
Genetika Reprodukční medicína
Článek vyšel v časopisePLOS Genetics
Nejčtenější tento týden
2009 Číslo 1- Akutní intermitentní porfyrie
- Farmakogenetické testování pomáhá předcházet nežádoucím efektům léčiv
- Růst a vývoj dětí narozených pomocí IVF
- IVF a rakovina prsu – zvyšují hormony riziko vzniku rakoviny?
- Pilotní studie: stres a úzkost v průběhu IVF cyklu
-
Všechny články tohoto čísla
- Order and Disorder during Divergence
- Converging on the Origins of Axonal Ion Channel Clustering
- Mouse Genome-Wide Association Mapping Needs Linkage Analysis to Avoid False-Positive Loci
- Why Is the Correlation between Gene Importance and Gene Evolutionary Rate So Weak?
- A Microhomology-Mediated Break-Induced Replication Model for the Origin of Human Copy Number Variation
- A Novel Role for in the Parallel Evolution of Depigmentation in Independent Populations of the Cavefish
- Copy Number Variation and the Co-Evolution of Primate and Viral Genomes
- Multiple Chromosomal Rearrangements Structured the Ancestral Vertebrate -Bearing Protochromosomes
- A -Acting Diversification Activator Both Necessary and Sufficient for AID-Mediated Hypermutation
- PLOS Genetics
- Archiv čísel
- Aktuální číslo
- Informace o časopisu
Nejčtenější v tomto čísle- A -Acting Diversification Activator Both Necessary and Sufficient for AID-Mediated Hypermutation
- Order and Disorder during Divergence
- Mouse Genome-Wide Association Mapping Needs Linkage Analysis to Avoid False-Positive Loci
- Why Is the Correlation between Gene Importance and Gene Evolutionary Rate So Weak?
Kurzy
Zvyšte si kvalifikaci online z pohodlí domova
Autoři: prof. MUDr. Vladimír Palička, CSc., Dr.h.c., doc. MUDr. Václav Vyskočil, Ph.D., MUDr. Petr Kasalický, CSc., MUDr. Jan Rosa, Ing. Pavel Havlík, Ing. Jan Adam, Hana Hejnová, DiS., Jana Křenková
Autoři: MUDr. Irena Krčmová, CSc.
Autoři: MDDr. Eleonóra Ivančová, PhD., MHA
Autoři: prof. MUDr. Eva Kubala Havrdová, DrSc.
Všechny kurzyPřihlášení#ADS_BOTTOM_SCRIPTS#Zapomenuté hesloZadejte e-mailovou adresu, se kterou jste vytvářel(a) účet, budou Vám na ni zaslány informace k nastavení nového hesla.
- Vzdělávání


