-
Články
- Vzdělávání
- Časopisy
Top články
Nové číslo
- Témata
- Kongresy
- Videa
- Podcasty
Nové podcasty
Reklama- Kariéra
Doporučené pozice
Reklama- Praxe
proLékaře.cz / Odborné časopisy / Česká a slovenská neurologie a neurochirurgie / 2019 - Supplementum 1Pilot analysis of pressure ulcers – nationwide data from central adverse event reporting system
Pilotní analýza počtu dekubitů – celostátní data v centrálním systému hlášení nežádoucích událostí
Cíl: Analyzovat národní data o prevalenci hlášených dekubitálních lézích z centrálního systému hlášení nežádoucích událostí u poskytovatelů lůžkové péče v ČR za rok 2018.
Soubor a metodika: V rámci centrálního systému hlášení nežádoucích událostí byla analyzována data o počtu dekubitálních lézí za rok 2018 od 408 poskytovatelů lůžkové péče. Statistická analýza dat byla provedena pomocí SPSS (IBM Corp., Armonk, NY, USA) verze 22 na hladině významnosti p ≤ 0,05.
Výsledky: Dekubity jsou v centrálním systému hlášeny jako nejčastější nežádoucí události (celkový počet sledovaných hospitalizovaných pacientů za rok 2018 byl 2 693 008). Počty hlášených událostí se liší u jednotlivých typů poskytovatelů zdravotních služeb. Místo vzniku dekubitů sleduje 249 poskytovatelů péče, u nichž bylo nahlášeno celkem 45 994 nežádoucích událostí dekubitus (z nich 36,7 % vzniklých za hospitalizace a 63,3 % před hospitalizací). Ověřeny byly rozdíly v nahlášených počtech nežádoucích událostí dekubitus v závislosti na počtu zdravotnického personálu na počet pacientů, počtu pacientů na lůžko a podílu zdravotnického personálu na lůžko.
Závěr: Dekubity jsou hlášeny jako nejčastější nežádoucí události v centrálním systému hlášení, který je povinný pro všechny poskytovatele lůžkové péče v ČR. Hlášení je realizováno na základě jednotné metodiky.
Klíčová slova:
dekubitus – nežádoucí událost – prevalence – sledování – centrální systém hlášení
Authors: A. Pokorná 1; M. Pospíšil 1,2; J. Mužík 2,3; J. Kučerová 2; V. Štrombachová 2; D. Dolanová 1,2; P. Búřilová 1,2; L. Cetlová 4
Authors place of work: Department of Nursing and Midwifery, Faculty od Medicine, Masaryk University, Brno 1; Institute of Health Information and Statistics, Department of quality of care evaluation, Prague 2; Institute of Biostatistics and Analyses, Facolty of Medicine, Masaryk University, Brno 3; Department of Healthcare studies, College of Polytechnics, Jihlava 4
Published in the journal: Cesk Slov Neurol N 2019; 82(Supplementum 1): 8-14
Category: Původní práce
doi: https://doi.org/10.14735/amcsnn2019S8Summary
Aim: The aim is to analyse nationwide data from the Central Adverse Event Reporting System (CAERS) with special attention to pressure ulcers (PUs) in inpatient healthcare settings for 2018.
Patients and methods: Data collected in CAERs about reported PUs for 2018 were analysed in 408 inpatient healthcare settings. Statistical data analysis was performed using SPSS (IBM Corp., Armonk, NY, USA) version 22.0 at a significance level of P ≤ 0.05.
Results: PUs are reported as the most common adverse events (total number of monitored hospitalized patients in 2018 was 2,693,008). The number of reported PUs varies depending on the type of hospitals. The place of origin / formation of PUs was monitored by 249 healthcare facilities who reported a total of 45,994 adverse events – PU (of which 36.7% were originated during hospitalisation period and 63.3% prior to hospitalization). The differences in prevalence of PUs were verified in relation to the number of health workers per patient, number of patients per bed and staff / bed ratio.
Conclusion: PUs are reported as the most common adverse events in central adverse event reporting system in which reporting is obligatory for all inpatient healthcare settings in the Czech Republic. Reporting is based on uniform methodology.
Keywords:
prevalence – pressure ulcer – adverse event – monitoring – central reporting system
Introduction
The possibility of monitoring of the occurrence of pressure ulcers (PUs) in patients is an important issue, but neither in the Czech Republic nor internationally exists any uniform methodology for necessary data collecting that would sufficiently help monitor patients with PU [1]. It is well known that prevalence of PUs is an established quality indicator in health care in many countries [2]. It is also generally known that monitoring of PUs (prevalence and incidence) and especially its methodology for data collections vary at a national and international level. “Non-medical healthcare professionals form the bulk of the clinical healthcare workforce and play a crucial role in all health service delivery systems [1] and they could also influence accuracy of appropriate preventative measures and reporting of possible adverse events – PUs” [1]. The quality of care could be influenced by the level of knowledge of carers as the process of knowledge translation was described as slow as well as translation of research findings into practice [3,4]. We do hope that it is not true anymore also in the field of PUs thanks to internationally published guidelines which are being implementing in clinical practice. Remaining challenge is the need for clear and user-friendly monitoring system for PUs monitoring [1,5]. The lack of national guidelines and uniform methodology for measurement and data collection, makes sharing and comparing incidence, or prevalence of PUs (nationwide or at the EU level) simply not feasible. “In clinical settings without any systematic and validated PU registration system, estimating the incidence and prevalence of PUs, will mostly prove an academic and time-consuming exercise, and will lead to imprecise estimations” [6]. As PUs are still considered as adverse events (which is not always true) there was prepared uniform methodology for PUs monitoring on national level verified in four years project [7] and finally implemented as a part of Central Adverse Event Reporting System (CAERS) [8] for nationwide data collection. In our contribution we are presenting data collected in the first nationwide yearly data collection of adverse events from all inpatient healthcare settings in the Czech Republic with special attention to the PUs reporting.
Methods
The data collection was carried out in inpatient health care settings in the Czech Republic (N = 418) according the current legislation. Data for the year 2018 were submitted through the special system managed and controlled by the Institute of Health Information and Statistics of the Czech Republic (IHIS CR) in May 2019. The collected data were aggregated and anonymised. Main categorization was based on the type of the healthcare institution (A – faculty and large hospitals; B – other hospitals of acute care; S – specialised hospitals/ centres; P – psychiatric / mental health hospitals; N – long term care (LTC); L – spas / health resorts / medical centres and K – infant homes). Categorisation of hospitals was based on Czech DRG (diagnoses related groups) methodology. The data were collected in the given year (2018) in this form: prevalence of reported PUs as adverse events, number of patients over 65 years, number of patients at risk of PUs, number of bed side non-medical health workers (mainly nurses), number of beds and some facilities were able to report also place of origin / formation of PUs. Statistical analysis of data was performed in SPSS (IBM Corp., Armonk, NY, USA) at a significance level of P ≤ 0.05.
Results and discussion
In total 408 inpatient facilities were included in the general data analyses. The total number of patients monitored in 2018 in each type of inpatient facility is presented in Tab. 1. Subsequent events were then recalculated for these total patient numbers for relative comparison. For the analyses of PUs reporting, the category K – infant homes were excluded as there were no PUs reported. PUs were reported as adverse events in all other included inpatient facilities and they were the most often reported events (Fig. 1, 2). The figure one shows the total absolute number of reported adverse events (AEs). Higher incidence numbers are reported by inpatient providers with a higher total number of patients. The figure two shows the relative frequency of AEs – the incidence of reported AEs per 1,000 patients in the reporting period. This figure tells how much of AEs would be recorded if 1,000 patients would be treated with the inpatient facility, allowing comparison of differently sized hospitals / inpatient facilities. We could see while recalculating the number of reported PUs per thousand patients, the highest reporting rate was noticeable in the category N – long term care. Interesting information was found when we performed detailed analysis and the assessment of PUs site of formation/ origin (Fig. 3). The proportion of PUs, depending on whether they were formatted/ originated in a given facility or outside the facility, varies between hospital categories. The largest proportion of PUs reported as occurring in a given facility is in the categories S – specialized hospitals and P – psychiatric / mental health hospitals, the smallest in the category L – spas and health resorts. Only hospitals in which monitor PUs formatted in a given hospital and outside the hospital (N = 249) were included in detailed analysis. The occurrence of reported PUs is directly related to the proportion of patients at risk of PU. The risk also increases among older patients and those who, for any reason, stay in hospital for a longer period of time [9,10]. The analysed data can be used for further stratification and comparison of the occurrence of PUs between the inpatient facilities (proper de-anonymized data of particular healthcare providers were passed on to the authorized persons in the given hospital to evaluate proper preventative measures). The highest proportion of patients at risk of PUs was presumably in category N – long term care (57.8%) (Tab. 2). Though, it is important to highlight there were only 44 hospitals out of 97 in this category which reported place of PU’s origin/ formation.
Tab. 1. Submitted data for 2018 (type of inpatient facilities and number of monitored patients). 
*under category B, the original categories of hospitals B – regional, county hospital; C – middle size hospitals and D – small hospitals are combined AE – adverse event; PU – pressure ulcer Fig. 1. Comparison of occurrence No. of reported AEs by category of inpatient facilities/hospitals for the 2018. AE – adverse event
Obr. 1. Srovnání absolutního počtu hlášení nežádoucích událostí dle kategorií zdravotnických zařízení/nemocnic v roce 2018. AE – nežádoucí událost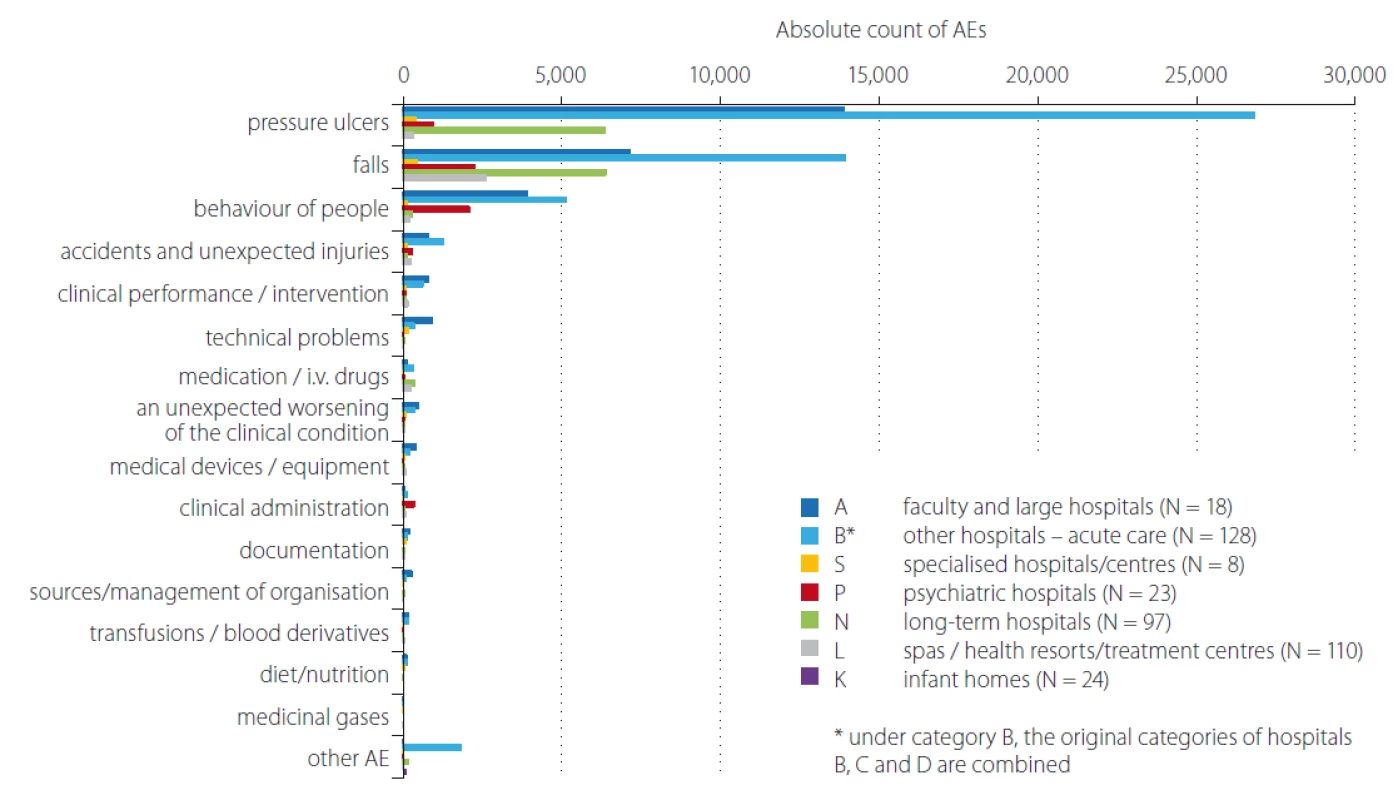
Fig. 2. Comparison of occurrence No. of reported AEs by category of inpatient facilities/hospitals for the 2018 – per 1,000 patients.
AE – adverse event
Obr. 2. Srovnání počtu hlášení nežádoucích událostí dle kategorií zdravotnických zařízení/nemocnic v roce 2018 – přepočet na 1 000 pacientů.
AE – nežádoucí událost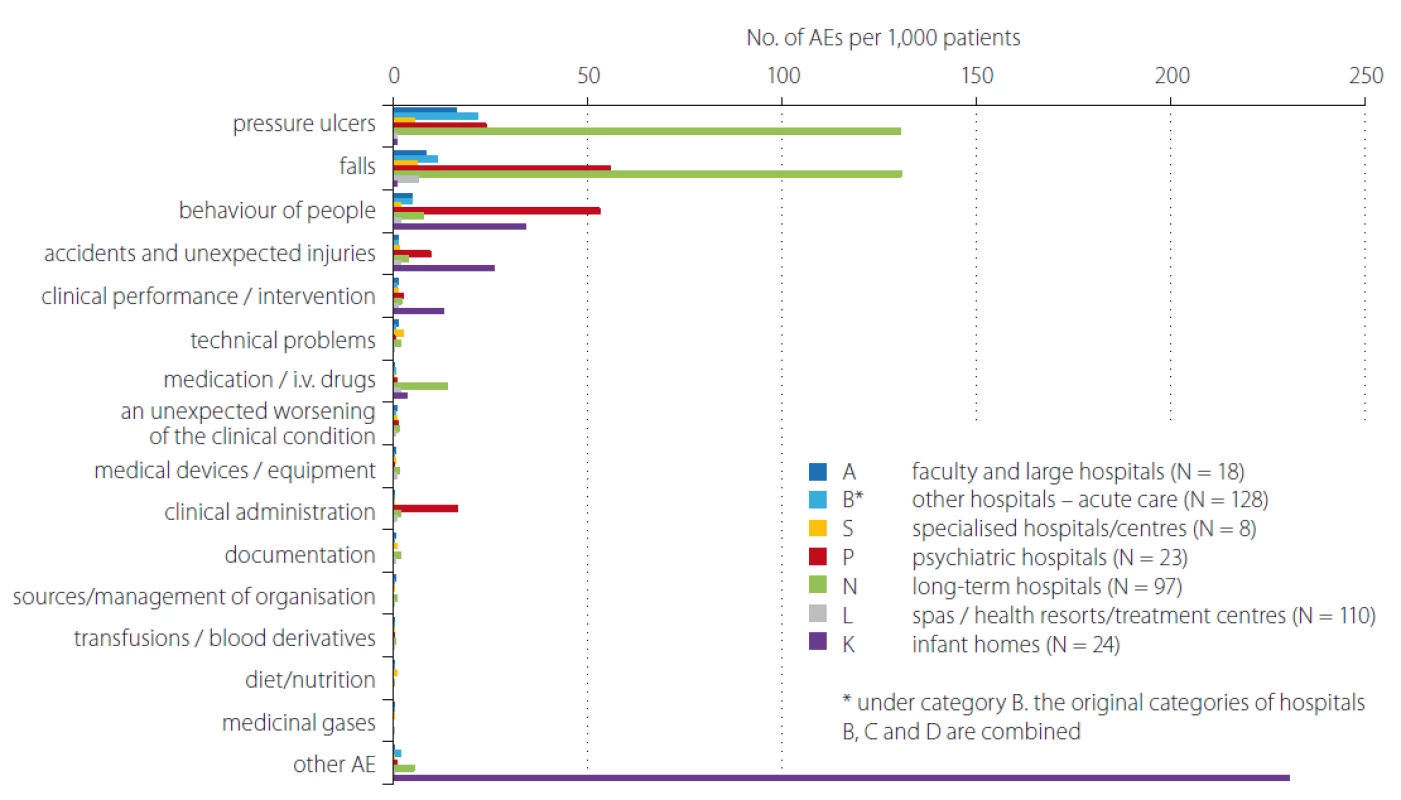
Fig. 3. Detailed monitoring of adverse event pressure ulcer – formation/origin in and out of the hospital.
AE – adverse event; PU – pressure ulcer
Obr. 3. Detailní analýza nežádoucích událostí dekubitus – místo vzniku ve zdravotnickém zařízení a mimo zdravotnické zařízení.
AE – nežádoucí událost; PU – dekubitus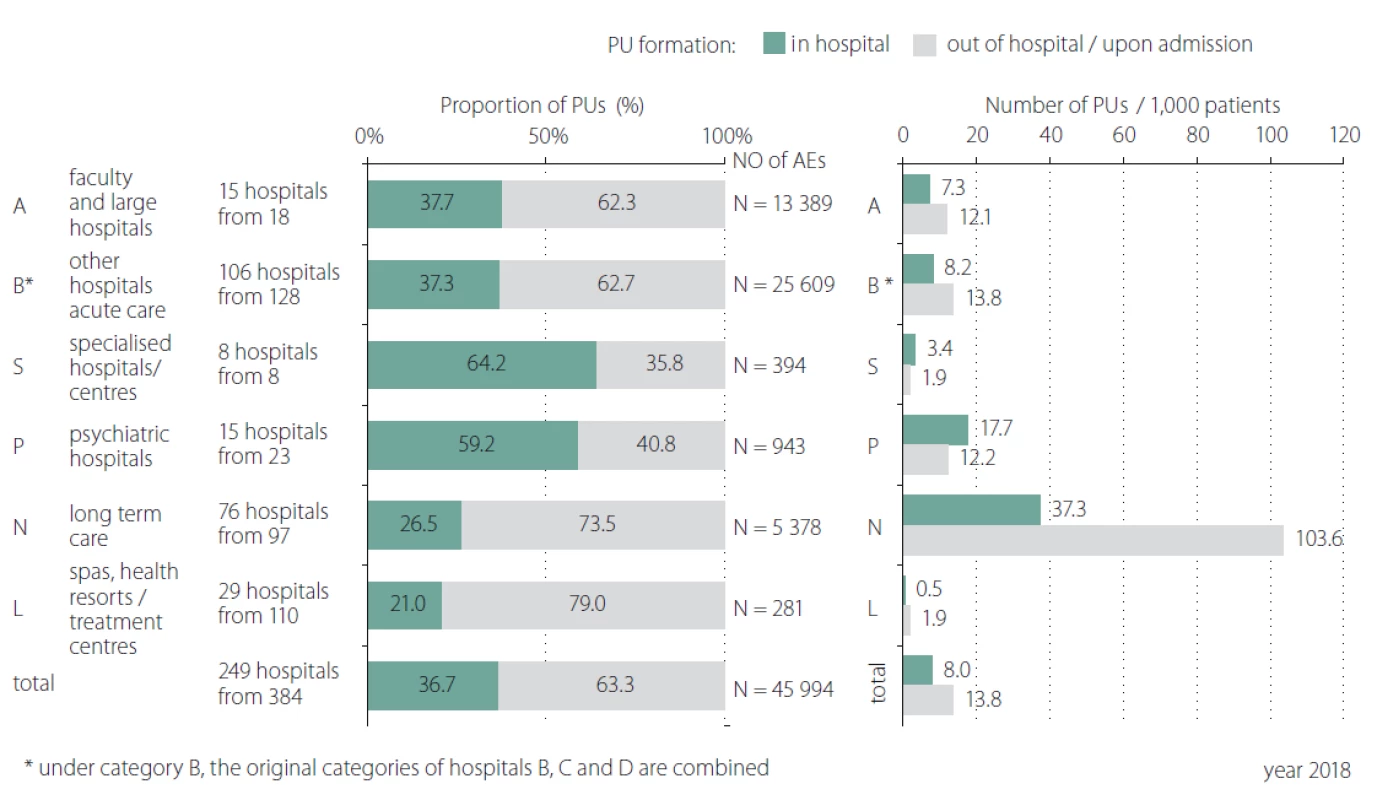
Tab. 2. Detailed monitoring of pressure ulcers – risk of pressure ulcers. 
* under category B, the original categories of hospitals B, C and D are combined
N – number; PUs – pressure ulcersTab. 3. Detailed monitoring of pressure ulcers – patients > 65 years. 
* under category B, the original categories of hospitals B, C and D are combined
N – number; PUs – pressure ulcersSimilar situation was identified in relation to the proportion of patients over 65 years (Tab. 3). The vast majority of elderly patients (75.6%) was reported in category N – long term care. So, we could conclude that the occurrence of reported PUs shows a direct proportion to the proportion of patients over 65 years of age. Older adult patients constitute a population at high risk for complications, in particular PUs during hospitalization, especially when they are immobile or bedbound; however, the age as a predictive factor for PUs was reported in patients over 85 years in study focused on patient after hip fracture [11]. Another study focused on elderly patients and their age as PUs formation predictive factor highlights that age is potential indicator which could help provide safe and targeted care by pre-emptively identifying patients at highest risk of PUs [12]. We have verified that age could be predictive factor as well but only as an indirect evidence as the majority of patients in LTC facilities are not solely elderly patients, but also polymorbid patients in a poor health and/ or social condition. We consider as the most significant the findings related to the human resources and other capacities of the healthcare facilities. Fig. 4 describes distribution of hospitals/ facilities by the number of healthcare staff per bed, the number of patients per bed and the number of patients per healthcare staff which may provide additional stratification for the possibility of a more accurate comparison of AEs among healthcare hospitals/ facilities. Results in category A – faculty and large acute care hospitals show a higher frequency of PUs originated/ formatted in a given hospital per 1,000 patients. The higher number of reported PUs was in those hospitals, where there is a smaller number of healthcare staff per bed, where the number of patients per bed is lower and where the number of patients per healthcare staff is lower (patient / staff ratio). It means that patients are staying in the hospital for the longer time or they are hospitalised at intensive care units (ICUs). In previous studies it has been indicated that critical care patients often have several risk factors for pressure ulceration [13]. Results in category N – long term care summarises higher frequency of PUs originated/ formatted in a given hospital per 1,000 patients. The higher reported incidence of PUs was in those hospitals, where there is a smaller number of healthcare staff per bed, where the number of patients per bed is lower and where the number of patients per healthcare staff is lower (Fig. 5). Despite the fact that PUs are significantly more frequently mentioned in patients at ICUs than in standard wards and units [13,14] a significant proportion of PUs are not always accurately reported. On the other hand we have to emphasize that patients in LTC facilities have often decreased quality of life, increased morbidity and mortality [15,16]. The fact is that facilities with high rates of PUs have higher costs and risks of litigation [16].
Fig. 4. Detailed monitoring of adverse event pressure ulcer related to the capacities: category A and B – hospitals of acute care.
PU – pressure ulcer
Obr. 4. Detailní analýza hlášení nežádoucích událostí (dekubitů) ve vztahu ke kapacitním ukazatelům ve fakultních nemocnicích a nemocnicích akutní péče (kategorie A a B).
PU – dekubitus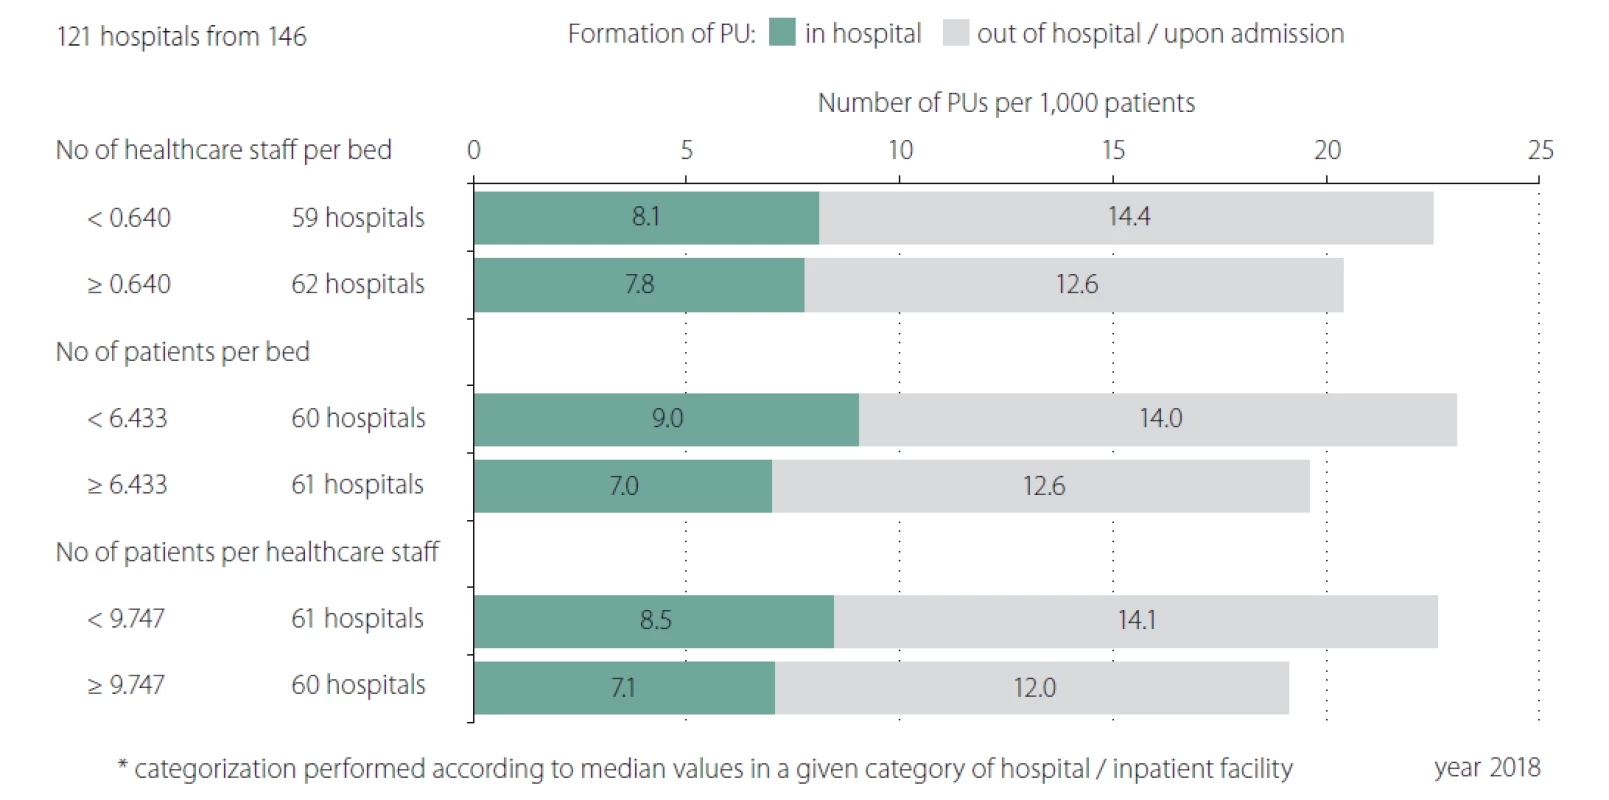
Fig. 5. Detailed monitoring of adverse event pressure ulcer related to the capacities: category N – long term care.
PU – pressure ulcer
Obr. 5. Detailní analýza hlášení nežádoucích událostí (dekubitů) ve vztahu ke kapacitním ukazatelům v nemocnicích následné péče (kategorie N).
PU – dekubitus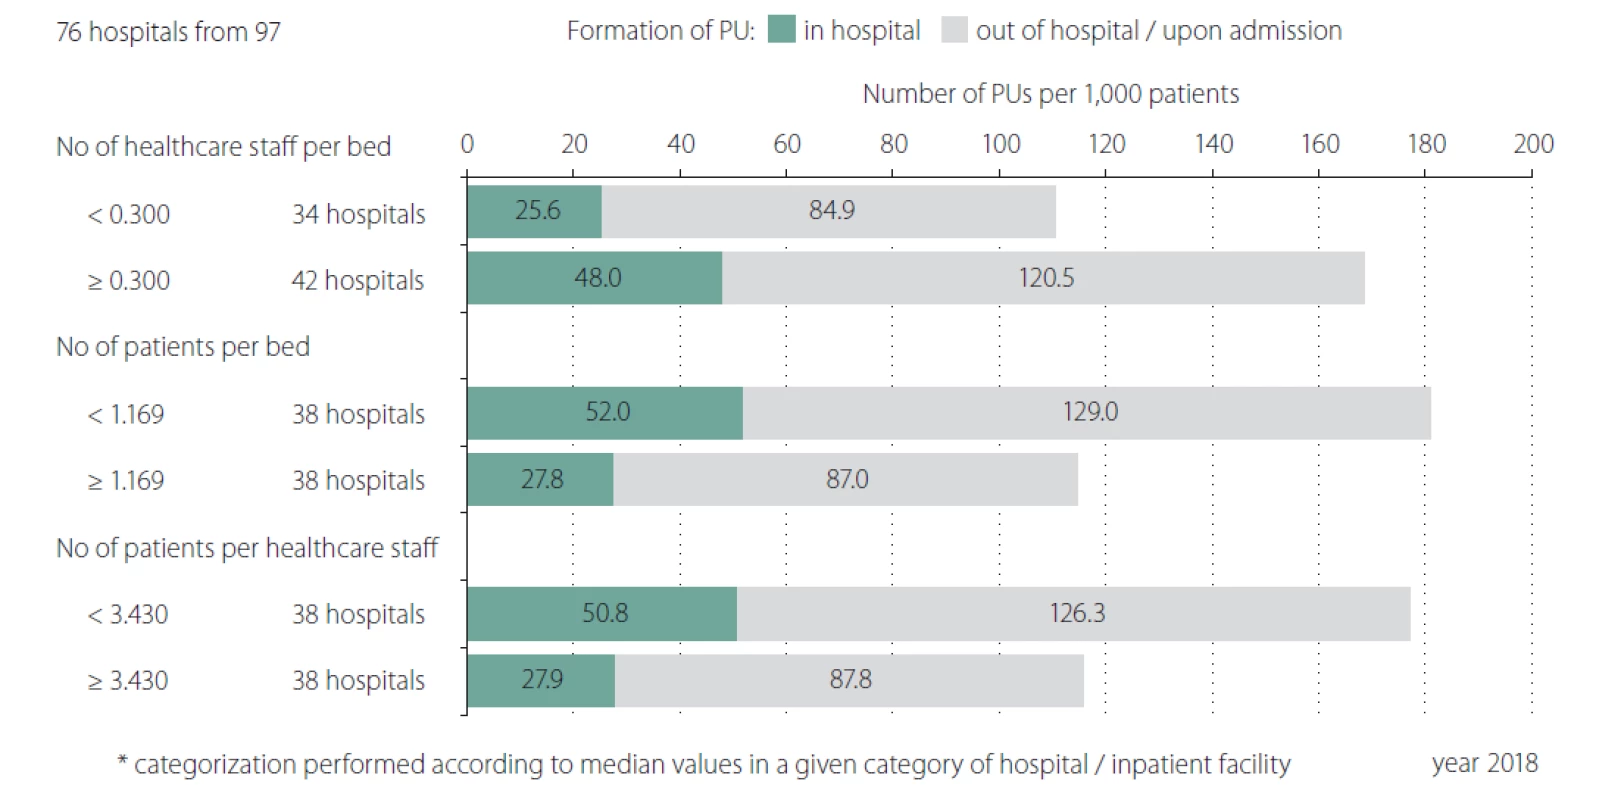
Strengths and Limitations of the study and data collection
In our study we did not present real number of PUs rather the number of reported PUs in the local adverse event reporting systems of each healthcare provider. The main strength of the study is the use of uniform methodology and cross-sectional study results as we collect data from almost all inpatient healthcare facilities in the Czech Republic. The responsible people from all reporting units / hospitals were provided with methodological support from IHIS staff therefore it is assumed the data were collected accurately.
Conclusion
We have analysed nationwide data from CAERS in which all the inpatient healthcare facilities has obligation to report data at central level under the uniform methodology. Based on our analysis we have verified that number of PUs reported in different types of healthcare settings varies. The majority of reported PUs is reported in LTC facilities as formatted outside the facility. The number of reported PUs is related to the proportion of patients at risk of PU and patient over 65 years of age. We would like to emphasize the main objective of the CAERS is to support shared learning and the promotion of appropriate preventative measures on local level. We do hope that CEARS as the quality improvement programme providing unified methodology (including technical and non-technical interventions, data feedback to staff and clinical leadership) should be associated with a sustained reduction in the incidence of PUs on a local (provider) level. Centralised data collection plays an important role in healthcare quality improvement and could become useful for longitudinal studies and monitoring. Strategies used in our CAERS programme may be translated to all other inpatient settings and can lead to widespread patient benefit.
The authors declare they have no potential conflicts of interest concerning drugs, products, or services used in the study.
The Editorial Board declares that the manuscript met the ICMJE “uniform requirements” for biomedical papers.
Přijato k recenzi: 30. 6. 2019
Přijato do tisku: 22. 7. 2019
prof. PhDr. Andrea Pokorná, Ph.D.
Department of Nursing and Midwifery, Faculty of Medicine Masaryk University
Kamenice 3
625 00 Brno
e-mail: apokorna@med.muni.cz
Zdroje
1. Pokorná A, Jarkovský J, Mužík J et al. A new online software tool for pressure ulcer monitoring as an educational instrument for unified nursing assessment in clinical settings. Mefanet J 2016; 4(1): 26 – 32.
2. Gunningberg L, Hommel A, Bååth C et al. The first national pressure ulcer prevalence survey in county council and municipality settings in Sweden. J Eval Clin Pract 2013; 19(5): 862 – 867. doi: 10.1111/ j.1365-2753.2012.01865.x.
3. Balas EA, Boren SA. Managing clinical knowledge for healthcare improvements. In: Bemmel J, McCray AT (eds). Yearbook of medical informatics 2000: patient-centered systems. Stuttgart: Schattauer Verlagsgesellschaft 2000 : 65 – 70.
4. Rogers E. Diffusion of Innovations. 5th ed. New York: Simon and Schuster 2003.
5. Pokorná A, Saibertová S, Vasmanská S et al. Registers of pressure ulcers in an international context. Cent Eur J Nurs Midw 2016; 7(2): 444 – 452. doi: 10.15452/ CEJNM.2016.07.0013.
6. Collier M. Pressure ulcer incidence: the development and benefits of 10 year’s-experience with an electronic monitoring tool (PUNT) in a UK Hospital Trust. EWMA J 2015; 15(2): 15 – 20.
7. Pokorná A, Mužík J, Búřilová P et al. Pressure lesion monitoring – data set validation after second pilot data collection. Cesk Slov Neurol N 2018; 81/ 114 (Suppl 1): 6 – 12. doi: 10.14735/ amcsnn2018S6.
8. Pokorná A, Štrombachová V, Mužík J et al. Národní portál Systém hlášení nežádoucích událostí. Praha: Ústav zdravotnických informací ČR 2016. [online]. Available from URL: https: / / shnu.uzis.cz.
9. Koivunen M, Hjerppe A, Luotola E et al. Risks and prevalence of pressure ulcers among patients in an acute hospital in Finland. J Wound Care 2018; 27 (Suppl 2): S4 – S10. doi: 10.12968/ jowc.2018.27.Sup2.S4.
10. Bereded DT, Salih MH, Abebe AE. Prevalence and risk factors of pressure ulcer in hospitalized adult patients; a single center study from Ethiopia. BMC Res Notes 2018; 11(1): 847. doi: 10.1186/ s13104-018-3948-7.
11. Chiari P, Forni C, Guberti M et al. Predictive factors for pressure ulcers in an older adult population hospitalized for hip fractures: a prognostic cohort study. PLoS One 2017; 12(1): e0169909. doi: 10.1371/ journal.pone.0169909.
12. Forni C, D‘Alessandro F, Genco R et al. Prospective prognostic cohort study of pressure injuries in older adult patients with hip fractures. Adv Skin Wound Care 2018; 31(5): 218 – 224. doi: 10.1097/ 01.ASW.0000530685.39114.98.
13. Richardson A, Peart J, Wright SE et al. Reducing the incidence of pressure ulcers in critical care units: a 4-year quality improvement. Int J Qual Health Care 2017; 29(3): 433 – 439. doi: 10.1093/ intqhc/ mzx040.
14. Akbari Sari A, Doshmanghir L, Neghahban Z et al. Rate of pressure ulcers in intensive units and general wards of iranian hospitals and methods for their detection. Iran J Public Health 2014; 43(6): 787 – 792.
15. White-Chu EF, Flock P, Struck B et al. Pressure ulcers in long-term care. Clin Geriatr Med 2011; 27(2): 241 – 258. doi: 10.1016/ j.cger.2011.02.001.
16. Pham Ba‘, Stern A, Chen W et al. Preventing pressure ulcers in long-term care a cost-effectiveness analysis. Arch Intern Med 2011; 171(20): 1839 – 1847. doi: 10.1001/ archinternmed.2011.473.
Štítky
Dětská neurologie Neurochirurgie Neurologie
Článek vyšel v časopiseČeská a slovenská neurologie a neurochirurgie
Nejčtenější tento týden
2019 Číslo Supplementum 1- Metamizol jako analgetikum první volby: kdy, pro koho, jak a proč?
- Magnosolv a jeho využití v neurologii
- Zolpidem může mít širší spektrum účinků, než jsme se doposud domnívali, a mnohdy i překvapivé
- Nejčastější nežádoucí účinky venlafaxinu během terapie odeznívají
-
Všechny články tohoto čísla
- Reconstruction of recurrent ischiadic pressure ulcer using turnover hamstring muscle flap
- The knowledge and practises of nurses in the prevention of medical devices related injuries in intensive care – questionnaire survey
- Effectiveness of comprehensive pain management in hard-to heal ulcers – a protocol of systematic review
- Negative wound pressure therapy in treatment of a pressure ulcer in paraplegics
- The use of negative pressure wound therapy for wound complication management after vascular procedures
- Mapping of pressure ulcers and non-healing wounds in medical curriculum
- Oxidative stress in wound healing – current knowledge
- Quality of life in patient with non-healing wounds
- Pain assessment of surgical wounds after angio-surgical interventions
- Effectiveness of hyperbaric oxygen therapy in non-healing ulcerations – meta-review
- Multidisciplinary approach in surgical pressure ulcer therapy after spinal cord injury
- Hyperbaric oxygen therapy in non-healing ulcerations – mechanisms of action, current european recommendations and case report
- Key factors for the development of pressure ulcers in surgical practice
- Pilot analysis of pressure ulcers – nationwide data from central adverse event reporting system
- Česká a slovenská neurologie a neurochirurgie
- Archiv čísel
- Aktuální číslo
- Informace o časopisu
Nejčtenější v tomto čísle- Quality of life in patient with non-healing wounds
- The knowledge and practises of nurses in the prevention of medical devices related injuries in intensive care – questionnaire survey
- The use of negative pressure wound therapy for wound complication management after vascular procedures
- Negative wound pressure therapy in treatment of a pressure ulcer in paraplegics
Kurzy
Zvyšte si kvalifikaci online z pohodlí domova
Autoři: prof. MUDr. Vladimír Palička, CSc., Dr.h.c., doc. MUDr. Václav Vyskočil, Ph.D., MUDr. Petr Kasalický, CSc., MUDr. Jan Rosa, Ing. Pavel Havlík, Ing. Jan Adam, Hana Hejnová, DiS., Jana Křenková
Autoři: MUDr. Irena Krčmová, CSc.
Autoři: MDDr. Eleonóra Ivančová, PhD., MHA
Autoři: prof. MUDr. Eva Kubala Havrdová, DrSc.
Všechny kurzyPřihlášení#ADS_BOTTOM_SCRIPTS#Zapomenuté hesloZadejte e-mailovou adresu, se kterou jste vytvářel(a) účet, budou Vám na ni zaslány informace k nastavení nového hesla.
- Vzdělávání


