-
Články
- Vzdělávání
- Časopisy
Top články
Nové číslo
- Témata
- Kongresy
- Videa
- Podcasty
Nové podcasty
Reklama- Kariéra
Doporučené pozice
Reklama- Praxe
Years of life lost due to traumatic brain injury in Europe: A cross-sectional analysis of 16 countries
Marek Majdan and colleagues use detailed data from the statistical office of the European Union to estimate the burden of deaths due to traumatic brain injury in 16 European countries.
Published in the journal: . PLoS Med 14(7): e32767. doi:10.1371/journal.pmed.1002331
Category: Research Article
doi: https://doi.org/10.1371/journal.pmed.1002331Summary
Marek Majdan and colleagues use detailed data from the statistical office of the European Union to estimate the burden of deaths due to traumatic brain injury in 16 European countries.
Introduction
Traumatic brain injuries (TBIs) are a major public health, medical, and societal challenge globally [1–4]. In the European Union alone, an estimated 57,000 deaths and 1.5 million hospital admissions annually have been attributed to TBI. This translates to a pooled population mortality rate of 11.7 (95% CI: 9.9 to 13.6) and hospital admission rate of 287.2 (95% CI: 232.9 to 341.5) per 100,000 persons per year [5]. The overall mortality in persons following TBI has been shown to be substantially higher than mortality in the general population—a pooled standardized mortality ratio of 2.18 (95% CI: 1.88–2.52) [6]. Life expectancy after TBI has been estimated to range from less than 40% to over 85% of that of the general population—depending on the severity of the injury and the level of impairment [7]. Due to the long-term character of the disabilities after TBI and their unstable nature (e.g., deterioration of previously achieved levels of outcome occurs in about 1 of 3 patients within 10 years post-injury), TBI has been considered a chronic condition [8]. Thus, the general burden of TBI to victims, their families, and the society as a whole is substantial and has been well documented.
Recent epidemiological research suggests that the patterns of TBI are dynamic, that they are changing over time, and that they are dependent on the demographic structure of the population and the level of economic development [9]. In emerging economies, intensive motorization that is not accompanied by adequate and enforced preventive measures has led to a substantial increase in TBIs related to traffic crashes [2,9]. As life expectancy has increased in high-income countries, TBI from falls has become more prevalent [9–11]. In order to cope with such variation, and to achieve any improvements in the levels of occurrence and outcomes of TBI, standardized, reproducible, regularly updated, and comparable epidemiological data are needed [5,12,13]. Most published epidemiological studies on TBI have focused on using case fatality rates, population mortality, or incidence to describe the epidemiology of TBI [14–16].
Although these indicators provide insight into the occurrence and outcome of TBIs in various populations, they fail to quantify the full extent of their public health and societal impact. Summary measures of population health used in the Global Burden of Disease Study have been designed to capture mortality and morbidity impact, and to allow subsequent comparison of disease impact on public health across a range of illnesses and populations. Among these measures are years of life lost (YLLs), which quantifies the number of years of life lost because the person dies prematurely due to a disease or injury; years lived with disability (YLDs), which quantifies the healthy time lost by a person living with a disability caused by a disease or injury; and disability-adjusted life years (DALYs), a summary measure that is the sum of YLLs and YLDs [17]. These indicators have recently been used to estimate the global burden of diseases and the overall burden of injuries [6]; however—owing especially to the nonavailability of data—studies using them to describe TBI are scarce [12,18].
The aim of this study was to provide an in-depth analysis of the burden of deaths due to TBI by calculating TBI-induced YLLs in 16 European countries in 2013, analyzing their main causes and demographic patterns, using data extracted from death certificates under unified guidelines and collected in a standardized manner.
Methods
Study design and setting
A population-wide, cross-sectional epidemiological study was conducted in 16 European countries (Austria, Bulgaria, Croatia, Cyprus, Denmark, Estonia, Hungary, Ireland, Italy, Lithuania, Luxembourg, Romania, Serbia, Slovakia, Slovenia, and United Kingdom) in order to estimate TBI YLLs for the year 2013. The selection of countries was based on the availability of data. The year 2013 was chosen because it was the most recent year for which data were available. The availability of the data in other EU countries for this year was limited because, at the time of this study, not all European countries were submitting data on causes of injury-related deaths in the necessary format (e.g., giving both the external cause and nature of injury) and detail (e.g., giving data in sufficiently small age groups). Thus, the choice was made to use the 16 countries for which data were available, and to extrapolate the findings to the 28 member states of the European Union (EU-28), and this seemed justified under the circumstances.
Data sources
The data used for all analyses in this study were acquired from the statistical office of the European Union (Eurostat). Eurostat routinely collects data from death certificates from the 28 EU member states, the former Yugoslav Republic of Macedonia, Albania, Iceland, Norway, Liechtenstein, and Switzerland and regularly publishes annual overviews of causes of deaths [19]. For our study, a specifically tailored dataset of micro-level data was provided that, in detail of information, went beyond the regularly published reports. This dataset contained a record for each injury-related death that occurred in the included countries in 2013, where the external cause of death (International Classification of Diseases–10th Revision [ICD-10] codes V01–Y98), the specific nature of injury (ICD-10 codes S00–T98, only 1 diagnosis provided for each record), the age at death, and sex were given. All data used in our analyses were collected at the country level and then—following specific and unified guidelines—submitted to Eurostat, which in turn provided them to us. The study used administratively collected secondary data, and no ethics committee approval was required. No ethics approval was required in order to obtain data from Eurostat.
For the purpose of this study, a TBI-related death was defined as a death where the cause of death was a TBI or a TBI sequela, i.e., from the provided database, records in which the nature of injury was coded as ICD-10 S00–S09 (injuries to the head) or T90 (sequelae of injuries to the head).
Variable definitions
The European Union life table published by Eurostat was used to determine the life expectancy at death for each recorded death [20]. The number of YLLs for each death was calculated by subtracting the age at death from the life expectancy at the age of death, and summarized using this formula:
where d1 is the number of fatal cases due to health outcome l in a certain period and el is the expected individual life span at the age of death due to health outcome l.YLLs were summarized into 6 age groups (0–4, 5–14, 15–34, 35–64, 65–84, and ≥85 years) by summing the YLLs in persons in each age group. Crude rates of YLLs were calculated per 100,000 people per year using mid-year populations for each country in total and for the 6 age groups. For comparison purposes (in response to the suggestions of a peer reviewer), number of YLLs and crude TBI YLL rates per 100,000 persons per year are also presented broken down into 5-year age groups (S1 Appendix). In addition, age-standardized rates with 95% CIs were calculated in order to adjust for differences in the age structures of the compared populations (i.e., differences between the analyzed countries). To calculate age-standardized rates, the European standard population was used, which is a theoretical population with its age distribution based on actual age distributions in the populations of the European countries [21]. A pooled estimate was calculated based on age-standardized rates. Further, average YLLs due to TBI per case were calculated with 95% CIs for each country and overall (mean YLLs per case calculated by dividing the sum of YLLs by the number of cases in the respective group or subgroup).
In addition, both numbers of YLLs and YLL rates were stratified by sex, and external cause of injury. Differences between rates (by age group and sex) are presented as rate ratios with 95% CIs.
In order to evaluate the relative importance of TBI in the context of all injuries, proportions of TBI YLLs out of overall injury YLLs were calculated. For this calculation, cases with unspecific codes (e.g., “other and unspecified effects of external causes”); deaths caused by exposure to heat, frost, or intoxication (T15–T65); and cases with other generalized causes (T66–T78; T80–T88) were excluded. Deaths with these causes are either not directly comparable to deaths due to TBI—because the circumstances or mechanisms leading to death are substantially different (e.g., traffic injury versus frostbite)—or the true cause of death is actually unknown and inclusion could bias the calculated proportions by increasing the denominator. Thus, only the following codes were used in the denominator: injuries to the head (S00–S09); injuries involving multiple body regions (T00–T07); injuries to unspecified trunk, limb, or body region (T08–T14); certain early complications of trauma (T79); and sequelae of injuries, of poisoning, and of other consequences of external causes (T90–T98). In order to allow for comparisons, S1–S3 Tables present these analyses with all injury-related deaths (no exclusions) used as the denominator.
The total number of TBI YLLs in the EU was estimated by extrapolating the pooled crude rate of YLLs in the 16 analyzed countries to the EU-28 population count published by Eurostat [22].
Statistical methods
Pooled analyses were performed in order to estimate summary age-standardized rates of YLLs. In order to model possible heterogeneity of rates in the different countries, the random effects model was applied [23] by the DerSimonian and Laird method, in line with previous studies [5,24]. To assess the heterogeneity of the pooled estimations, I2 values with 95% confidence intervals were calculated. To make our findings as comparable as possible, in S4 Table we provide pooled rates calculated by applying the fixed effects model (in response to the suggestions of a peer reviewer). The original analysis plan for the study is reported in S1 Text.
Results
Based on the data we obtained and the case ascertainment defined in this study, 17,049 TBI deaths were identified in the 16 analyzed countries in 2013, which translates to an age-standardized pooled rate of 11.3 (95% CI: 9.5–13.1) TBI deaths per 100,000 persons per year (Fig 1). Of these deaths, 11,944 (70%) were males. In males, the majority of deaths (8,595, 72%) occurred in persons 35–84 years old, whereas in females most deaths occurred in persons 65 years old and older (3,703, 73%). Fig 2 shows a map with levels of TBI death rates in the analyzed countries. The highest TBI death rates overall and for males were observed in Lithuania, and for females in Austria (consult S5 and S6 Tables for details). The largest sex differences in age-standardized TBI death rates were in Estonia (male to female ratio of 5.8) and Bulgaria (ratio of 4.5), whereas the smallest such differences were in the United Kingdom (ratio of 1.7) and Italy (ratio of 2.1)—consult S7 Table for details.
Fig. 1. Crude TBI death rates and age-standardized TBI death rates per 100,000 persons in 16 European countries in 2013, with a pooled age-standardized death rate. 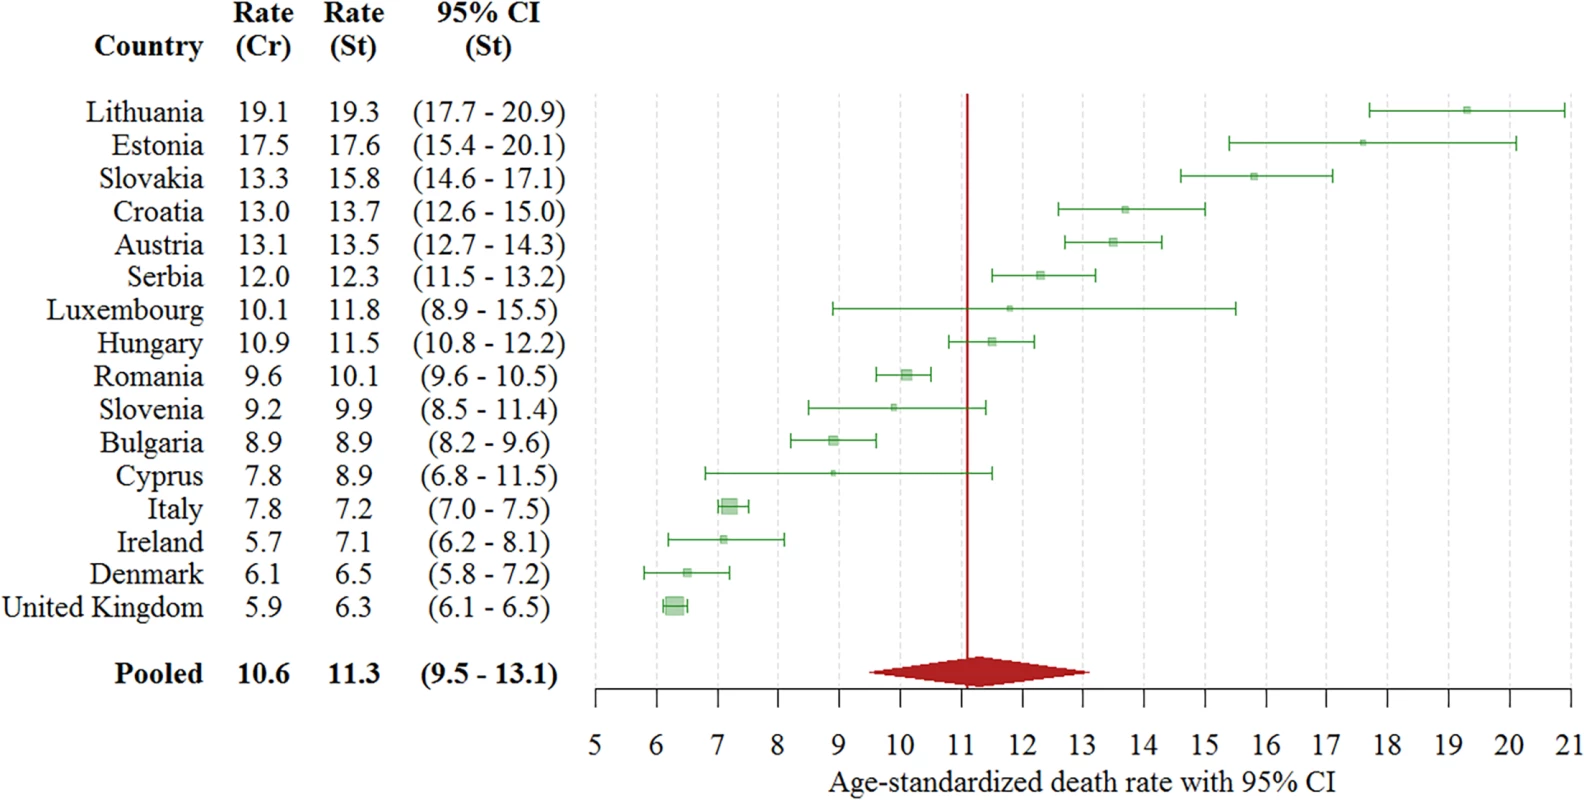
St, standardized; CI, confidence interval; Cr, crude; TBI, traumatic brain injury. Meta-analysis heterogeneity: I2 = 100% (95% CI: 100% to 100%). Fig. 2. Age-standardized TBI death rates per 100,000 persons in 16 European countries in 2013. 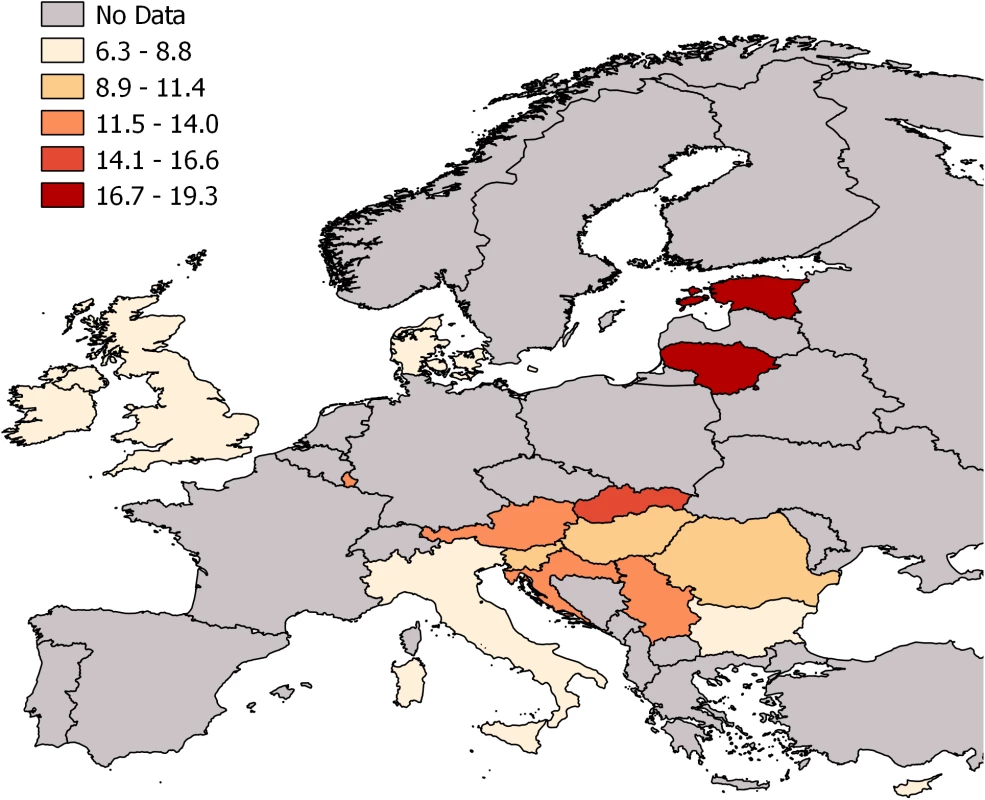
TBI, traumatic brain injury. Grey areas were not included in this study. In order to present the overall magnitude of the problem in the analyzed countries, in Table 1 we present the overall numbers of TBI YLLs by country, age, and sex, along with the size of the population in each country. A total of 374,636 YLLs were attributed to TBI in the 16 analyzed countries in 2013. Of these, 282,870 (76%) were YLLs in the male population. The highest number of TBI YLLs for both sexes was observed in Italy (67,809 in males and 24,481 in females). For males, the lowest number of YLLs was in Luxembourg (1,031), and for females in Cyprus (212). Deaths occurring in the age group 15–64 years old were the largest contributors to TBI YLLs—they caused 73% (274,409) of all TBI YLLs (this pattern was present in both sexes). The sums of the TBI YLLs in the countries are proportional to the population and are higher in more populated countries, where populations at risk are larger. In order to put the numbers of YLLs in context with the population and to compare them more validly, we present crude and age-standardized rates in Table 2.
Tab. 1. Numbers of TBI YLLs in 16 European countries in 2013 by age, sex, and country. 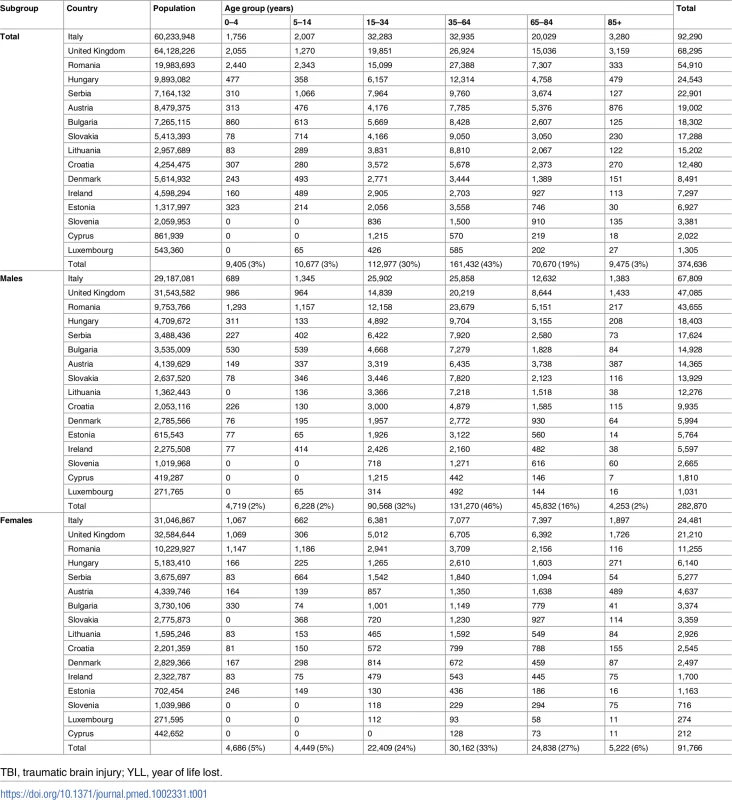
TBI, traumatic brain injury; YLL, year of life lost. Tab. 2. Crude and age-standardized TBI YLL rates per 100,000 persons in 16 European countries in 2013 by age and sex. 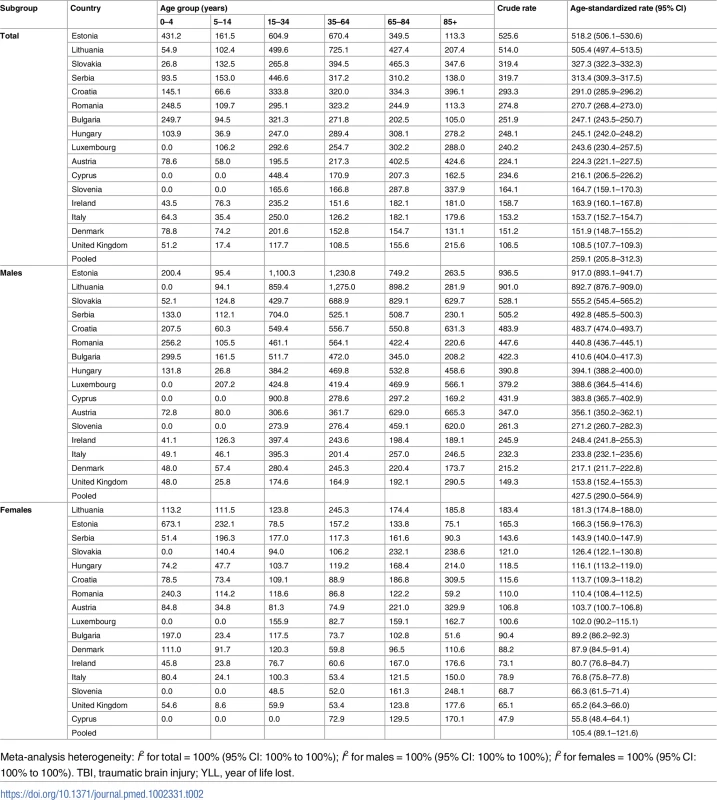
Meta-analysis heterogeneity: I2 for total = 100% (95% CI: 100% to 100%); I2 for males = 100% (95% CI: 100% to 100%); I2 for females = 100% (95% CI: 100% to 100%). TBI, traumatic brain injury; YLL, year of life lost. Crude rates of TBI YLLs are presented for each age group, along with the overall crude rate and the age-standardized rate per 100,000 persons per year—by country and sex. The highest age-standardized rates overall and in males were found for Estonia (518.2 [95% CI: 506.1 to 530.6] and 917.0 [95% CI: 893.1 to 941.7], respectively), and in females for Lithuania (181.3 [95% CI: 174.8 to 188.0]). The geographical distribution of TBI YLLs is presented in Fig 3. In S8 Table, age differences in TBI YLLs are presented as rate ratios with 95% CIs. In both sexes, and overall, compared to the reference category (35–64 years), the highest rates are in the age group 15–34 years (rate ratios of 1.18 overall, 1.13 in males and 1.29 in females). While in males the rates in the age groups 65–84 and ≥85 years are similar to that of the reference category (rate ratios of 1.0 and 0.93), in females the rates in the older groups are substantially higher (rate ratio of 1.92 for the age group 65–84 years and 2.34 for the age group ≥85 years), confirming the shift of TBI to higher ages in the female population.
Fig. 3. Age-standardized TBI YLL rates per 100,000 persons in 16 European countries in 2013. 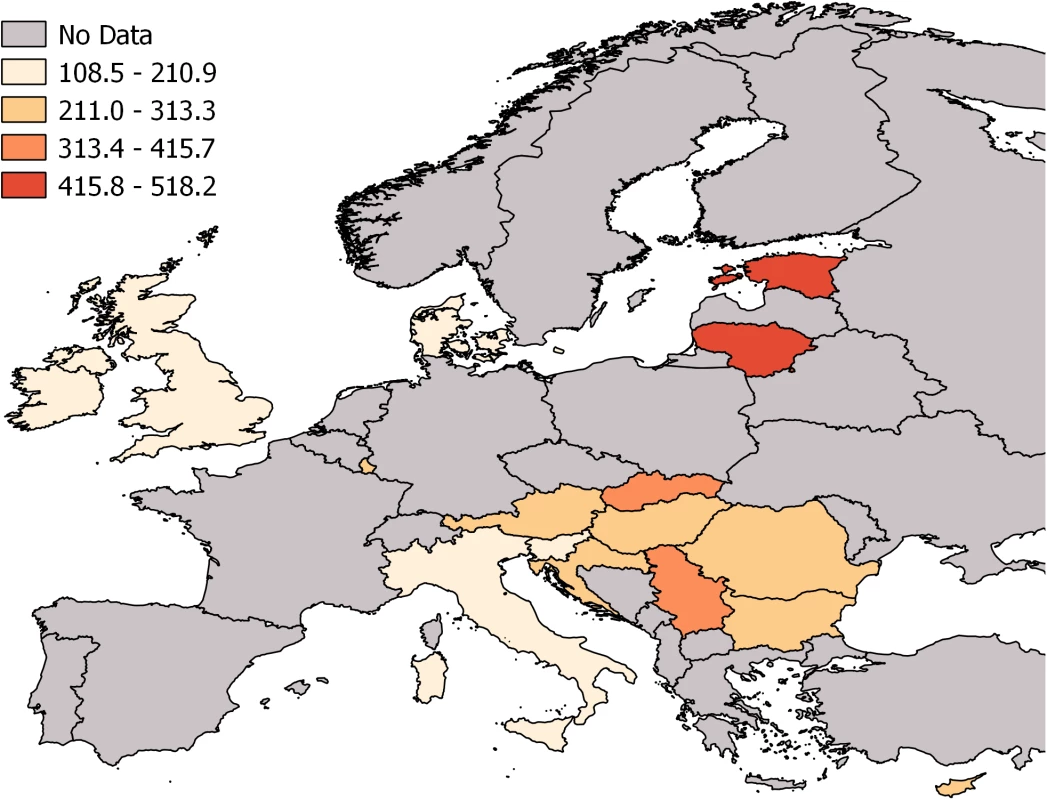
TBI, traumatic brain injury; YLL, year of life lost. Grey areas were not included in this study. In the same manner, sex differences are presented as rate ratios by country in S9 Table. Overall, the male to female rate ratio was 3.24 (95% CI: 3.22 to 3.27), ranging from 2.29 (95% CI: 2.26 to 2.33) in the United Kingdom to 9.01 (95% CI: 7.83 to 10.41) in Cyprus. The pooled age-standardized TBI YLL rates for the 16 countries were 259.1 (95% CI: 205.8 to 312.3) per 100,000 persons per year overall, 427.5 (95% CI: 290.0 to 564.9) in males, and 105.4 (95% CI: 89.1 to 121.6) in females.
Mean YLLs per TBI death was calculated in order to describe the burden presented by each death. Table 3 presents the findings for this measure in detail by country, age, and sex. On average, 1 TBI-related death translated into 24.3 (95% CI: 22.0 to 26.6) YLLs overall, 25.6 (95% CI: 23.4 to 27.8) YLLs in males, and 20.9 (95% CI: 17.9 to 24.0) YLLs in females. In general, per-case YLLs decreased with increasing age: from 79.3 YLLs/case in the age group 0–4 years to 3.4 in the age group 85 years and older, with corresponding values of 76.3 and 3.3 in males and 82.3 and 3.8 in females, respectively.
Tab. 3. Burden of TBI YLLs per death in 16 European countries in 2013 by age and sex. 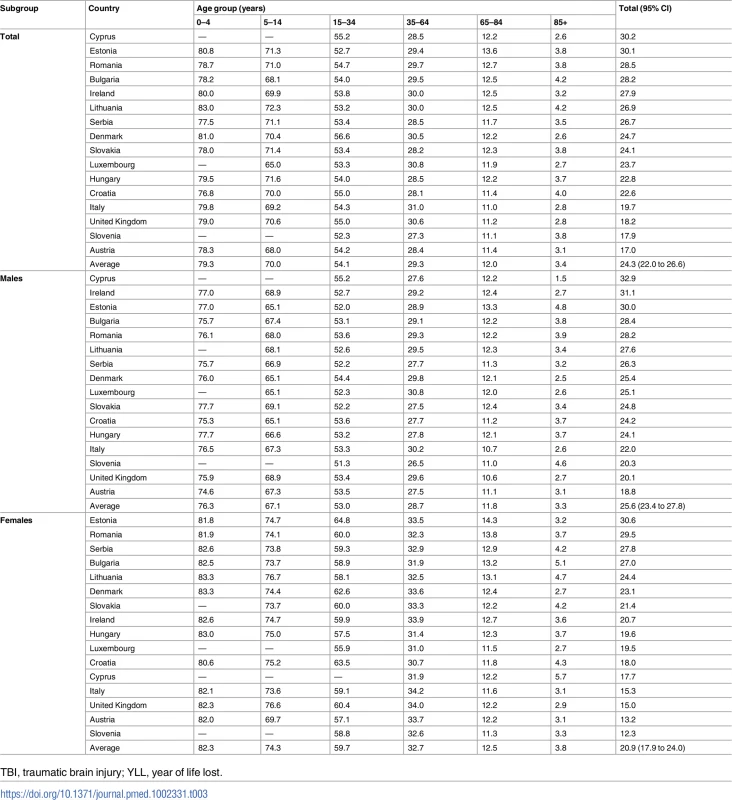
TBI, traumatic brain injury; YLL, year of life lost. Falls and traffic injuries were the most common causes of TBI YLLs across the 16 countries—as presented in Fig 4—followed by suicide, violence, and other causes. After excluding deaths caused by natural forces, intoxication, and other generalized or unknown causes (see Methods), a total of 991,420 injury YLLs were identified overall, of which 714,757 (72%) were in males (S10 Table). These translated into pooled age-standardized rates of 627.9 (95% CI: 522.9 to 733.0) YLLs per 100,000 persons per year overall, 956.6 (95% CI: 782.6 to 1,130.6) in males and 318.9 (95% CI: 271.1 to 366.6) in females (S11 Table).
Fig. 4. Age-standardized TBI YLL rates per 100,000 persons by external cause of death in 16 European countries in 2013. 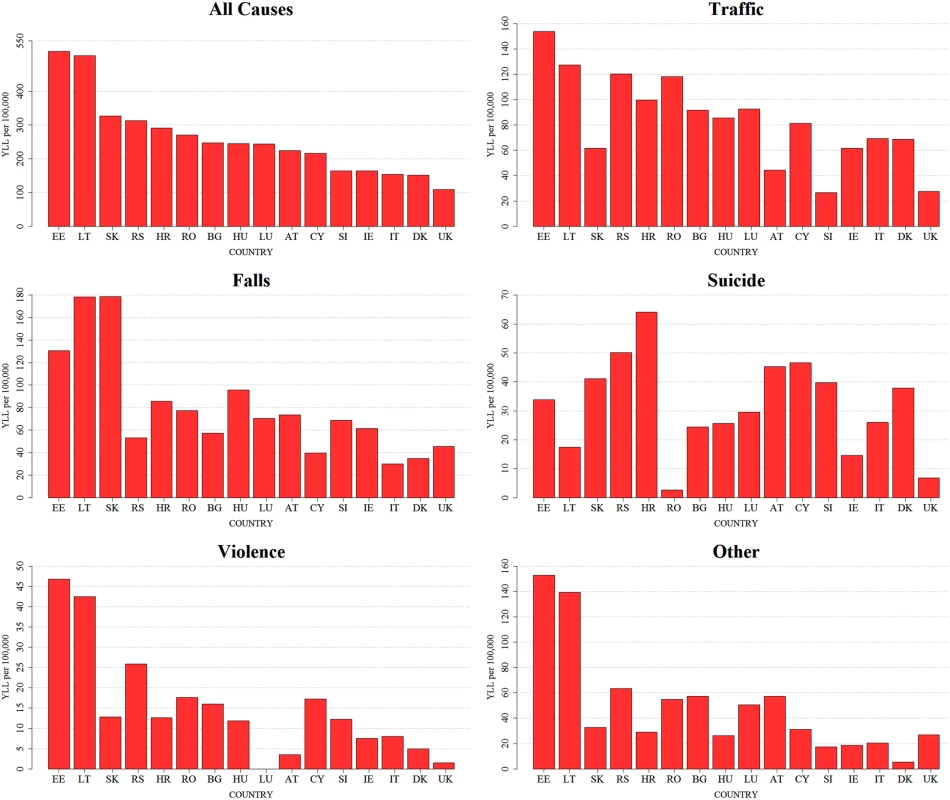
The scaling of the sub-figures has been specifically adapted for each group of causes to better show the variation between the countries. AT, Austria; BG, Bulgaria; CY, Cyprus; DK, Denmark; EE, Estonia; HR, Croatia; HU, Hungary; IE, Ireland; IT, Italy; LT, Lithuania; LU, Luxembourg; RO, Romania; RS, Serbia; SI, Slovenia; SK, Slovakia; TBI, traumatic brain injury; UK, United Kingdom; YLL, year of life lost. TBI YLLs as a proportion of overall injury YLLs are presented in Fig 5 in order to indicate their relative importance (see S1 Fig for sex-specific data). After excluding deaths caused by natural forces, intoxication, and other generalized or unknown causes, TBIs contributed on average 41% (44% in males and 34% in females) of all injury YLLs—with the highest contributions of TBI YLLs in both sexes in the age group 0–4 years (56% in males and 69% in females) (see S12 Table). For comparison purposes, TBI-related YLLs as a proportion of all injury YLLs are also presented without excluding deaths caused by natural forces, intoxication, and other generalized or unknown causes (see S13–S15 Tables).
Fig. 5. Age-standardized injury YLL rates and TBI YLL rates per 100,000 persons in 16 European countries in 2013. 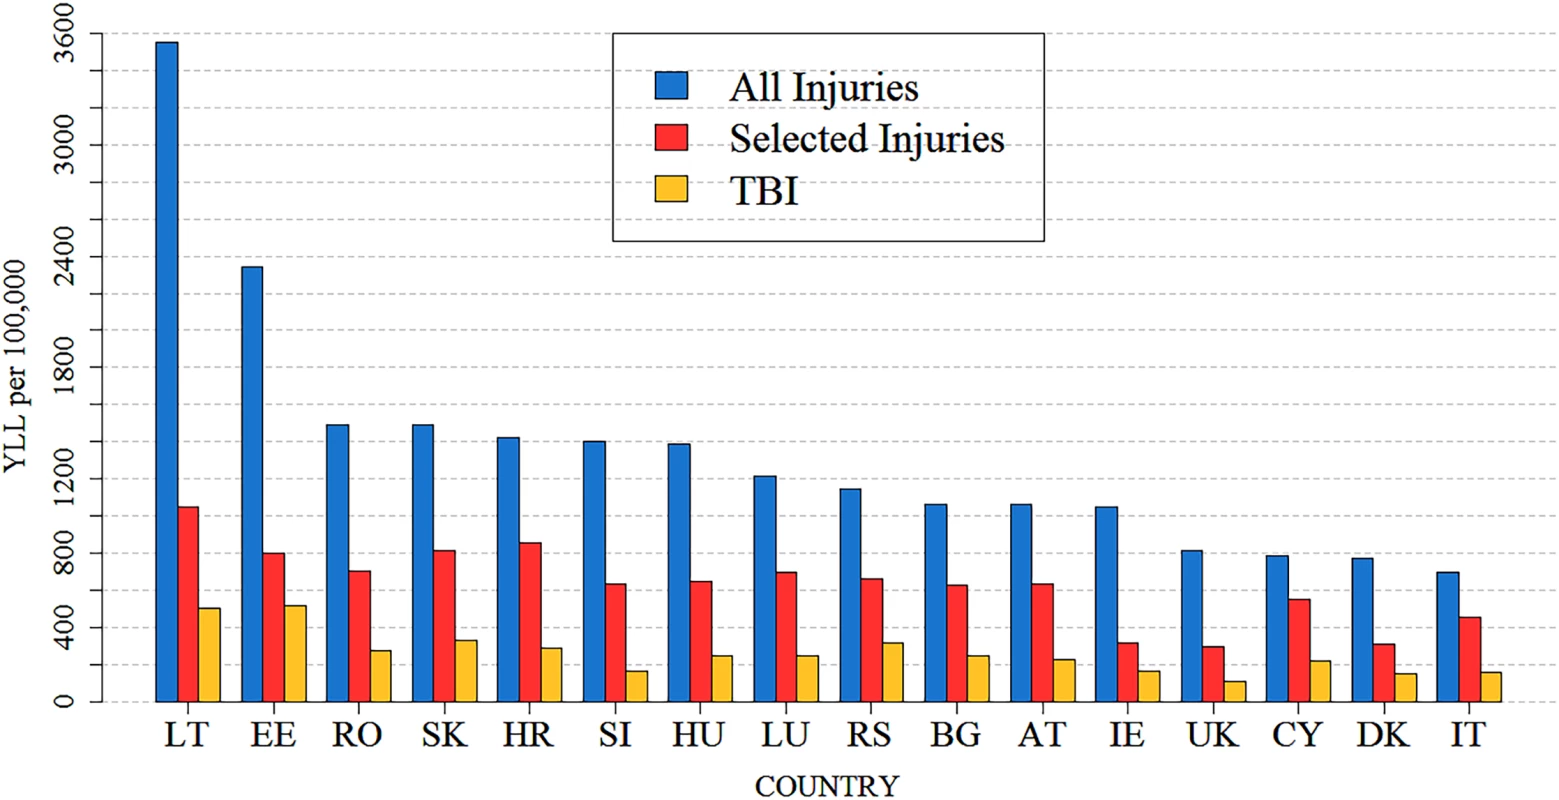
“Selected Injuries” includes the following causes of death: injuries to the head (S00–S09); injuries involving multiple body regions (T00–T07); injuries to unspecified trunk, limb, or body region (T08–T14); certain early complications of trauma (T79); and sequelae of injuries, of poisoning, and of other consequences of external causes (T90–T98). For sex-specific data see S1 Fig. AT, Austria; BG, Bulgaria; CY, Cyprus; DK, Denmark; EE, Estonia; HR, Croatia; HU, Hungary; IE, Ireland; IT, Italy; LT, Lithuania; LU, Luxembourg; RO, Romania; RS, Serbia; SI, Slovenia; SK, Slovakia; TBI, traumatic brain injury; UK, United Kingdom; YLL, year of life lost. In order to provide an estimation of TBI-related YLLs for the EU, the pooled crude rates from our study were extrapolated to the population of the 28 EU member states. These findings are presented in Table 4: based on our pooled rates, 1,319,496 (95% CI: 1,043,675 to 1,595,317) YLLs were attributable to TBI in the EU-28 in 2013 overall, with 1,058,962 (95% CI: 698,748 to 1,419,177) in males and 271,203 (95% CI: 227,211 to 315,196) in the female population.
Tab. 4. Estimated numbers of YLLs in the EU-28 based on extrapolation of pooled crude YLL rates. 
EU-28, 28 member states of the European Union; TBI, traumatic brain injury; YLL, year of life lost. Discussion
Main findings
We conducted a large-scale, cross-sectional, population-based analysis of YLLs due to TBI in 16 European countries for the year 2013. We found that in the selected countries a total of 17,049 TBI-related deaths occurred in 2013. These translated into a total of 374,636 YLLs. The pooled age-standardized rates of YLLs per 100,000 were 259.1 (95% CI: 205.8 to 312.3) overall, 427.5 (95% CI: 290.0 to 564.9) in males, and 105.4 (95% CI: 89.1 to 121.6) in females. Males contributed more substantially to the overall numbers of YLLs than females (282,870 YLLs, 76% of all TBI YLLs), which translated into a rate ratio of 3.24 (95% CI: 3.22 to 3.27). Each TBI death was on average associated with 24.3 (95% CI: 22.0 to 26.6) YLLs overall, 25.6 (95% CI: 23.4 to 27.8) in males and 20.9 (17.9 to 24.0) in females. Falls and traffic injuries were the most common external causes of TBI. TBI contributed on average 41% (44% in males and 34% in females) to overall injury YLLs in the 16 countries. Extrapolating our findings, about 1.3 million YLLs were attributable to TBI in the EU-28 in 2013 overall, 1.1 million in males, and 270,000 in females. To our knowledge, this is the largest and most comprehensive analysis of TBI YLLs in Europe to date.
Interpretation and generalizability
For all our analyses, microdata on causes of death obtained from Eurostat were used. Eurostat collects data on causes of death from countries, which extract them from death certificates in accordance with EU Commission Regulation No 328/2011 on community statistics on public health and health and safety at work [25]. This regulation defines the scope, provides definitions of variables and characteristics of the data, and aims to achieve the highest possible degree of harmonization and comparability of the information obtained from various countries [26]. Thus, to the best of our knowledge, for our study we have used the most valid and comparable data that were available—as such, we believe that the information and comparisons presented in this paper are valid. However, the relatively large between-country differences in YLLs suggest that there still may be factors beyond true country variability affecting the size of this variation. In general, countries follow ICD-10 standards, making the data collection procedures on causes of death relatively homogenous; however, factors such as differences in interpretation and use of ICD-10 rules at the national level, nonapplication of WHO updates, and differences in reporting of deaths of residents abroad and deaths of nonresidents in the reporting country may hinder the general comparability of the data on causes of death [26], and thus the generalizability of our findings.
Besides these systematic factors, country characteristics, such as age distribution and general economy level, may influence the numbers of reported TBI deaths. A recent study that evaluated TBI-related mortality in 25 European countries found that countries with higher gross domestic product tended to have higher TBI death rates. Furthermore, this study reports that the substantial between-country differences in TBI death rates could be driven by varying degrees of attributing death to multiple injuries—countries that reported relatively low numbers of TBI-related deaths at the same time reported relatively high numbers of death due to multiple injuries. Thus, a substantial number of TBI deaths may be in some countries “hidden” under multiple injury deaths [5]. These factors may also have influenced the findings of this study, as both studies used data from the same source. In a similar manner, variations in use of “garbage codes” for cause of death (e.g., general causes such as “unknown” or “other”) may have an influence on the between-country variation observed in this study.
Despite all these issues, by using data routinely collected by an official European authority, based on a specific EU regulation, for the same year, and using the same coding system for case ascertainment, our study overcame many limitations of other types of investigations (such as the heterogeneity of time, case ascertainment, and geographical coverage of studies included in systematic reviews of TBI epidemiology [14–16])—which supports the validity and generalizability of our findings.
Comparison to other studies
To our knowledge, only 2 previous studies have specifically analyzed and reported TBI-related YLLs. A study from the Netherlands [18] reported 118,207 TBI-related YLLs annually for the period of 2010–2012. As data for the Netherlands was not made available by Eurostat for our study, we are not able to directly compare these findings to ours. However, by dividing the number of YLLs reported in the Dutch study by the mean total population of the Netherlands for 2010–2012 according to Eurostat (16,653,712) [22], we were able to obtain a crude YLL rate of 710 per 100,000 persons per year. This rate is higher than that of the highest ranking country in our comparison (Estonia, with a crude TBI-related YLL rate of 525.6). However, it is important to note that the number of deaths in the Dutch study was estimated using average case fatality rates, which further limits the comparability with our findings.
Another study analyzed TBI-related YLLs in New Zealand [12] and reported a total of 14,386 TBI-related YLLs in 2010. Using this value and New Zealand’s 2010 population estimate of 4,353,000 [27] yields a crude rate of TBI-related YLLs of 330.5 per 100,000 persons per year. Such a rate is within the range of crude rates reported for the analyzed countries in our study and is similar to rates we found for Slovakia (319.4), Serbia (319.7), and Croatia (293.3). However, we note that this study used different methods for YLL estimation (e.g., different life table) and a different definition for TBI death, which hinders the general comparability of its findings to ours.
An earlier study assessed the overall burden of injuries in 6 European countries [28]. In both this study and ours, rates of overall injury-related YLLs are reported for Austria, Denmark, and Ireland, and thus can be compared. For Austria the previous study reported 1,710 YLLs per 100,000 persons per year; in our study, the crude rate was 1,078. For Denmark the rates were 1,550 versus 766, and for Ireland the rates were 1,530 versus 1,035. Thus, the rates found in our study are consistently lower, which may be caused by the relatively large time lag between the 2 studies (e.g., 1999 versus 2013).
The pooled age-standardized all injury YLL rate in our study is lower than the global age-standardized YLL rate reported by the Global Burden of Disease Study 2013 [6]—1,355.5 (95% CI: 1,083.8 to 1,627.1) in our study and 2,945 (95% uncertainty interval: 2,796 to 3,129) in the Global Burden of Disease Study 2013 injury study. This might be explained by the fact that the latter study reports a global estimate, and the observed difference may well reflect the patterns of injury deaths globally. On the other hand, the reported global rate falls within the range of age-standardized all injury YLL rates reported in the 16 analyzed countries in our study and is comparable to the rates found in Lithuania (3,554.2 [95% CI: 3,533.0 to 3,575.5]) and Estonia (2,339.1 [95% CI: 2,313.2 to 2,365.1]).
Implications for policy-making and research
In this study we performed to our knowledge the largest and most comprehensive analysis of TBI-related YLLs in Europe to date. Previous studies relied on analyzing and presenting death rates or case fatality rates in order to describe the magnitude of the burden of fatal TBI for the populations of countries [14–16]. Although important, such analyses do not put the problem of TBI deaths into the broader context of social and economic affairs of the respective countries. Our findings emphasize that with each death, large numbers of years of life are lost in the age groups of economically active people, which underlines the significant burden TBI imposes on the economy of countries and the serious impact on the life of families. We quantified the average number of YLLs due to TBI deaths per 100,000 persons and the average number of YLLs per TBI death in 16 countries, and provided these findings stratified by sex, age, and external cause of injury. We believe that this information could facilitate policy-makers in tailoring preventive action so that actions are targeted to the high-risk populations. Communicating the implications of TBI deaths using YLLs as a measure (rather than numbers of deaths) may help the general public to better grasp the magnitude of the problem, and could help to raise awareness about TBI as a major public health problem in general.
Although YLLs provide a more comprehensive measure of the burden of TBI deaths on a population, they do not capture the burden imposed by nonfatal TBI. Our findings can serve as a basis for analysis of the overall burden of TBI using metrics such as DALYs.
Limitations
There are some limitations to this study that we would like to acknowledge. The differences in the calculated YLLs and all related variables inherit all possible bias and errors that were present in the raw data provided for us by Eurostat. We were not able to control these, or mitigate them in any way. All interpretations of our findings should be made with this in mind. The extrapolations to the population of the EU-28 are based on 16 countries, and it is possible that they are biased—they should be considered an estimation only. The reason for analyzing data from 16 countries and extrapolating the results to the whole EU-28 instead of using data from all countries was that the data for the rest of the EU countries were not available in the necessary format or with sufficient detail (e.g., countries did not provide the ICD-10 codes for nature of injury along with the ICD-10 codes for external causes, or they provided data grouped into larger age groups). Although this limits the validity of our extrapolations, the approach seemed justified under the circumstances. In order to analyze the full population burden of TBI, nonfatal cases must also be taken into consideration using metrics such as YLDs or DALYs. In this paper we were not able to estimate these, due to the nonavailability of data. Future research should be oriented towards these analyses.
Conclusions
Our study showed that TBI-related deaths have a substantial impact at the individual and population level in Europe and present an important societal and economic burden that must not be overlooked. We provide information valuable for policy-makers, enabling them to evaluate and plan preventive activities and resource allocation, and to formulate and implement strategic decisions. In addition, our results can serve as a basis for analyzing the overall burden of TBI in the population.
Supporting Information
Zdroje
1. Hyder AA, Wunderlich CA, Puvanachandra P, Gururaj G, Kobusingye OC. The impact of traumatic brain injuries: a global perspective. NeuroRehabilitation. 2007;22(5):341–53. 18162698
2. Maas AI, Stocchetti N, Bullock R. Moderate and severe traumatic brain injury in adults. Lancet Neurol. 2008;7(8):728–41. doi: 10.1016/S1474-4422(08)70164-9 18635021
3. Reilly P. The impact of neurotrauma on society: an international perspective. Prog Brain Res. 2007;161 : 3–9. doi: 10.1016/S0079-6123(06)61001-7 17618966
4. Rubiano AM, Carney N, Chesnut R, Puyana JC. Global neurotrauma research challenges and opportunities. Nature. 2015;527(7578):S193–7. doi: 10.1038/nature16035 26580327
5. Majdan M, Plancikova D, Brazinova A, Rusnak M, Nieboer D, Feigin V, et al. Epidemiology of traumatic brain injuries in Europe: a cross-sectional analysis. Lancet Public Health. 2016;1(2):e76–83. doi: 10.1016/S2468-2667(16)30017-2
6. Haagsma JA, Graetz N, Bolliger I, Naghavi M, Higashi H, Mullany EC, et al. The global burden of injury: incidence, mortality, disability-adjusted life years and time trends from the Global Burden of Disease Study 2013. Inj Prev. 2016;22(1):3–18. doi: 10.1136/injuryprev-2015-041616 26635210
7. Brooks JC, Shavelle RM, Strauss DJ, Hammond FM, Harrison-Felix CL. Long-term survival after traumatic brain injury Part II: life expectancy. Arch Phys Med Rehabil. 2015;96(6):1000–5. doi: 10.1016/j.apmr.2015.02.002 26043195
8. Corrigan JD, Hammond FM. Traumatic brain injury as a chronic health condition. Arch Phys Med Rehabil. 2013;94(6):1199–201. doi: 10.1016/j.apmr.2013.01.023 23402722
9. Roozenbeek B, Maas AI, Menon DK. Changing patterns in the epidemiology of traumatic brain injury. Nat Rev Neurol. 2013;9(4):231–6. doi: 10.1038/nrneurol.2013.22 23443846
10. Majdan M, Mauritz W. Unintentional fall-related mortality in the elderly: comparing patterns in two countries with different demographic structure. BMJ Open. 2015;5(8):e008672. doi: 10.1136/bmjopen-2015-008672 26270950
11. Mauritz W, Brazinova A, Majdan M, Leitgeb J. Epidemiology of traumatic brain injury in Austria. Wien Klin Wochenschr. 2014;126(1–2):42–52. doi: 10.1007/s00508-013-0456-6 24249325
12. Te Ao B, Tobias M, Ameratunga S, McPherson K, Theadom A, Dowell A, et al. Burden of traumatic brain injury in New Zealand: incidence, prevalence and disability-adjusted life years. Neuroepidemiology. 2015;44(4):255–61. doi: 10.1159/000431043 26088707
13. Theadom A, Barker-Collo S, Feigin VL, Starkey NJ, Jones K, Jones A, et al. The spectrum captured: a methodological approach to studying incidence and outcomes of traumatic brain injury on a population level. Neuroepidemiology. 2012;38(1):18–29. doi: 10.1159/000334746 22179412
14. Brazinova A, Rehorcikova V, Taylor MS, Buckova V, Majdan M, Psota M, et al. Epidemiology of traumatic brain injury in Europe: a living systematic review. J Neurotrauma. 2016 Aug 25. doi: 10.1089/neu.2015.4126 26537996
15. Peeters W, van den Brande R, Polinder S, Brazinova A, Steyerberg EW, Lingsma HF, et al. Epidemiology of traumatic brain injury in Europe. Acta Neurochir (Wien). 2015;157(10):1683–96. doi: 10.1007/s00701-015-2512-7 26269030
16. Tagliaferri F, Compagnone C, Korsic M, Servadei F, Kraus J. A systematic review of brain injury epidemiology in Europe. Acta Neurochir (Wien). 2006;148(3):255–68. doi: 10.1007/s00701-005-0651-y 16311842
17. GBD 2015 DALYs and HALE Collaborators. Global, regional, and national disability-adjusted life-years (DALYs) for 315 diseases and injuries and healthy life expectancy (HALE), 1990–2015: a systematic analysis for the Global Burden of Disease Study 2015. Lancet. 2016;388(10053):1603–58. doi: 10.1016/S0140-6736(16)31460-X 27733283
18. Scholten AC, Haagsma JA, Panneman MJ, van Beeck EF, Polinder S. Traumatic brain injury in the Netherlands: incidence, costs and disability-adjusted life years. PLoS ONE. 2014;9(10):e110905. doi: 10.1371/journal.pone.0110905 25343447
19. Eurostat. Causes of death. Luxembourg: Eurostat. Available from: http://ec.europa.eu/eurostat/web/health/causes-death. Accessed 2016 Dec 16.
20. Eurostat. Life table. Luxembourg: Eurostat. Available from: http://appsso.eurostat.ec.europa.eu/nui/show.do?dataset=demo_mlifetable&lang=en. Accessed 2016 Dec 15.
21. Eurostat. Revision of the European standard population—report of Eurostat’s task force. Luxembourg: Publications Office of the European Union; 2013. Available from: http://ec.europa.eu/eurostat/documents/3859598/5926869/KS-RA-13-028-EN.PDF/e713fa79-1add-44e8-b23d-5e8fa09b3f8f. Accessed 2017 May 31.
22. Eurostat. Population. Luxembourg: Eurostat. Available from: http://ec.europa.eu/eurostat/web/population-demography-migration-projections/population-data. Accessed 2016 Dec 15.
23. Borenstein M, Hedges LV, Higgins JPT, Rothstein HR. Introduction to meta-analysis. New York: John Wiley & Sons; 2009. 452 p.
24. Feigin VL, Theadom A, Barker-Collo S, Starkey NJ, McPherson K, Kahan M, et al. Incidence of traumatic brain injury in New Zealand: a population-based study. Lancet Neurol. 2013;12(1):53–64. doi: 10.1016/S1474-4422(12)70262-4 23177532
25. Commission Regulation (EU) No 328/2011 of 5 April 2011. Implementing Regulation (EC) No 1338/2008 of the European Parliament and of the Council on Community statistics on public health and health and safety at work, as regards statistics on causes of death.
26. Eurostat. Causes of death (hlth_cdeath)—reference metadata in Euro SDMX metadata structure (ESMS). Luxembourg: Eurostat. Available from: http://ec.europa.eu/eurostat/cache/metadata/en/hlth_cdeath_esms.htm. Accessed 2016 Dec 15.
27. Statistics New Zealand. Historical population estimates tables. Auckland: Statistics New Zealand. Available from: http://www.stats.govt.nz/browse_for_stats/population/estimates_and_projections/historical-population-tables.aspx. Accessed 2017 Jan 10.
28. Polinder S, Meerding WJ, Mulder S, Petridou E, van Beeck E, Group ER. Assessing the burden of injury in six European countries. Bull World Health Organ. 2007;85(1):27–34. doi: 10.2471/BLT.06.030973 17242755
Štítky
Interní lékařství
Článek vyšel v časopisePLOS Medicine
Nejčtenější tento týden
2017 Číslo 7- Není statin jako statin aneb praktický přehled rozdílů jednotlivých molekul
- Magnosolv a jeho využití v neurologii
- Biomarker NT-proBNP má v praxi široké využití. Usnadněte si jeho vyšetření POCT analyzátorem Afias 1
- Moje zkušenosti s Magnosolvem podávaným pacientům jako profylaxe migrény a u pacientů s diagnostikovanou spazmofilní tetanií i při normomagnezémii - MUDr. Dana Pecharová, neurolog
- Antikoagulační léčba u pacientů před operačními výkony
-
Všechny články tohoto čísla
- Time for trauma immunology
- Translational approaches to coagulopathy after trauma: Towards targeted treatment
- The new survivors and a new era for trauma research
- Research questions in pre-hospital trauma care
- Major scientific lessons learned in the trauma field over the last two decades
- The science of rapid start—From the when to the how of antiretroviral initiation
- Reducing undiagnosed HIV infection among adolescents in sub-Saharan Africa: Provider-initiated and opt-out testing are not enough
- Community and health system intervention to reduce disrespect and abuse during childbirth in Tanga Region, Tanzania: A comparative before-and-after study
- Prescription medicine use by pedestrians and the risk of injurious road traffic crashes: A case-crossover study
- Trauma care: Finding a better way
- Risk of surgical site infection, acute kidney injury, and infection following antibiotic prophylaxis with vancomycin plus a beta-lactam versus either drug alone: A national propensity-score-adjusted retrospective cohort study
- Ammonium tetrathiomolybdate following ischemia/reperfusion injury: Chemistry, pharmacology, and impact of a new class of sulfide donor in preclinical injury models
- Years of life lost due to traumatic brain injury in Europe: A cross-sectional analysis of 16 countries
- Antimicrobial resistance in : Global surveillance and a call for international collaborative action
- Signatures of inflammation and impending multiple organ dysfunction in the hyperacute phase of trauma: A prospective cohort study
- Cellular therapies in trauma and critical care medicine: Looking towards the future
- Leveraging peer-based support to facilitate HIV care in Kenya
- Trends in traumatic brain injury mortality in China, 2006–2013: A population-based longitudinal study
- Temporal profile of intracranial pressure and cerebrovascular reactivity in severe traumatic brain injury and association with fatal outcome: An observational study
- Community health promotion and medical provision for neonatal health—CHAMPION cluster randomised trial in Nagarkurnool district, Telangana (formerly Andhra Pradesh), India
- A comparison of Selective Aortic Arch Perfusion and Resuscitative Endovascular Balloon Occlusion of the Aorta for the management of hemorrhage-induced traumatic cardiac arrest: A translational model in large swine
- Risk of hospitalization with neurodegenerative disease after moderate-to-severe traumatic brain injury in the working-age population: A retrospective cohort study using the Finnish national health registries
- Ultrasound non-invasive measurement of intracranial pressure in neurointensive care: A prospective observational study
- Cancer trials in sub-Saharan Africa: Aligning research and care
- Prehospital immune responses and development of multiple organ dysfunction syndrome following traumatic injury: A prospective cohort study
- Patient-reported outcomes and survival in multiple sclerosis: A 10-year retrospective cohort study using the Multiple Sclerosis Impact Scale–29
- Cerebrovascular pressure reactivity monitoring using wavelet analysis in traumatic brain injury patients: A retrospective study
- Validation of the sensitivity of the National Emergency X-Radiography Utilization Study (NEXUS) Head computed tomographic (CT) decision instrument for selective imaging of blunt head injury patients: An observational study
- Same-day HIV testing with initiation of antiretroviral therapy versus standard care for persons living with HIV: A randomized unblinded trial
- Community burden of undiagnosed HIV infection among adolescents in Zimbabwe following primary healthcare-based provider-initiated HIV testing and counselling: A cross-sectional survey
- Timing of femoral shaft fracture fixation following major trauma: A retrospective cohort study of United States trauma centers
- IL33-mediated ILC2 activation and neutrophil IL5 production in the lung response after severe trauma: A reverse translation study from a human cohort to a mouse trauma model
- Long-term health status and trajectories of seriously injured patients: A population-based longitudinal study
- Multidrug-resistant gonorrhea: A research and development roadmap to discover new medicines
- PLOS Medicine
- Archiv čísel
- Aktuální číslo
- Informace o časopisu
Nejčtenější v tomto čísle- Signatures of inflammation and impending multiple organ dysfunction in the hyperacute phase of trauma: A prospective cohort study
- Multidrug-resistant gonorrhea: A research and development roadmap to discover new medicines
- Patient-reported outcomes and survival in multiple sclerosis: A 10-year retrospective cohort study using the Multiple Sclerosis Impact Scale–29
- Ammonium tetrathiomolybdate following ischemia/reperfusion injury: Chemistry, pharmacology, and impact of a new class of sulfide donor in preclinical injury models
Kurzy
Zvyšte si kvalifikaci online z pohodlí domova
Autoři: prof. MUDr. Vladimír Palička, CSc., Dr.h.c., doc. MUDr. Václav Vyskočil, Ph.D., MUDr. Petr Kasalický, CSc., MUDr. Jan Rosa, Ing. Pavel Havlík, Ing. Jan Adam, Hana Hejnová, DiS., Jana Křenková
Autoři: MUDr. Irena Krčmová, CSc.
Autoři: MDDr. Eleonóra Ivančová, PhD., MHA
Autoři: prof. MUDr. Eva Kubala Havrdová, DrSc.
Všechny kurzyPřihlášení#ADS_BOTTOM_SCRIPTS#Zapomenuté hesloZadejte e-mailovou adresu, se kterou jste vytvářel(a) účet, budou Vám na ni zaslány informace k nastavení nového hesla.
- Vzdělávání


