-
Články
- Vzdělávání
- Časopisy
Top články
Nové číslo
- Témata
- Kongresy
- Videa
- Podcasty
Nové podcasty
Reklama- Kariéra
Doporučené pozice
Reklama- Praxe
Socioeconomic Factors and All Cause and Cause-Specific Mortality among Older People in Latin America, India, and China: A Population-Based Cohort Study
Background:
Even in low and middle income countries most deaths occur in older adults. In Europe, the effects of better education and home ownership upon mortality seem to persist into old age, but these effects may not generalise to LMICs. Reliable data on causes and determinants of mortality are lacking.Methods and Findings:
The vital status of 12,373 people aged 65 y and over was determined 3–5 y after baseline survey in sites in Latin America, India, and China. We report crude and standardised mortality rates, standardized mortality ratios comparing mortality experience with that in the United States, and estimated associations with socioeconomic factors using Cox's proportional hazards regression. Cause-specific mortality fractions were estimated using the InterVA algorithm. Crude mortality rates varied from 27.3 to 70.0 per 1,000 person-years, a 3-fold variation persisting after standardisation for demographic and economic factors. Compared with the US, mortality was much higher in urban India and rural China, much lower in Peru, Venezuela, and urban Mexico, and similar in other sites. Mortality rates were higher among men, and increased with age. Adjusting for these effects, it was found that education, occupational attainment, assets, and pension receipt were all inversely associated with mortality, and food insecurity positively associated. Mutually adjusted, only education remained protective (pooled hazard ratio 0.93, 95% CI 0.89–0.98). Most deaths occurred at home, but, except in India, most individuals received medical attention during their final illness. Chronic diseases were the main causes of death, together with tuberculosis and liver disease, with stroke the leading cause in nearly all sites.Conclusions:
Education seems to have an important latent effect on mortality into late life. However, compositional differences in socioeconomic position do not explain differences in mortality between sites. Social protection for older people, and the effectiveness of health systems in preventing and treating chronic disease, may be as important as economic and human development.
: Please see later in the article for the Editors' Summary
Published in the journal: . PLoS Med 9(2): e32767. doi:10.1371/journal.pmed.1001179
Category: Research Article
doi: https://doi.org/10.1371/journal.pmed.1001179Summary
Background:
Even in low and middle income countries most deaths occur in older adults. In Europe, the effects of better education and home ownership upon mortality seem to persist into old age, but these effects may not generalise to LMICs. Reliable data on causes and determinants of mortality are lacking.Methods and Findings:
The vital status of 12,373 people aged 65 y and over was determined 3–5 y after baseline survey in sites in Latin America, India, and China. We report crude and standardised mortality rates, standardized mortality ratios comparing mortality experience with that in the United States, and estimated associations with socioeconomic factors using Cox's proportional hazards regression. Cause-specific mortality fractions were estimated using the InterVA algorithm. Crude mortality rates varied from 27.3 to 70.0 per 1,000 person-years, a 3-fold variation persisting after standardisation for demographic and economic factors. Compared with the US, mortality was much higher in urban India and rural China, much lower in Peru, Venezuela, and urban Mexico, and similar in other sites. Mortality rates were higher among men, and increased with age. Adjusting for these effects, it was found that education, occupational attainment, assets, and pension receipt were all inversely associated with mortality, and food insecurity positively associated. Mutually adjusted, only education remained protective (pooled hazard ratio 0.93, 95% CI 0.89–0.98). Most deaths occurred at home, but, except in India, most individuals received medical attention during their final illness. Chronic diseases were the main causes of death, together with tuberculosis and liver disease, with stroke the leading cause in nearly all sites.Conclusions:
Education seems to have an important latent effect on mortality into late life. However, compositional differences in socioeconomic position do not explain differences in mortality between sites. Social protection for older people, and the effectiveness of health systems in preventing and treating chronic disease, may be as important as economic and human development.
: Please see later in the article for the Editors' SummaryIntroduction
Mortality among older people is a neglected topic in global health. In 2005, 30.2 million of the 58.8 million deaths worldwide occurred in people aged 60 y and older, accounting for 84% of deaths in high income countries, 61% in middle income countries, and 33% in low income countries [1]. Seventy-six percent of the deaths among older people occurred in low and middle income countries (LMICs) [1], where chronic diseases are fast replacing communicable diseases as the leading causes of death and disability [2]. For these countries, the study of old-age mortality trends and their life course determinants is becoming increasingly relevant [3].
In Europe, the protective effects of better education and home ownership upon mortality seem to persist into old age, although with attenuation of the gradient from middle into late life [4]. These findings may not generalise to LMICs, where the social patterning of disease is complex, and evolving rapidly with the epidemiologic and demographic transitions. In settings in the early stages of transition, cardiometabolic risk factors are often found to be more prevalent among the better educated and most affluent [5]. The inversion of social gradients as the less advantaged become more exposed is likely to be an important driver of the epidemic of chronic diseases [6],[7]. On the other hand, inequities in access to health care, which are particularly pronounced for older people in many LMICs [8], favour those with higher status and more resources. Findings from the few population-based studies of determinants of mortality among older people in LMICs are somewhat inconsistent. In Wuhan, China [9], less education, fewer household assets, and financial strain were univariately associated with mortality risk, but only education was significantly associated in the fully adjusted model. In the China Healthy Longevity Longitudinal Survey neither parental occupational status nor the index older person's educational level or occupational attainment was associated with mortality [10]. However, “economic independence” in late life (adequacy of personal economic resources) was strongly inversely associated. In Bambui, Brazil, educational level was inversely associated with mortality risk [11]. In Matlab, Bangladesh, having at least some education and having some household assets were independently associated with lower mortality for both sexes [12]. In the 1998–1999 Indian National Family Health Survey, in contrast to the pattern observed for younger adults, caste had a stronger effect on mortality rates for those aged 65 y and over than did standard of living [13].
In most countries, particularly those with low and middle incomes, death registration is incomplete, and the quality of information on cause of death is highly variable [14]. This is an important limitation to the development and implementation of policy to improve health, and the use of surveys has been advocated to complement official registration procedures [14]. Verbal autopsy (VA) interviews with key informants (family members, carers, or friends) are an important part of this approach, particularly when medical help-seeking is infrequent, and a high proportion of deaths occur at home [15],[16]. Methodologies for VA have been increasingly refined with a focus on harmonisation, and the World Health Organization recommendations now advocate a more standard and structured interview approach, although the recommendations lack specific guidance on timing, respondent characteristics, and interpretation [17]. While assigning cause of death is still complex and problematic, computer-based probabilistic models that generate cause-specific mortality fractions at the population-level provide a faster, cheaper, and more internally consistent alternative to case-by-case physician interpretation [15],[18].
In this paper we aim to provide a comprehensive overview of patterns of mortality among older people as observed through the follow-up period between baseline and incidence waves of the 10/66 Dementia Research Group catchment area studies in Latin America, India, and China. Specifically, we set out to compare mortality rates; to describe the circumstances and antecedents of death; to analyse, from a life course perspective, the effects of socioeconomic conditions (education, mid-life occupational attainment, and late-life household assets and food insecurity) on mortality risk; and, finally, to describe cause-specific mortality fractions and rank the five main causes of death for each site.
Methods
Ethics Statement
The study was approved by local ethical committees in each country and by the King's College London Research Ethics Committee. Participants were recruited following informed signed consent. Those who were unable to provide consent themselves were recruited on the basis of a relative's signed agreement. Illiterate persons were read the information sheet and consent form, and invited to express their consent verbally, which was witnessed.
Sample
The protocol for the 10/66 Dementia Research Group baseline and incidence waves is described in detail in an open-access publication [19]. One-phase population-based surveys were carried out between 2003 and 2005 of all people aged 65 y and over living in seven urban and three rural sites in seven LMICs. Each site comprised one or more geographically defined catchment areas, chosen purposively and door-knocked to identify all eligible participants aged 65 y and over. Urban sites were selected to comprise mixed or mainly lower socioeconomic status households; exclusively high income or professional districts were excluded. Urban sites were located in Cuba (Havana and Matanzas), Dominican Republic (Santo Domingo), Venezuela (Caracas), Peru (Lima), Mexico (Mexico City), China (Xicheng, Beijing), and India (Chennai). Rural sites—selected to be remote from major population centres, with agriculture and related trades as the main local employment—were located in Peru (Canete Province), Mexico (Morelos State), and China (Daxing, Beijing Province). The original target sample size for each country was between 2,000 and 3,000 individuals. The 10/66 Dementia Research Group protocol for the baseline survey included a clinical interview, an informant interview, and a physical examination. In the incidence wave we sought to trace and re-interview all baseline survey participants. We first called on their residence at baseline, revisiting on up to four occasions. Where the participant was no longer resident, we sought information regarding their vital status (if known) and/or current residence, assisted by having recorded at baseline the names and addresses of three non-coresident friends or family members. Where participants had moved away, we sought to re-interview them, even if they had moved out of the original catchment area, by telephone if necessary. Where a participant had died, we recorded date of death, and completed a VA interview with a suitable key informant.
Measures
Sociodemographic information was collected at baseline on all participants. For the current analysis we use information on age in years, sex, educational level (coded 1 = none, 2 = did not complete primary, 3 = completed primary, 4 = completed secondary, 5 = completed tertiary education; interviewers coded the highest level applicable), and number of household assets (car, television, refrigerator, telephone, mains electricity, mains water, plumbed toilet). Occupational attainment was ascertained from the answer to the question “What is the best (highest level) job you have ever had?” This was coded into four summary categories from nine possible codings: 1 = professional (manager/administrator, professional, associate professional), 2 = clerical or trade (clerical worker or shop keeper), 3 = skilled or semi-skilled manual worker, 4 = unskilled labourer (labourer or agricultural worker). The occupational attainment of the spouse was substituted if that of the index participant was not coded, or coded at a lower level. Food insecurity was assessed through response to the question “Do you ever go hungry because there is not enough food to eat?” Receipt of an occupational or government pension was ascertained by asking participants to report all sources of income and the amounts received.
Death/Cause of Death
To obtain information on circumstances of death, and likely cause, we used the World Health Organization's “Standard Verbal Autopsy Questionnaire 3: Death of a Person Aged 15 Years and Above” [20] to interview a key informant, usually a family member of the deceased. The fully structured interview covers information regarding the date and place of death, and medical help-seeking for the final illness, and includes 95 questions concerning signs and symptoms noted during the final illness. Responses to these questions were used to compile a data input file (comprising yes/no indicators) for the InterVA model (version 3.2; http://www.interva.net). InterVA's Bayesian algorithm [15],[21] calculates probabilities that a particular death was due to particular causes, given a set of symptoms and circumstances of death. The model, developed by an expert panel, generates up to three likely causes of death from 35 intentionally relatively broad categories, with probabilities attached [15].
Analyses
We used the 10/66 Dementia Research Group data archive (mortality 3.4) and Stata 11.0. For each site, we describe the number and proportions of baseline participants for whom vital status was determined, the number of deaths, and the number and proportion of those for whom VA interviews were completed. We calculated crude mortality rates per 1,000 person-years at risk. Age - and sex-specific mortality rates were estimated for each country, by sex and age in 5-y bands, by dividing number of deaths by number of person-years contributed in each age band. Direct standardisation (for age, sex, education, occupational attainment, number of assets, and food insecurity) was used to compare mortality rates among sites, with the whole sample as the standard population. We conducted direct standardisation for age, sex, education, assets, occupational class, and food insecurity by weighting each participant with a sampling probability weight equal to the ratio of the frequency of the occurrence of the combination of standardisation variable strata recorded for that participant in the standard population (all sites combined) and the frequency of the occurrence of this combination in the participant's site. We then estimated the mortality rate per 1,000 person-years for each site, applying weights when summing the numerator and denominator. We used indirect standardisation against US Centers for Disease Control and Prevention national mortality data (applying age - and sex-specific US national mortality rates) [22] to age - and sex-specific person-years of follow-up for each 10/66 Dementia Research Group site to compare the burden of late-life mortality in our samples with that currently experienced in the US, reporting standardised mortality ratios (SMRs) with 95% CIs.
We attempted to assess the possible extent and direction of bias arising from non-ascertainment of vital status at follow-up, by assessing univariate associations between baseline characteristics (age, sex, education, WHODAS 2.0 disability score, and dementia status—all likely mortality risk indicators) and vital status not being ascertained. We then used the same predictors of mortality to predict from a multivariate logistic model the probability of death for each individual (including those whose vital status was not ascertained) during the follow-up period. We then compared the distribution of these probabilities in each site between those whose vital status was and was not ascertained at follow-up.
We used Cox's proportional hazards regression to estimate the effects of age (per 5-y band), sex (men compared with women), education (per level), occupational attainment (per level), number of household assets, food insecurity, and pension receipt (yes versus no) on all cause mortality. We ran two sets of models, one adjusting only for age and sex, and the second mutually adjusting for all seven covariates, separately for each site, and then using a fixed effects meta-analysis to combine coefficients, and Higgin's I2 to estimate the degree of heterogeneity, with approximate 95% CIs. Where heterogeneity was statistically significant we also present pooled estimates from random effects models. Given previous evidence for attenuation of socioeconomic gradients with increasing age, we tested for interactions with age for all socioeconomic indicators. We also tested for interactions of sex by education and sex by occupational attainment, since these exposures might have different life course implications for men and women. All estimates were adjusted for household clustering and accompanied by robust 95% CIs.
We compared cause-specific mortality fractions for the InterVA causes relevant to older people, by site, describing the estimated numbers and proportions of deaths by cause. For this purpose, we generated a “cause level” output data file in which each deceased person had up to four records, up to three for each cause and a residual “indeterminate” category, with a weight corresponding to their estimated probability. Thus, the sum of the weights equalled the number of cases, and all descriptive analyses on cause of death were weighted appropriately. To compare the five leading causes of death across sites we further aggregated causes, guided by International Classification of Diseases 10 categories [18], combining acute with chronic cardiac death (heart disease), pneumonia/sepsis with acute respiratory disease (respiratory infection), and suicide with homicide, transport-related accident, and other fatal accident (external causes).
Results
The cohort at baseline comprised 13,924 participants at risk (Tables 1 and S1). The median follow-up period ranged from 2.8 to 5.0 y by site, with a total of 47,438 person-years of observation. The vital status of 12,373 participants (88.9%) was determined, with 2,306 deaths occurring during the follow-up period, for which 2,138 VA interviews were completed. The proportion deceased at follow-up was higher in China, the Dominican Republic, and Cuba than in other countries (in part a function of the longer follow-up interval in those sites). The mean age at baseline was lower in the sites in Venezuela, rural China, and urban India. Women preponderated in all sites. Levels of education were notably lower in the sites in the Dominican Republic, Mexico, India, and rural China, where half to three-quarters had not completed primary education. Occupational attainment was lowest in the Dominican Republic, and in the rural sites in Peru, Mexico, and China. The prevalence of food insecurity was highest in the sites in the Dominican Republic, rural Peru, rural Mexico, and India, and pension coverage was particularly limited in the sites in the Dominican Republic, rural Mexico, rural China, and urban India.
Tab. 1. Cohort characteristics. 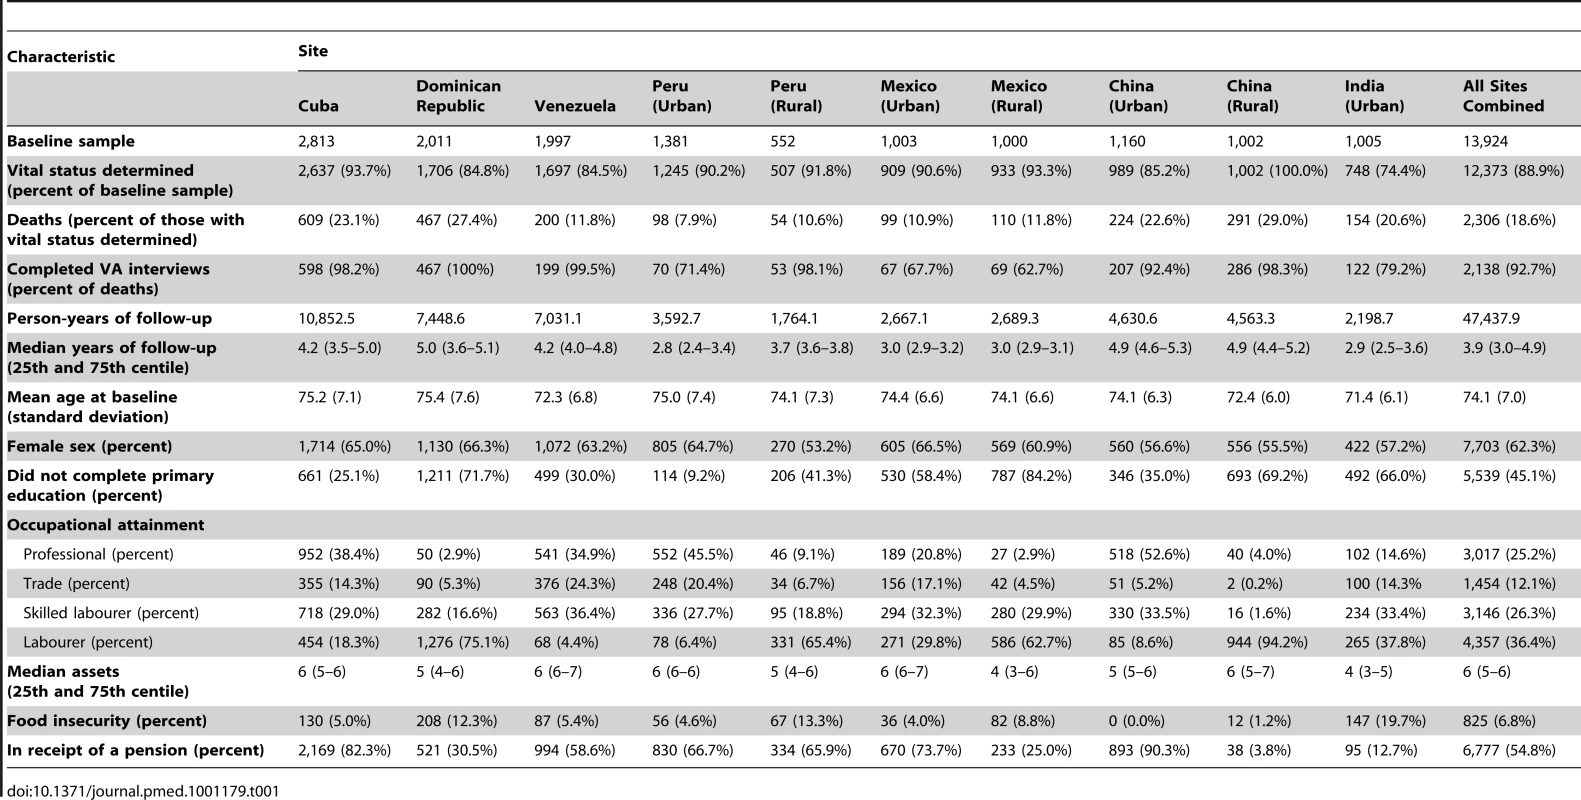
Circumstances of Death
In the sites in rural Peru and urban China, most deaths (86.8% and 70.1%, respectively) occurred in hospital, whereas in rural China, India, and rural Mexico, the large majority of deaths occurred at home (91.3%, 86.3%, and 65.2%, respectively); in other sites deaths were more evenly distributed between home and health care settings (Table 2). Other than in the India site, the large majority of individuals had received some treatment for their terminal illness (79.5% to 97.5%, by site). Other than for sites in rural Peru and India, home was nearly as frequently, if not more frequently, mentioned as hospital, as a venue for medical care. Community clinics were comparatively rarely used.
Tab. 2. Circumstances of death, by site. 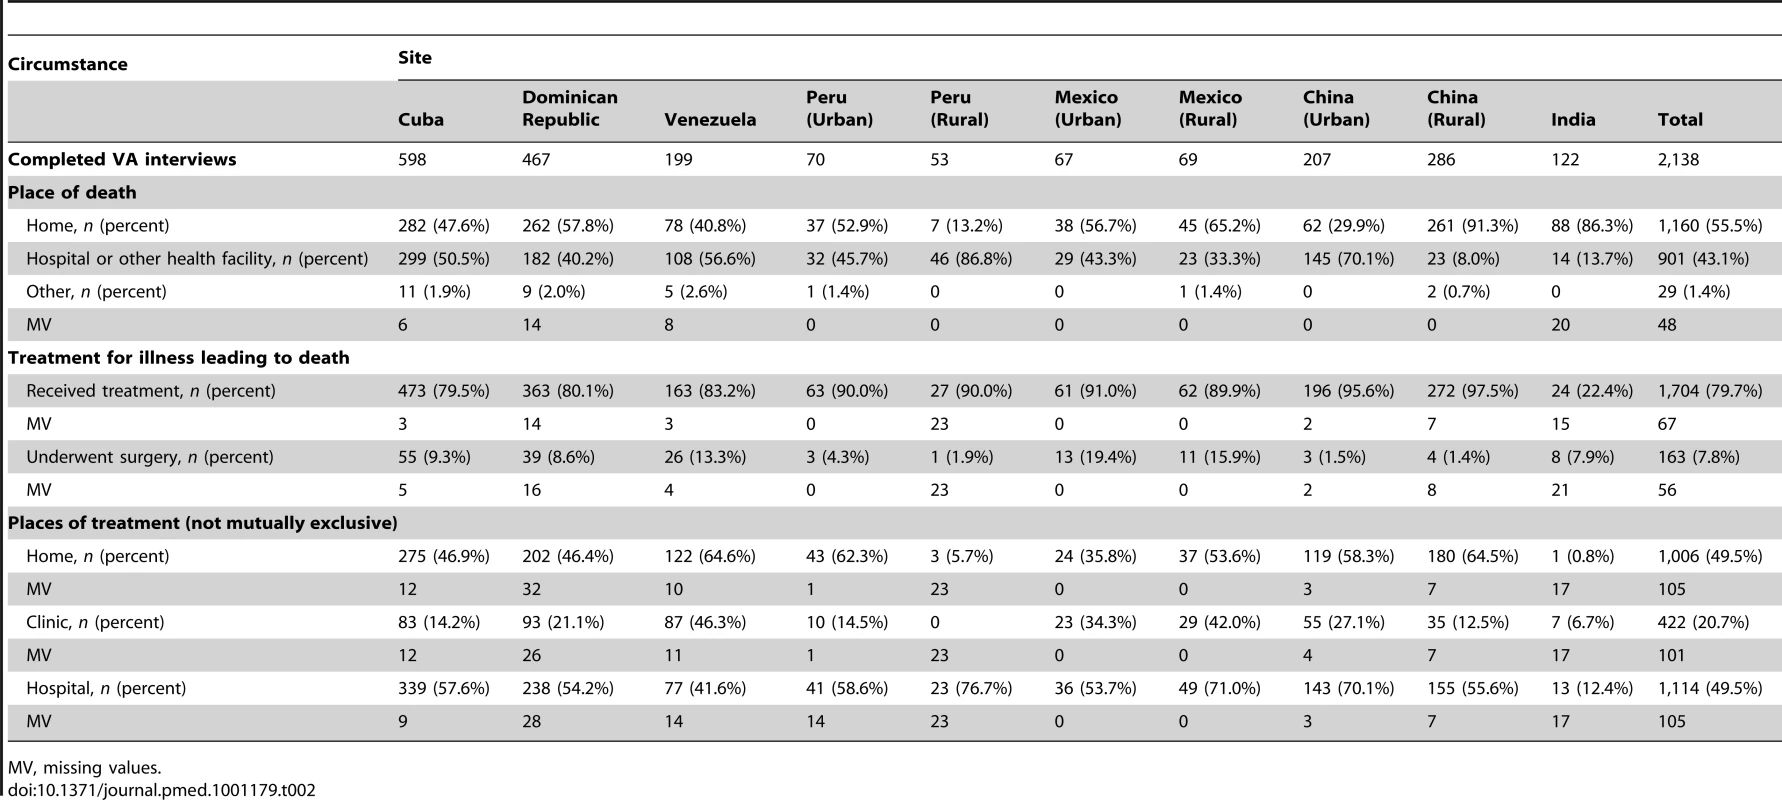
MV, missing values. Mortality Rates
Crude mortality rates varied from 27.3 (urban Peru) to 70.0 (urban India) per 1,000 person-years. Rates were higher among men in all centres and tended to increase exponentially with increasing age for both sexes (Figures 1 and 2; Table S2). In countries where both rural and urban sites were sampled, rates tended to be slightly higher in rural settings. Direct standardisation for age, sex, education, occupational attainment, and number of assets had little effect on the variation among sites, with standardised rates ranging from 20 (rural Peru) to 60 (rural China and urban India) per 1,000 person-years (Table 3). After indirect standardisation, applying age - and sex-specific US national population mortality rates [22], mortality was higher than in the US in the 10/66 Dementia Research Group sites in urban India (SMR 198, 95% CI 168–332), rural China (SMR 162, 95% CI 145–182), the Dominican Republic (SMR 124, 95% CI 113–136), and Cuba (SMR 112, 95% CI 104–112); similar in urban China; but significantly lower in urban Peru (SMR 57, 95% CI 46–69), rural Peru (SMR 63, 95% CI 48–82), Venezuela (SMR 71, 95% CI 62–82), and urban Mexico (SMR 82, 95% CI 67–99).
Fig. 1. Mortality rate (per 1,000 person-years) by age group for each site among women. 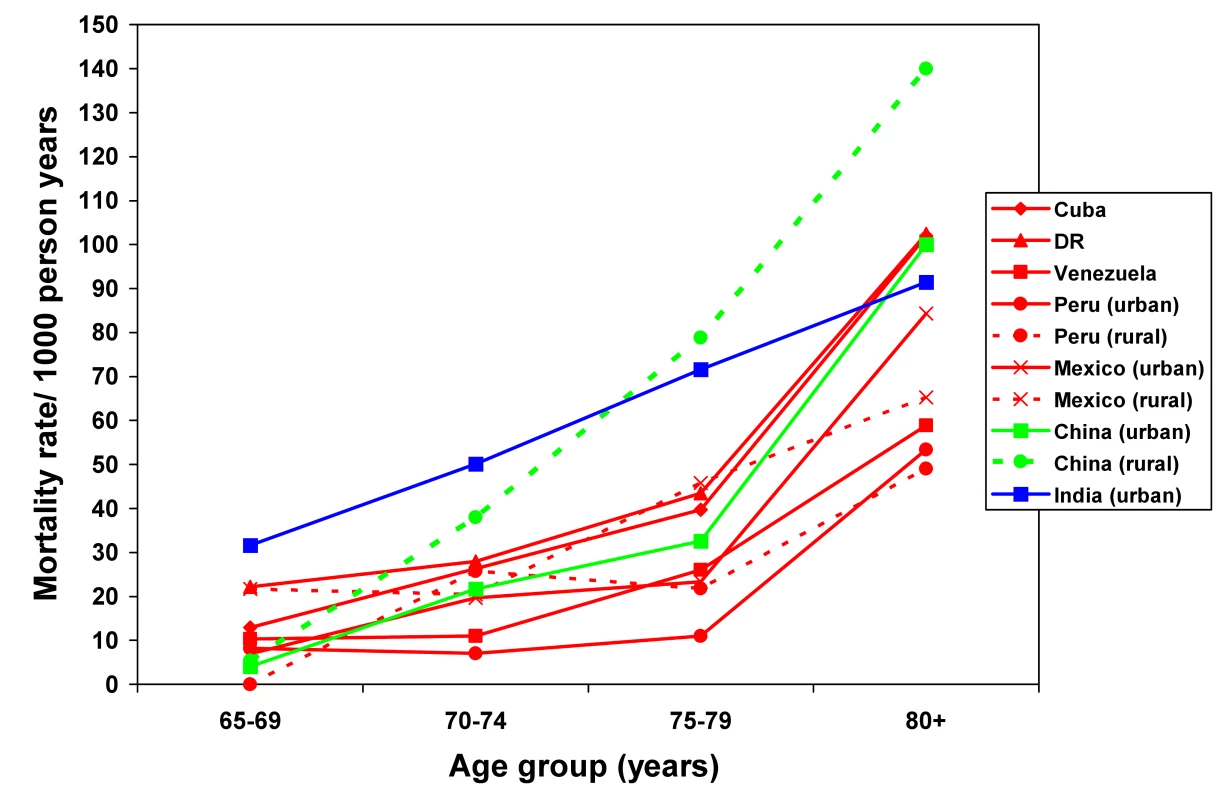
DR, Dominican Republic. Fig. 2. Mortality rate (per 1,000 person-years) by age group for each site among men. 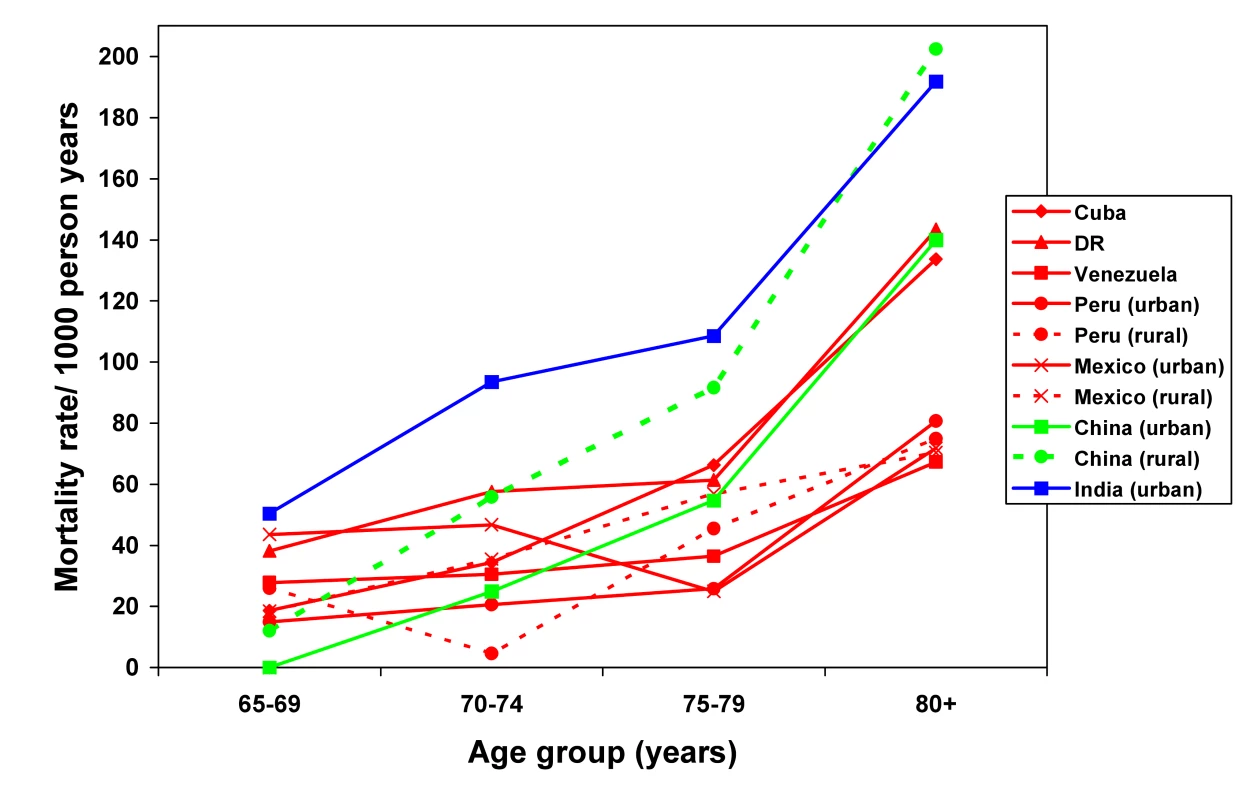
DR, Dominican Republic. Tab. 3. Total and sex-specific mortality rates (per 1,000 person-years) among people aged 65 and over and standardized mortality ratio. 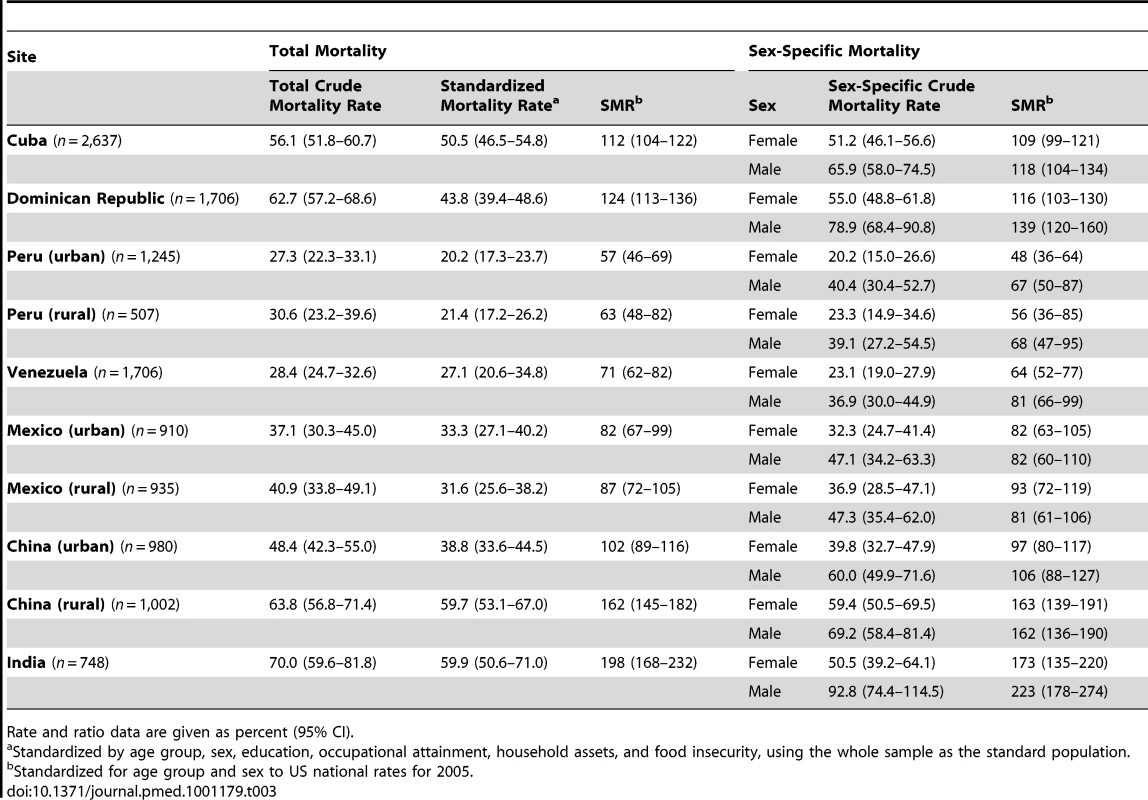
Rate and ratio data are given as percent (95% CI). Potential Bias Arising from Non-Ascertainment of Vital Status
Of the likely predictors of mortality (baseline age, sex, education, WHODAS 2.0 disability score, and dementia), sex and disability were not associated with ascertainment of vital status at follow-up in any site (Table S3). Those with more education at baseline and younger participants were more likely not to be traced in the urban China site. Those with dementia at baseline were more likely not to have their vital status ascertained in the urban Mexico site (Table S3). The predicted probability of death by follow-up, derived from logistic regression using all of the above predictors, was similar for all sites between those who were and were not followed-up, other than in the urban Mexican site (24% higher predicted probability of death among those in whom vital status was not ascertained) and urban China (24% lower predicted probability of death among those in whom vital status was not ascertained) (Table S4).
Demographic and Socioeconomic Predictors of Mortality
Older age was significantly associated with mortality in all sites, whether adjusted for sex alone (Table 4), or for sex and socioeconomic indicators (Table 5). There was substantial and significant heterogeneity (I2 = 72%) in the size of this effect across sites; in the fully adjusted model the random effects pooled mortality hazard increased by 1.57 (95% CI 1.47–1.67) for each 5-y age band. The effect of male sex was statistically significant in all sites other than rural Peru and rural Mexico, with minimal heterogeneity, and was, if anything, slightly enhanced after controlling for socioeconomic indicators (fully adjusted pooled hazard ratio [HR] 1.59, 95% CI 1.45–1.74). Adjusting for age and sex, it was found that less education, lower occupational attainment, and food insecurity were each associated with increased mortality risk after pooling coefficients across sites, with no or minimal heterogeneity of effect among sites (Table 4). Heterogeneity was more pronounced for household assets (I2 = 47%), with protective effects of more assets being mostly apparent in the sites in Cuba and the Dominican Republic, and for pension receipt (I2 = 39%), where despite a generally protective effect, the 3.8% of individuals receiving a pension in rural China had an increased mortality (HR 1.97, 95% CI 1.16–3.36). After mutual adjustment for each of the other socioeconomic indicators in the fully adjusted model, the effects were all slightly attenuated (Table 5). After pooling, there was still evidence of an independent, consistent protective effect of more education (pooled HR 0.93, 95% CI 0.89–0.98). There was no evidence for effect modification by age for any of the socioeconomic indicators: education (pooled HR 1.03, 95% CI 0.99–1.07, I2 = 8%), occupational attainment (1.02, 95% CI 0.98–1.07, I2 = 0%), assets (1.01, 95% CI 0.98–1.04, I2 = 63%), or food insecurity (0.87, 95% CI 0.76–1.00, I2 = 0%). Neither was there evidence that the effects of education (pooled HR for interaction term 1.04, 95% CI 0.96–1.13, I2 = 33%) or occupational attainment (0.95, 95% CI 0.87–1.05, I2 = 0%) were modified by sex.
Tab. 4. Age- and sex-adjusted hazard ratios for the associations between sociodemographic factors and mortality, by site. 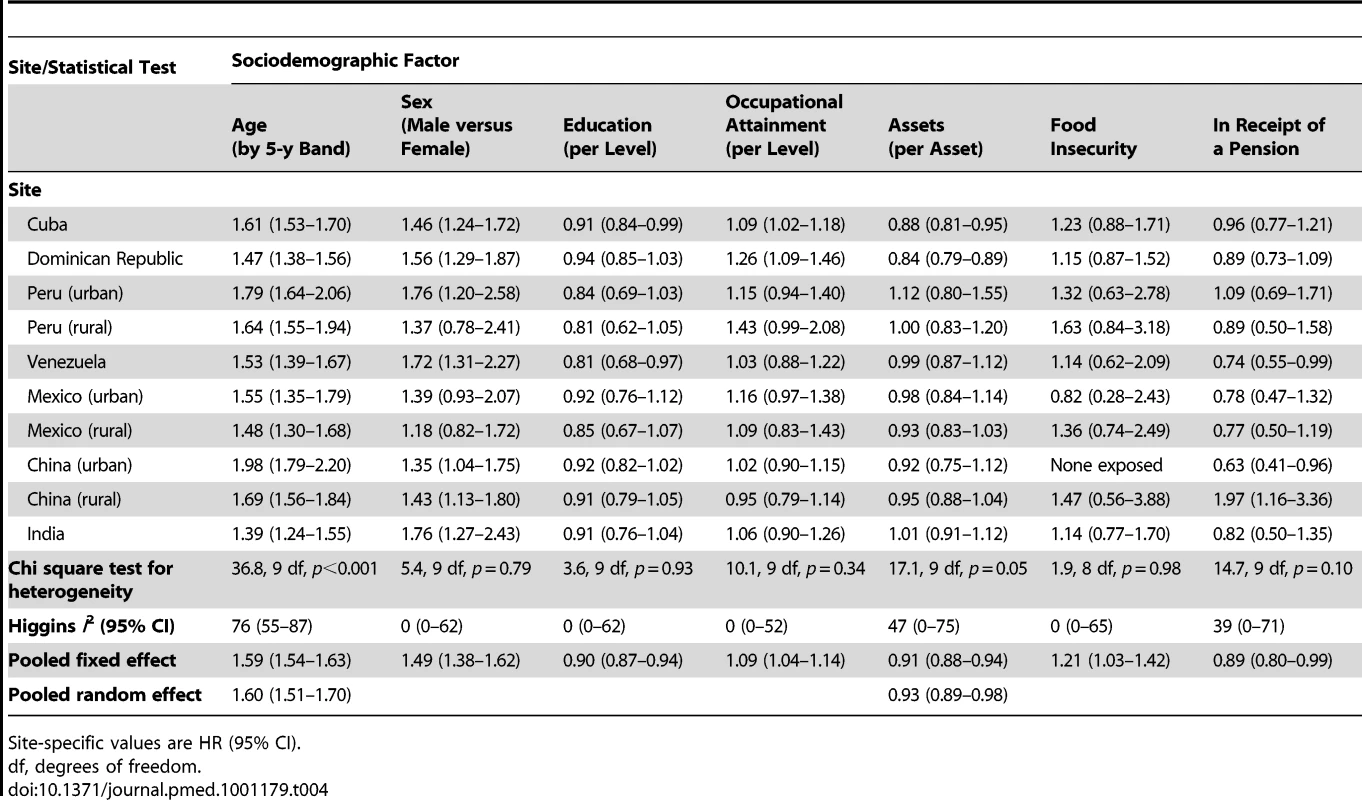
Site-specific values are HR (95% CI). Tab. 5. Mutually adjusted hazard ratios for the associations between sociodemographic factors and mortality, by site. 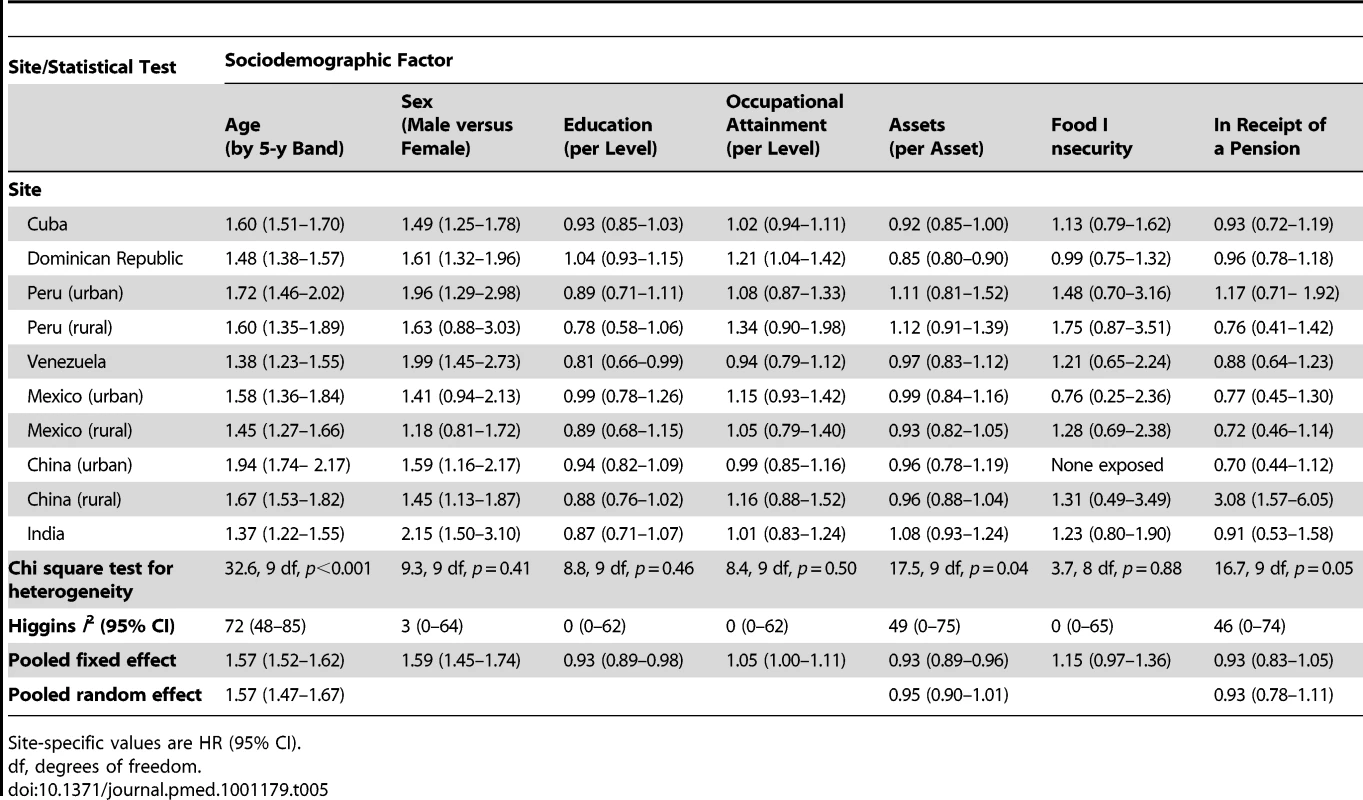
Site-specific values are HR (95% CI). Cause of Death
Table 6 describes the estimated cause-specific mortality fractions for each site for the 21 causes generated by the InterVA algorithm. The proportion of indeterminate causes ranged from 21.7% to 28.1% in the Latin American sites, but was somewhat higher in urban China (31.7%), rural China (32.6%), and India (41.8%). The five leading causes of death for each site are listed in Table 7. Stroke was by far the most common cause overall (21.4%), and was the leading or joint-leading cause of death in all sites other than rural Peru (third leading cause) and rural Mexico (fourth leading cause). Heart disease (7.4% of all deaths) was also among the leading causes of death in all sites other than Mexico, rural China, and India. Diabetes (6.1% of all deaths) was among the leading causes in all sites other than the Dominican Republic, rural Peru, and rural China. Chronic diseases as a whole (stroke, heart disease, diabetes, chronic respiratory disease, and malignancy) accounted for the majority of deaths where the cause was determined in all sites other than rural Peru (23.6% of all deaths and 31.7% of determined deaths). Other important causes of death included liver disease (accounting for 10% or more of deaths in rural Peru, Venezuela, and urban and rural Mexico) and tuberculosis (accounting for 10% or more of deaths in rural Peru, urban Mexico, and urban and rural China and India).
Tab. 6. Cause-specific mortality fractions as interpreted probabilistically by the InterVA model for each site. 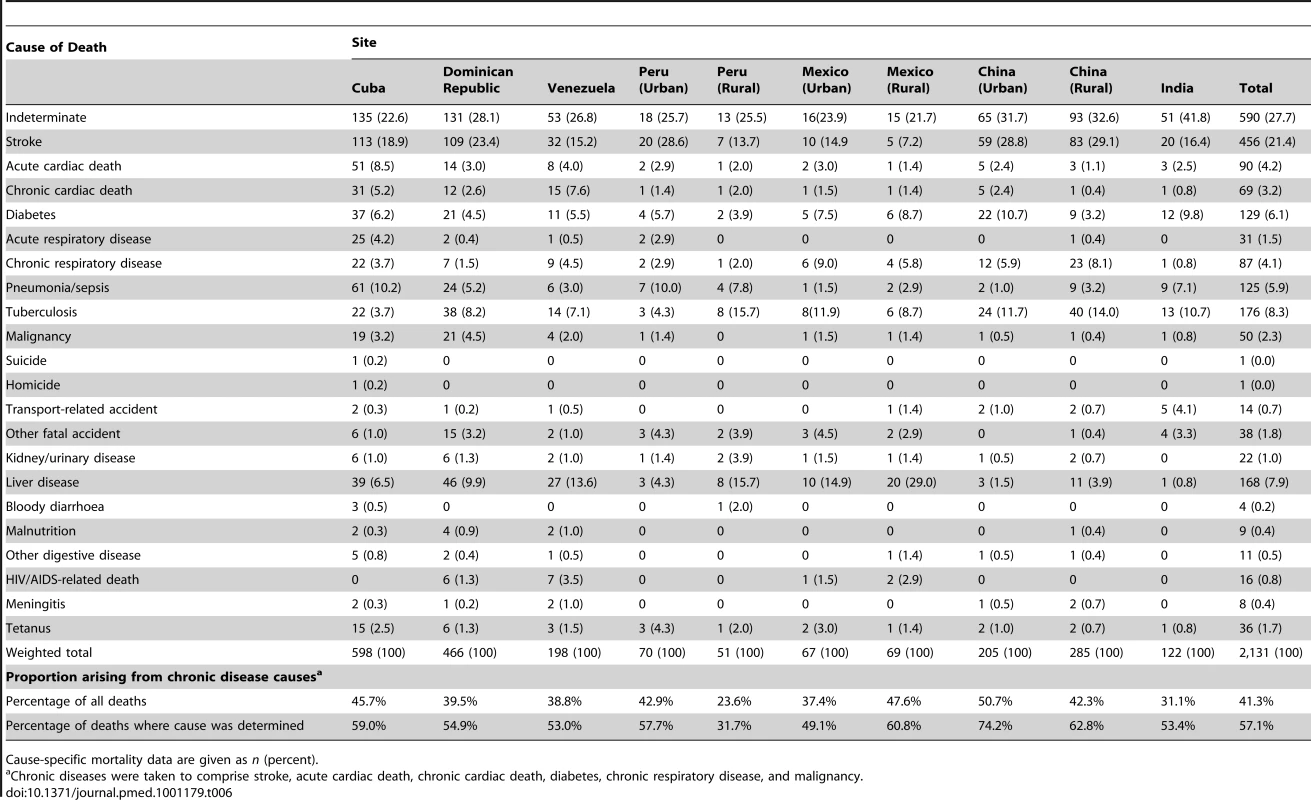
Cause-specific mortality data are given as n (percent). Tab. 7. Five leading causes of death by site, using cause of death as interpreted probabilistically by the InterVA model. 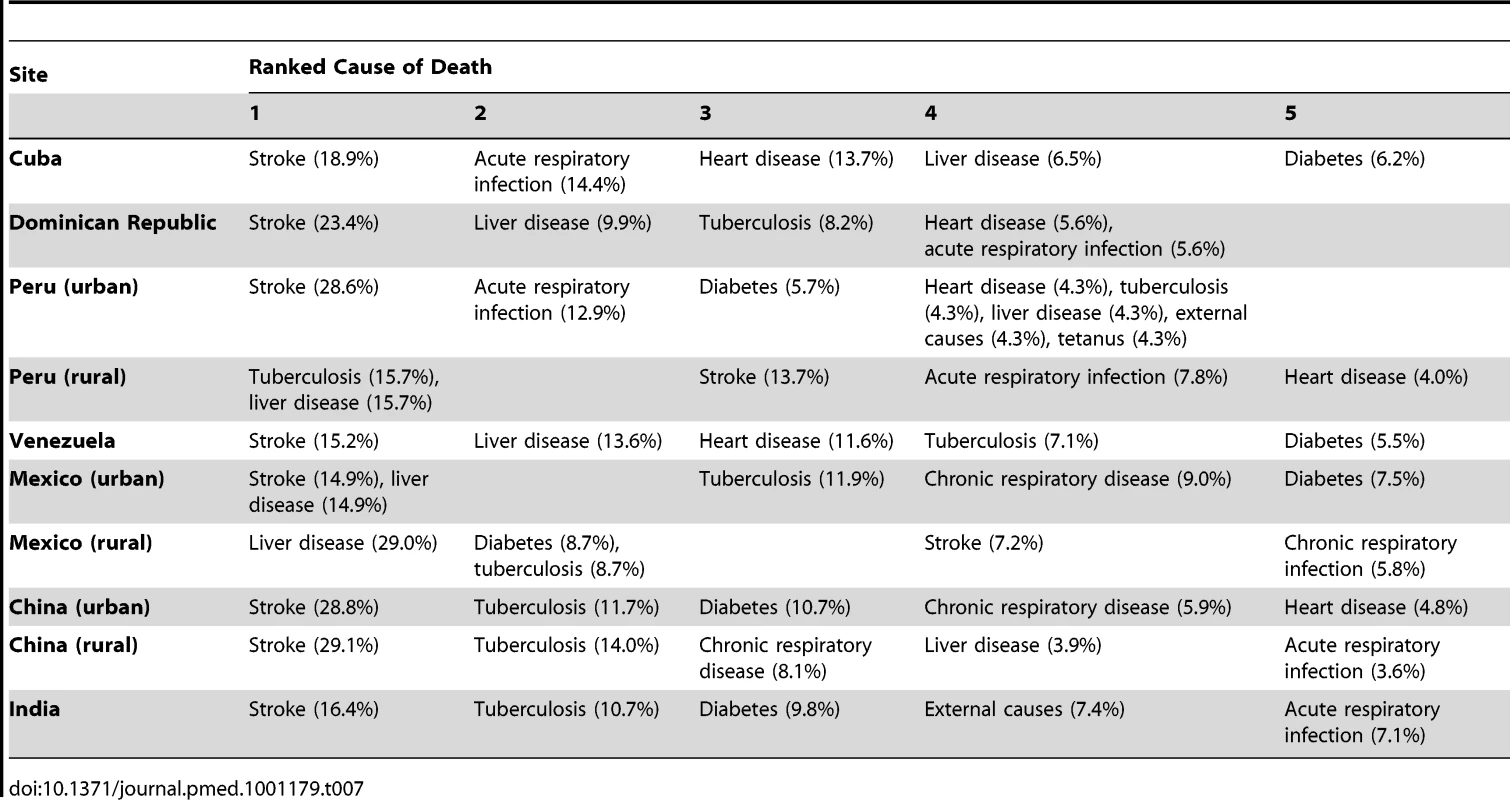
Discussion
In this catchment area population-based longitudinal study of mortality among older people, there was a 2.6-fold variation in crude rates between sites. Lower levels of education and occupational attainment in earlier life, fewer household assets, food insecurity, and not receiving a pension in later life were associated with mortality; less education remained independently associated after mutual adjustment. There was still a 3-fold variation in mortality rates among sites after standardising for compositional differences in age, sex, and all socioeconomic indicators. Compared with national age - and sex-specific rates in the US, rates in India and rural China were substantially higher, and rates in Peru and Venezuela substantially lower. In most sites a substantial minority or small majority of older people died at home. Nevertheless, other than in India, most had sought some medical attention in the course of their final illness, which tended to be provided at home or in hospital, rather than in a community health centre. Chronic diseases, most particularly stroke, heart disease, and diabetes, were the leading causes of death in all sites other than rural Peru.
Strengths and Limitations
The main strengths of this study are the successful application of a uniform methodology to ascertain deaths and determine cause of death across urban and rural catchment area sites in Latin America, China, and India. The baseline survey data allowed us to study, prospectively, the effects of a range of potentially relevant social determinants. Although we did not keep the catchment area populations under continuous surveillance, we were able to determine the vital status of 12,373 of 13,924 (88.9%) baseline participants, identifying 2,306 deaths among them, of which 2,138 (92.7%) had completed VA interviews. A significant limitation is that our samples are not nationally representative, and hence our findings refer to the catchment areas studied and may not generalise to other urban or rural locations in the countries concerned. Although the study was prospective, education and occupational attainment exposures were recalled and may have been subject to random error and information bias. Older people who had become frail or unwell may have moved to live with children or other relatives; the household assets that were recorded may not therefore have reflected those that they were generally exposed to in later life [3],[23]. Likewise, food insecurity may have arisen as a consequence rather than as a cause of ill health leading to death. Our selection of predominately lower socioeconomic status or mixed neighbourhoods for our catchment areas may have somewhat constrained the variance of socioeconomic exposures, leading to underestimation of their effects.
The low mortality rates observed in sites in Peru, Venezuela, and urban Mexico may be due to underascertainment, to the extent that deaths were overrepresented among those not traced (and hence for whom vital status could not be determined). The proportion not traced (10%–15%) was not particularly high in these sites. Our supplementary analyses, conducted to explore the likely extent and direction of bias, supported the possibility of an underestimation of mortality rates only in urban Mexico, where dementia at baseline was overrepresented in those not traced, for whom the predicted probability of death was 24% higher than for those who were traced. It is also possible that the low mortality rates may have reflected the particular characteristics of the catchment areas that were selected. These were, by design, predominately lower socioeconomic status communities; however, levels of occupational attainment were somewhat higher in Venezuela and urban Peru than in other sites. In sites in urban China and urban India, the relatively high loss to follow-up was mainly explained by external factors: closure of an apartment block and an urban infrastructure project, respectively. In urban China, indicators of mortality risk, particularly older age and low education, were underrepresented in those who were not traced, suggesting, if anything, a possible overestimation of mortality rates in that site.
Comparison with Other Research
There are few directly comparable data. In the Bambui study, conducted in a Brazilian rural town with a high prevalence of Chagas disease, the mortality rate for those aged 60 y and over was 48.3 per 1,000 person-years [11], much higher than the rates we observed in sites in Peru, Venezuela, and Mexico, and probably more similar to the rates we observed in Cuba and the Dominican Republic. It is tempting to speculate, but difficult to assess, whether culturally determined lifestyles or Native American ancestry may have played a role. Overall, the lower mortality in Latin America is probably a reflection of the more advanced stages of the health transition process in these areas compared to rural China and India.
Life course approaches to understanding the effect of socioeconomic factors on health have, explicitly or implicitly, tested four main models of social causation [24]: (1) latent effect models (an enduring effect of early-life socioeconomic status independent of later socioeconomic status), (2) pathway models (a “chain of disadvantage”, wherein early-life circumstances influence adult experiences and behaviours), (3) social mobility models (positing an independent effect of changes in social status), and (4) cumulative effect models (wherein the effects of adverse social environments accumulate across the life course). Each is supported to some extent by empirical data, with the strongest evidence for latent and cumulative effects, and the weakest for social mobility [24],[25]. To our knowledge, the only test of the applicability of such models for mortality in older people in LMICs was an analysis of data from the China Healthy Longevity Longitudinal Survey [10]. While the authors inferred support for the latent and cumulative effect models, the core indicators of socioeconomic position, education, and occupational attainment were not associated with mortality. There were latent (independent) protective effects of arm length (as an indicator of early nutritional environment) and having both parents living at the age of 10 y. The striking findings were the dose–response effect of social mobility, and a strong inverse association with the adequacy of socioeconomic resources in late life. In our analyses, consistent with some other studies from LMICs [9],[12], we did find a latent protective effect of education, controlling for occupational attainment and late-life resources (household assets). This was a fairly consistent effect across the wide range of sites studied, with minimal statistical heterogeneity, and amounted to a 7% reduction in mortality hazard per level of education. The pooled effects of mid - and late-life socioeconomic indicators, occupational attainment and assets, and late-life indicators of income security, food insecurity and receiving a pension—all apparent in the age - and sex-adjusted models—were no longer statistically significant in the fully mutually adjusted model. Our findings are therefore broadly consistent with latent effect and pathway models of disadvantage. We lacked appropriate exposure data to explore the effect of social mobility.
The independent associations with food insecurity and receiving a pension in late life, at least in the age - and sex-adjusted models, are consistent with findings from other studies of an association between indicators of economic strain in late life and mortality [9],[10], and suggest a further mechanism—that deterioration in economic circumstances in late life may have a proximal effect on mortality risk. In a more detailed analysis of the determinants of mortality in our India site, we found that undernutrition was an important independent predictor, with a population attributable risk fraction of 0.44 [26]. Lack of social protection for older people, arising from income insecurity and diminishing availability of family support, is a widespread but under-prioritised problem in health and human development agendas [27],[28].
Cause of Death
The lack of data and poor reliability of existing information on cause-specific mortality from many LMICs is likely to be exacerbated among older people, because of the increased likelihood of complex comorbidity, and hence multiple contributing causes, and the increased likelihood of death occurring at home, sometimes with minimal or no medical attention. However, other than in India, a high proportion of older people who died in our study received some kind of treatment for the disease leading to death. This was often provided at home, and with the notable exceptions of rural Peru and urban China, a high proportion of deaths also occurred at home. We used the VA approach to circumvent anticipated problems with availability and quality of cause of death data from official registration. VAs were completed for 92.7% of all deaths, using the standard structured assessment currently recommended by the World Health Organization, in an attempt to improve international harmonisation [17]. Rather than using physician determination, we submitted indicator data to the InterVA probabilistic algorithm to generate up to three causes of death for each participant. While the validity of this approach is modest for individual determinations (if, rather questionably, physician determination is taken as the “gold standard”) [29], it does seem to return robust, consistent, and reproducible estimates of cause-specific mortality fractions at the population level [15],[29]. As such, it is an appropriate tool for making comparisons between populations and over time. However, we acknowledge that symptom recognition and recall is likely to differ across sites, which might be responsible for some residual variability on main causes of death between sites.
Our main finding was that chronic diseases, particularly stroke, heart disease, and diabetes, were the dominant causes of death in almost all sites. Stroke was by far the most common, ranking first in all sites other than rural Peru and rural Mexico. It is estimated that stroke caused around 5.7 million deaths in 2005 [30], of which more than 87% occurred in LMICs, 83% in individuals who were aged 60 y and over [1]. Stroke is also an important contributor to disability and dependence among older survivors in LMICs [31]–[33]. Chronic liver disease was identified as an important cause of death in rural Peru, Venezuela, and urban and rural Mexico. While there may have been some misattribution, with a failure to detect malignancy and chronic cardiac failure, the regional patterning may be significant. In the US, cirrhosis, chronic liver disease, and liver cancer are recognised to be particularly common causes of death among Hispanics, and in the National Health and Nutrition Examination Survey, Hispanic men and women were both more likely to have elevated aminotransferase activity, an indicator of the burden of liver disease [34]. The reasons for this susceptibility are not fully understood; the seroprevalences of hepatitis B and C virus infection are relatively low by global standards [35].
In common with the Agincourt study in South Africa [15], we found that the InterVA algorithm returned a relatively high proportion of deaths from tuberculosis, particularly in rural Peru, urban Mexico, and urban and rural China and India. Again, the regional patterning is consistent with expectations. A recent register-based study from Hunan Province, China, showed that the prevalence of tuberculosis was over twice as high in those aged 65 y and older than in those aged 15–64 y [36]. Older people accounted for around a fifth of treated cases but for more than half of all deaths on programme. However, it is also possible that deaths from tuberculosis may have been misattributed. In Agincourt a marked discrepancy was noted between physician and InterVA determinations for tuberculosis as a cause of death, particularly among older people, with a tendency for relative overattribution by the InterVA algorithm [15]. Tetanus is an extremely unlikely cause of death in our samples, since most cases worldwide are neonatal, and in the countries where we conducted our research the disease is largely controlled; the 1.7% of deaths attributed to this cause can therefore probably be discounted. Conversely, other causes of death are likely to have been underestimated. Cancer is thought to account for 13.1% of deaths among those aged 60 y and over in low income countries and 20.3% in middle income countries [37], yet only 2.3% of deaths were attributed to malignancy by InterVA. Dementia, a condition experienced by 450 of the 2,138 who died (21.0%), and known to be strongly independently associated with mortality risk [26],[38],[39], is not considered as a possible cause of death by the InterVA algorithm. These are examples of areas in which the algorithm could be adjusted to better reflect the relationship between symptoms and cause of death in varying contexts [29], in this instance, when applied to older people.
Conclusions
The current global health agenda for chronic diseases is strongly premised on the concept of “premature mortality” and is informed, largely, by an attempt to reduce mortality among working age adults [40]. Our findings are important in informing priorities to improve health and reduce deaths in older people. They suggest an important latent independent protective effect of education even upon late-life mortality in countries with low and middle incomes. Given the much higher absolute mortality rates among older people, efforts to ensure universal access to education should confer substantial health benefits for generations to come. However, life course socioeconomic factors explain little of the variation in mortality rates between sites. This is consistent with Preston's classic observation that exogenous factors have contributed more to increases in life expectancy, particularly in poorer countries [41]; thus, interventions targeting social and economic vulnerability in late life and promoting access to effectively organised health care are also indicated [42]. Stroke, in particular, deserves much more attention. Millions of deaths in LMICs might be prevented using affordable and effective preventive strategies coupled with acute stroke management [30],[43]. Since strokes and deaths from stroke in these regions are concentrated among older people, it follows that these initiatives, and, indeed, chronic disease control programmes generally, need to be targeted accordingly.
Supporting Information
Zdroje
1. World Health Organization 2008 The global burden of disease. 2004 update Geneva World Health Organization
2. MathersCDLoncarD 2006 Projections of global mortality and burden of disease from 2002 to 2030. PLoS Med 3 e442 doi:10.1371/journal.pmed.0030442
3. BowlingA 2004 Socioeconomic differentials in mortality among older people. J Epidemiol Community Health 58 438 440
4. HuismanMKunstAEAndersenOBoppMBorganJK 2004 Socioeconomic inequalities in mortality among elderly people in 11 European populations. J Epidemiol Community Health 58 468 475
5. Hypertension Study Group 2001 Prevalence, awareness, treatment and control of hypertension among the elderly in Bangladesh and India: a multicentre study. Bull World Health Organ 79 490 500
6. MonteiroCACondeWLPopkinBM 2007 Income-specific trends in obesity in Brazil: 1975–2003. Am J Public Health 97 1808 1812
7. AcostaDRottbeckRRodriguezJGGonzalezLMAlmanzarMR 2010 The prevalence and social patterning of chronic diseases among older people in a population undergoing health transition. A 10/66 Group cross-sectional population-based survey in the Dominican Republic. BMC Public Health 10 344
8. AlbaneseELiuZAcostaDGuerraMHuangY 2011 Equity in the delivery of community healthcare to older people: findings from 10/66 Dementia Research Group cross-sectional surveys in Latin America, China, India and Nigeria. BMC Health Serv Res 11 153
9. LiangJMcCarthyJFJainAKrauseNBennettJM 2000 Socioeconomic gradient in old age mortality in Wuhan, China. J Gerontol B Psychol Sci Soc Sci 55 S222 S233
10. WenMGuD 2011 The effects of childhood, adult, and community socioeconomic conditions on health and mortality among older adults in China. Demography 48 153 181
11. Lima-CostaMFPeixotoSVMatosDLFirmoJOUchoaE 2011 Predictors of 10-year mortality in a population of community-dwelling Brazilian elderly: the Bambui cohort study of aging. Cad Saude Publica 27 Suppl 3 s360 s369
12. MostafaGvan GinnekenJK 2000 Trends in and determinants of mortality in the elderly population of Matlab, Bangladesh. Soc Sci Med 50 763 771
13. SubramanianSVNandySIrvingMGordonDLambertH 2006 The mortality divide in India: the differential contributions of gender, caste, and standard of living across the life course. Am J Public Health 96 818 825
14. MathersCDFatDMInoueMRaoCLopezAD 2005 Counting the dead and what they died from: an assessment of the global status of cause of death data. Bull World Health Organ 83 171 177
15. ByassPKahnKFottrellECollinsonMATollmanSM 2010 Moving from data on deaths to public health policy in Agincourt, South Africa: approaches to analysing and understanding verbal autopsy findings. PLoS Med 7 e1000325 doi:10.1371/journal.pmed.1000325
16. JhaPGajalakshmiVGuptaPCKumarRMonyP 2006 Prospective study of one million deaths in India: rationale, design, and validation results. PLoS Med 3 e18 doi:10.1371/journal.pmed.0030018
17. BaidenFBawahABiaiSBinkaFBoermaT 2007 Setting international standards for verbal autopsy. Bull World Health Organ 85 570 571
18. FottrellEByassP 2010 Verbal autopsy: methods in transition. Epidemiol Rev 32 38 55
19. PrinceMFerriCPAcostaDAlbaneseEArizagaR 2007 The protocols for the 10/66 Dementia Research Group population-based research programme. BMC Public Health 7 165
20. World Health Organization 2007 Verbal autopsy standards: ascertaining and attributing cause of death Geneva World Health Organization
21. FantahunMFottrellEBerhaneYWallSHogbergU 2006 Assessing a new approach to verbal autopsy interpretation in a rural Ethiopian community: the InterVA model. Bull World Health Organ 84 204 210
22. US Centers for Disease Control and Prevention 2010 Number of deaths and death rates, by age, race, and sex: United States, 2005 Atlanta (Georgia) US Centers for Disease Control and Prevention
23. GrundyEHoltG 2001 The socioeconomic status of older adults: how should we measure it in studies of health inequalities? J Epidemiol Community Health 55 895 904
24. PollittRARoseKMKaufmanJS 2005 Evaluating the evidence for models of life course socioeconomic factors and cardiovascular outcomes: a systematic review. BMC Public Health 5 7
25. SmithGDHartCBlaneDGillisCHawthorneV 1997 Lifetime socioeconomic position and mortality: prospective observational study. BMJ 314 547 552
26. JotheeswaranATWilliamsJDPrinceMJ 2010 Predictors of mortality among elderly people living in a south Indian urban community; a 10/66 Dementia Research Group prospective population-based cohort study. BMC Public Health 10 366
27. United Nations 2002 Report of the Second World Assembly on Ageing, Madrid 8–12 April 2002. A/CONF.197/9 New York United Nations
28. PrinceMAcostaDAlbaneseEArizagaRFerriCP 2008 Ageing and dementia in low and middle income countries—using research to engage with public and policy makers. Int Rev Psychiatry 20 332 343
29. OtiSOKyobutungiC 2010 Verbal autopsy interpretation: a comparative analysis of the InterVA model versus physician review in determining causes of death in the Nairobi DSS. Popul Health Metr 8 21
30. StrongKMathersCBonitaR 2007 Preventing stroke: saving lives around the world. Lancet Neurol 6 182 187
31. SousaRMFerriCPAcostaDAlbaneseEGuerraM 2009 Contribution of chronic diseases to disability in elderly people in countries with low and middle incomes: a 10/66 Dementia Research Group population-based survey. Lancet 374 1821 1830
32. SousaRMFerriCPAcostaDGuerraMHuangY 2010 The contribution of chronic diseases to the prevalence of dependence among older people in Latin America, China and India: a 10/66 Dementia Research Group population-based survey. BMC Geriatr 10 53
33. FerriCPSchoenbornCKalraLAcostaDGuerraM 2011 Prevalence of stroke and related burden among older people living in Latin America, India and China. J Neurol Neurosurg Psychiatry 82 1074 1082
34. FloresYNYeeHFJrLengMEscarceJJBastaniR 2008 Risk factors for chronic liver disease in Blacks, Mexican Americans, and Whites in the United States: results from NHANES IV, 1999–2004. Am J Gastroenterol 103 2231 2238
35. Mendez-SanchezNGutierrez-GrobeYKobashi-MargainRA 2010 Epidemiology of HCV infection in Latin America. Ann Hepatol 9 Suppl 27 29
36. AbuakuBTanHLiXChenMHuangX 2010 Treatment default and death among tuberculosis patients in Hunan, China. Scand J Infect Dis 42 281 287
37. World Health Organization 2011 Health statistics and health information systems: projections of mortality and burden of disease, 2002–2030. Available: http://www.who.int/healthinfo/global_burden_disease/projections2002/en/index.html. Accessed 2 May 2011
38. PerkinsAJHuiSLOgunniyiAGurejeOBaiyewuO 2002 Risk of mortality for dementia in a developing country: the Yoruba in Nigeria. Int J Geriatr Psychiatry 17 566 573
39. NitriniRCaramelliPHerreraEJrde CastroIBahiaVS 2005 Mortality from dementia in a community-dwelling Brazilian population. Int J Geriatr Psychiatry 20 247 253
40. BeagleholeREbrahimSReddySVouteJLeederS 2007 Prevention of chronic diseases: a call to action. Lancet 370 2152 2157
41. PrestonSH 1975 The changing relation between mortality and level of economic development. Popul Stud (Camb) 29 231 248
42. LeonDAWaltGGilsonL 2001 Recent advances: international perspectives on health inequalities and policy. BMJ 322 591 594
43. FeiginVL 2007 Stroke in developing countries: can the epidemic be stopped and outcomes improved? Lancet Neurol 6 94 97
Štítky
Interní lékařství
Článek : Transmission ?
Článek vyšel v časopisePLOS Medicine
Nejčtenější tento týden
2012 Číslo 2- S prof. Vladimírem Paličkou o racionální suplementaci kalcia a vitaminu D v každodenní praxi
- Není statin jako statin aneb praktický přehled rozdílů jednotlivých molekul
- Moje zkušenosti s Magnosolvem podávaným pacientům jako profylaxe migrény a u pacientů s diagnostikovanou spazmofilní tetanií i při normomagnezémii - MUDr. Dana Pecharová, neurolog
- Magnosolv a jeho využití v neurologii
- Biomarker NT-proBNP má v praxi široké využití. Usnadněte si jeho vyšetření POCT analyzátorem Afias 1
-
Všechny články tohoto čísla
- Beyond the Numbers: Describing Care at the End of Life
- Engaging Men in Prevention and Care for HIV/AIDS in Africa
- Mobile Phone Text Messaging: Tool for Malaria Control in Africa
- Homocysteine and Coronary Heart Disease: Meta-analysis of Case-Control Studies, Avoiding Publication Bias
- Socioeconomic Factors and All Cause and Cause-Specific Mortality among Older People in Latin America, India, and China: A Population-Based Cohort Study
- The Evolving Landscape of the Economics of HIV Treatment and Prevention
- Complexity in Non-Pharmacological Caregiving Activities at the End of Life: An International Qualitative Study
- : Transmission ?
- Why Does Mental Health Not Get the Attention It Deserves? An Application of the Shiffman and Smith Framework
- Prevalence, Distribution, and Impact of Mild Cognitive Impairment in Latin America, China, and India: A 10/66 Population-Based Study
- Association between Clean Delivery Kit Use, Clean Delivery Practices, and Neonatal Survival: Pooled Analysis of Data from Three Sites in South Asia
- Characterisation of Hospital Ward–Based Transmission Using Extensive Epidemiological Data and Molecular Typing
- The Activities of Current Antimalarial Drugs on the Life Cycle Stages of : A Comparative Study with Human and Rodent Parasites
- PLOS Medicine
- Archiv čísel
- Aktuální číslo
- Informace o časopisu
Nejčtenější v tomto čísle- The Activities of Current Antimalarial Drugs on the Life Cycle Stages of : A Comparative Study with Human and Rodent Parasites
- Association between Clean Delivery Kit Use, Clean Delivery Practices, and Neonatal Survival: Pooled Analysis of Data from Three Sites in South Asia
- Prevalence, Distribution, and Impact of Mild Cognitive Impairment in Latin America, China, and India: A 10/66 Population-Based Study
- Characterisation of Hospital Ward–Based Transmission Using Extensive Epidemiological Data and Molecular Typing
Kurzy
Zvyšte si kvalifikaci online z pohodlí domova
Autoři: prof. MUDr. Vladimír Palička, CSc., Dr.h.c., doc. MUDr. Václav Vyskočil, Ph.D., MUDr. Petr Kasalický, CSc., MUDr. Jan Rosa, Ing. Pavel Havlík, Ing. Jan Adam, Hana Hejnová, DiS., Jana Křenková
Autoři: MUDr. Irena Krčmová, CSc.
Autoři: MDDr. Eleonóra Ivančová, PhD., MHA
Autoři: prof. MUDr. Eva Kubala Havrdová, DrSc.
Všechny kurzyPřihlášení#ADS_BOTTOM_SCRIPTS#Zapomenuté hesloZadejte e-mailovou adresu, se kterou jste vytvářel(a) účet, budou Vám na ni zaslány informace k nastavení nového hesla.
- Vzdělávání


