-
Články
Top novinky
Reklama- Vzdělávání
- Časopisy
Top články
Nové číslo
- Témata
Top novinky
Reklama- Kongresy
- Videa
- Podcasty
Nové podcasty
Reklama- Kariéra
Doporučené pozice
Reklama- Praxe
Top novinky
ReklamaThe Brazil SimSmoke Policy Simulation Model: The Effect of Strong Tobacco Control Policies on Smoking Prevalence and Smoking-Attributable Deaths in a Middle Income Nation
Background:
Brazil has reduced its smoking rate by about 50% in the last 20 y. During that time period, strong tobacco control policies were implemented. This paper estimates the effect of these stricter policies on smoking prevalence and associated premature mortality, and the effect that additional policies may have.Methods and Findings:
The model was developed using the SimSmoke tobacco control policy model. Using policy, population, and smoking data for Brazil, the model assesses the effect on premature deaths of cigarette taxes, smoke-free air laws, mass media campaigns, marketing restrictions, packaging requirements, cessation treatment programs, and youth access restrictions. We estimate the effect of past policies relative to a counterfactual of policies kept to 1989 levels, and the effect of stricter future policies. Male and female smoking prevalence in Brazil have fallen by about half since 1989, which represents a 46% (lower and upper bounds: 28%–66%) relative reduction compared to the 2010 prevalence under the counterfactual scenario of policies held to 1989 levels. Almost half of that 46% reduction is explained by price increases, 14% by smoke-free air laws, 14% by marketing restrictions, 8% by health warnings, 6% by mass media campaigns, and 10% by cessation treatment programs. As a result of the past policies, a total of almost 420,000 (260,000–715,000) deaths had been averted by 2010, increasing to almost 7 million (4.5 million–10.3 million) deaths projected by 2050. Comparing future implementation of a set of stricter policies to a scenario with 2010 policies held constant, smoking prevalence by 2050 could be reduced by another 39% (29%–54%), and 1.3 million (0.9 million–2.0 million) out of 9 million future premature deaths could be averted.Conclusions:
Brazil provides one of the outstanding public health success stories in reducing deaths due to smoking, and serves as a model for other low and middle income nations. However, a set of stricter policies could further reduce smoking and save many additional lives.
Please see later in the article for the Editors' Summary
Published in the journal: . PLoS Med 9(11): e32767. doi:10.1371/journal.pmed.1001336
Category: Research Article
doi: https://doi.org/10.1371/journal.pmed.1001336Summary
Background:
Brazil has reduced its smoking rate by about 50% in the last 20 y. During that time period, strong tobacco control policies were implemented. This paper estimates the effect of these stricter policies on smoking prevalence and associated premature mortality, and the effect that additional policies may have.Methods and Findings:
The model was developed using the SimSmoke tobacco control policy model. Using policy, population, and smoking data for Brazil, the model assesses the effect on premature deaths of cigarette taxes, smoke-free air laws, mass media campaigns, marketing restrictions, packaging requirements, cessation treatment programs, and youth access restrictions. We estimate the effect of past policies relative to a counterfactual of policies kept to 1989 levels, and the effect of stricter future policies. Male and female smoking prevalence in Brazil have fallen by about half since 1989, which represents a 46% (lower and upper bounds: 28%–66%) relative reduction compared to the 2010 prevalence under the counterfactual scenario of policies held to 1989 levels. Almost half of that 46% reduction is explained by price increases, 14% by smoke-free air laws, 14% by marketing restrictions, 8% by health warnings, 6% by mass media campaigns, and 10% by cessation treatment programs. As a result of the past policies, a total of almost 420,000 (260,000–715,000) deaths had been averted by 2010, increasing to almost 7 million (4.5 million–10.3 million) deaths projected by 2050. Comparing future implementation of a set of stricter policies to a scenario with 2010 policies held constant, smoking prevalence by 2050 could be reduced by another 39% (29%–54%), and 1.3 million (0.9 million–2.0 million) out of 9 million future premature deaths could be averted.Conclusions:
Brazil provides one of the outstanding public health success stories in reducing deaths due to smoking, and serves as a model for other low and middle income nations. However, a set of stricter policies could further reduce smoking and save many additional lives.
Please see later in the article for the Editors' SummaryIntroduction
Since 1989, Brazil has implemented policies to increase cigarette taxes, require bold warnings on cigarette packages, ban many tobacco marketing practices, and generally expand tobacco control programs [1]–[3]. In 1996, Brazil was made a World Health Organization Collaborating Center for the Tobacco or Health Program, thus strengthening its international importance and pioneering role in providing support for preventive actions related to tobacco control to low and middle income nations.
Monteiro et al. [2] documented a steep decline in smoking prevalence in Brazil from 34.8% in 1989 to 22.4% in 2003, but did not attempt to isolate the role of tobacco control policies from long-term trends in smoking prevalence. More recent data [3] indicate that smoking rates have fallen by almost half since 1989, to a level of 18.5% in 2008. The reasons for this steep decline have not been documented.
Most statistical studies have examined the effect of only one or, at most, two tobacco control policies (e.g., [4]), because the ability to distinguish the effects of different policies on smoking rates is limited. Computational models combine information from different sources to explore how the effects of multiple public policies might unfold over time [5],[6].
This paper uses the well-tested SimSmoke tobacco control policy model [7]–[19] to isolate the effect of tobacco policies from previous trends in smoking prevalence. This simulation model projects smoking prevalence and smoking-attributable deaths (SADs) from 1989 forward. Besides examining the role of past policies, the model can be used to consider the potential effect of policies not yet implemented. The Brazil SimSmoke model is used to show the effect of policies implemented between 1989 and 2010, as well as the effect of a set of additional future policies consistent with the World Health Organization's Framework Convention on Tobacco Control (FCTC).
Methods
SimSmoke includes population, smoking, SAD, and policy modules [6], with the mathematical equations and assumptions provided in Text S1. The model begins in 1989, before major tobacco control policies were implemented. The initial population is divided into smokers, never smokers, and former smokers by age and gender.
To model behavior from 1989 forward, population growth is projected forward through birth and death rates. Data on population, mortality rates, and fertility rates by individual age group and gender are from the Brazilian Institute of Geography and Statistics.
Smoking prevalence is projected forward through smoking initiation, cessation, and relapse rates employing a discrete first-order Markov process (i.e., dependent on current, but not past, rates); individuals are classified as never smokers from birth until they initiate smoking or die, may transition from current to former smoker through cessation, or may return to smoker through relapse. The likelihood of relapse depends on the number of years since quitting. Smoking prevalence for the base year is from the National Survey of Health and Nutrition, a nationally representative household survey of health issues in Brazil conducted in 1989 (n = 17,920 households). Because data on former smokers were not available by years since quitting, we use data from a Netherlands 1996 survey [15], in which current and former smoking rates were found to be similar to those in Brazil in 1989. Netherland rates were found to fit better than US rates and validated well, as described below.
Because of empirical challenges in measuring initiation and cessation, and in order to ensure internal consistency of the model, initiation rates at each age are measured in SimSmoke as the difference between the smoking rate of that age and the smoking rate in the last year for the previous age. We allow initiation through age 29 y, when smoking prevalence rates begin to level off. Cessation is tracked after age 29 y. Since cessation data were not available for Brazil in 1989, we use the 1996 Netherlands data on current smokers and those who quit <12 mo ago to estimate cessation rates. The initial cessation rates were about 5% of the smoking population, before relapse. Because relapse data were not available for Brazil, we use US rates [20],[21].
The primary outcome modeled is premature deaths due to smoking, as measured by SADs. Mortality rates by age and gender are first calculated distinguished by smoking status (current, former by years since quitting, and never) by applying relative risks and smoking rates to overall mortality rates. SADs are then calculated by applying the excess mortality risks—measured as the difference between the estimated mortality risk of current (or former) smokers and of never smokers—to the number of current and former smokers (distinguished by years since quitting). Large-scale studies of the relative risk of smoking were not found for Brazil. Because Brazil has a smoking history similar to that of the US, the model uses relative risk estimates for former and current smokers from the US Cancer Prevention Study II [22]–[24], as used in two previous studies for Brazil [25],[26]. Two Brazil studies obtained lung cancer risks comparable to those in the US [27]–[29].
The Role of Policies
Policy effect sizes are in terms of constant percentage reductions. They are directly applied to smoking prevalence in the year in which the policy is implemented and applied to initiation and cessation rates in future years if the policy is sustained. Unless synergies are specified, the effect of a newly implemented policy is reduced by (1 – the effect of previously implemented policies), thereby bounding the effect of the policies between 0% and 100% and allowing for some offset of simultaneously implemented policies (i.e., the effect of a policy is reduced proportionally by the effect of previously implemented policies). The studies of policy effect size are primarily for high income countries. While the Brazilian economy has progressed substantially since 1989, Brazil was a middle income nation through much of the time period analyzed, and, as such, the policy effects from high income countries are adjusted to reflect differences in health awareness and the degree of urbanization [16]. Effect sizes for each policy were originally based on the advice of an expert panel and thorough reviews of the literature, and modified based on Brazilian policy studies and review by a panel of tobacco control experts in Brazil. In addition, the model has been validated in 19 countries and four US states [7]–[19] exhibiting a wide variety of tobacco control policies; projected adult smoking prevalence rates have generally been within 10% of survey rates. Nevertheless, since the policy studies vary in depth and consistency across policies, we consider uncertainty in effect sizes, based on the variability found in the better studies [11],[16]. To capture uncertainty for smoke-free air laws, marketing restrictions, health warnings, and media campaigns, the bounds are set at 50% above and 50% below the estimated effect sizes [11],[16]. For cessation treatment programs, bounds are 50% below but 100% above the effect size, reflecting the potential to improve treatment through better follow-up of smokers [30]. For youth access restrictions [11], bounds are from no effect to 50% above the effect size, reflecting that many studies find no effect. For price/tax effects, we adopt a lower bound 25% below and an upper bound 25% above the effect size [11],[16], reflecting the greater consistency of price/tax studies.
The effect of each policy depends on its initial level (e.g., the incremental effect of a complete work site smoking ban is less when a nation already has a partial work site ban). Because changes in policy affect the future path of smoking prevalence in SimSmoke, we track policy levels from the year that the model begins, 1989, to 2010. The level of policies is based on information from MPOWER [31], a World Bank report [1], the 2008 Global Adult Tobacco Survey (GATS) [32], and tobacco control staff and organizations whose objective is to collect recent figures on tobacco control in Brazil. Policies and potential effect sizes are summarized in Table 1.
Tab. 1. Policies, description, and effect sizes of Brazil SimSmoke. 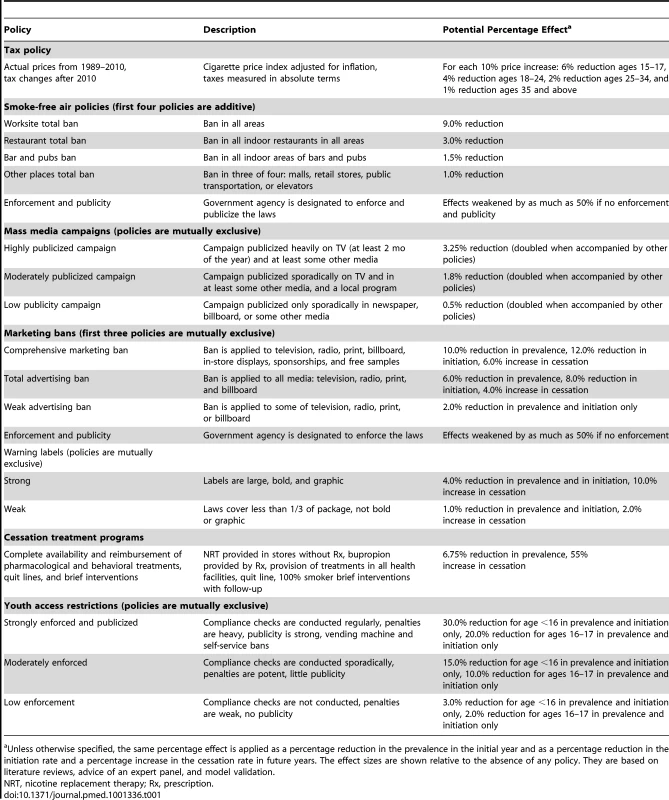
Unless otherwise specified, the same percentage effect is applied as a percentage reduction in the prevalence in the initial year and as a percentage reduction in the initiation rate and a percentage increase in the cessation rate in future years. The effect sizes are shown relative to the absence of any policy. They are based on literature reviews, advice of an expert panel, and model validation. Between 1989 and 2010, Brazil implemented strong taxes, marketing restrictions, health warnings, and other tobacco control programs. Adjusting for general price inflation, cigarette prices doubled by 1998, and were 2.3 times their 1989 level by 2010, largely because of higher taxes. Restrictions on cigarette advertising were first mentioned in 1988, increasing to broad marketing coverage by 2005. Educational programs were implemented in 1996, and have been strengthened to include local programs and strong media campaigns [1]. These programs included policies directed at providing access to cessation treatments. Weak warnings were required on cigarette packages starting in 1996, with the law modified in 2001 to require graphic warnings that covered 100% of the back of the carton. In addition, Brazil strengthened smoke-free air laws in 1996 and 2000, and some cities have implemented a ban on smoking in all enclosed public places since 2007.
Calibration, Validation, and Model Outcomes
The model estimates smoking prevalence and SADs for the tracking period from 1989 to 2010, and projects future outcomes for 2011 through 2050. The model was validated for smoking prevalence over the period 1989–2008.
The primary data sources for validation and calibration were two national household surveys conducted in Brazil as part of larger surveys: the Brazilian module of the 2003 World Health Survey [1],[3] and the 2008 Brazilian GATS [32] The 2003 survey included a probabilistic sample of 5,000 households. The GATS [3] used a global standardized methodology and a multi-stage stratified sample design, and has 39,425 completed interviews.
We used the tracking period to validate current and former smoking rates by age. Specifically, we compared the predicted current smoking rates from SimSmoke to annual smoking rates by age and gender from the 2003 and 2008 surveys, and the former smoking rates from the model to those from the 2008 GATS [32].
To consider the effect of all policies implemented since 1989, we first set policies through 2010 to their 1989 levels to obtain the counterfactual smoking rates in the absence of the post-1989 policies. The difference between the smoking prevalence with polices at 1989 levels and the smoking prevalence with actual policies implemented yields the net effect of policies implemented since 1989. For the role of single policies, we compared the scenario with only that policy implemented to the counterfactual policy scenario. Because the effects of policies are assumed to be multiplicative, the reduction attributed to each individual policy is relative to the summed effect of all policies. The impact of policies on deaths was estimated by subtracting the number of SADs with policies implemented from the simulated number of SADs with policies kept at 1989 levels.
We also consider the effect of implementing a set of policies consistent with the FCTC, as specified in MPOWER reports [16]. To examine the potential effect of FCTC-consistent future policies, we compare the status quo case, where tobacco control policies are maintained at their 2010 level, with scenarios of stricter tobacco control policies, all implemented in 2011 and maintained in future years.
Results
Validation: Predictions of Smoking Prevalence from 1989 to 2008
Between 1989 and 2008, SimSmoke predicts that the male smoking rate (ages 18 y and above) decreases from 43.3% to 22.9%, approximately a 47% decline in relative terms, and that the female smoking rate falls from 27.0% to 13.9%, approximately a 48% relative decline. As shown in Figure 1 and Table 2, these predictions are very close to the 48% relative decline for males and 49% relative decline for females comparing 2008 to 1989 survey data. As shown in Table 2, SimSmoke is within 2% accuracy for both genders between 1989 and 2008, but is less accurate for the 1989 to 2003 and 2003 and 2008 sub-periods. SimSmoke predicts well by age groups for males by 2008, except for underestimating the decline for the age group 18–24 y. SimSmoke does less well for females, where it underpredicts for the age group 25–44 y and overpredicts for the age group 45–64 y in the 2003–2008 sub-period.
Fig. 1. Brazil smoking prevalence for individuals aged 18 y and above, 1989–2010: SimSmoke predictions and various surveys. 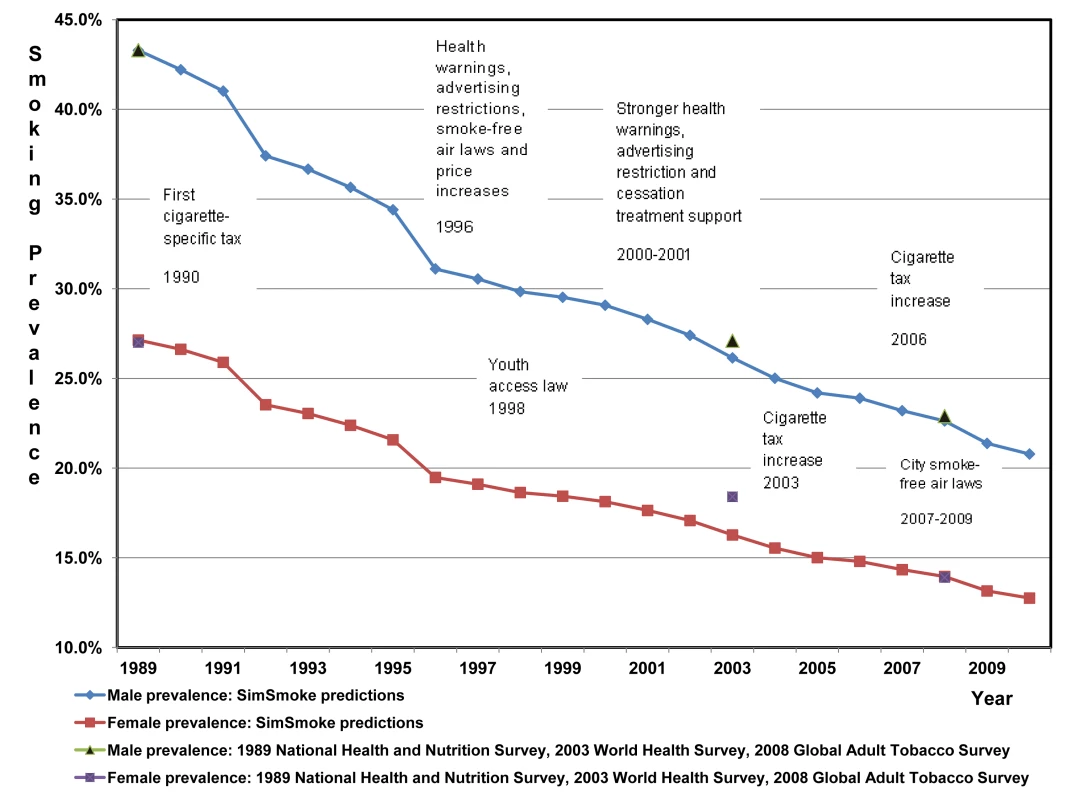
Tab. 2. Validation of the Brazil SimSmoke: predictions versus survey estimates, 1989–2008. 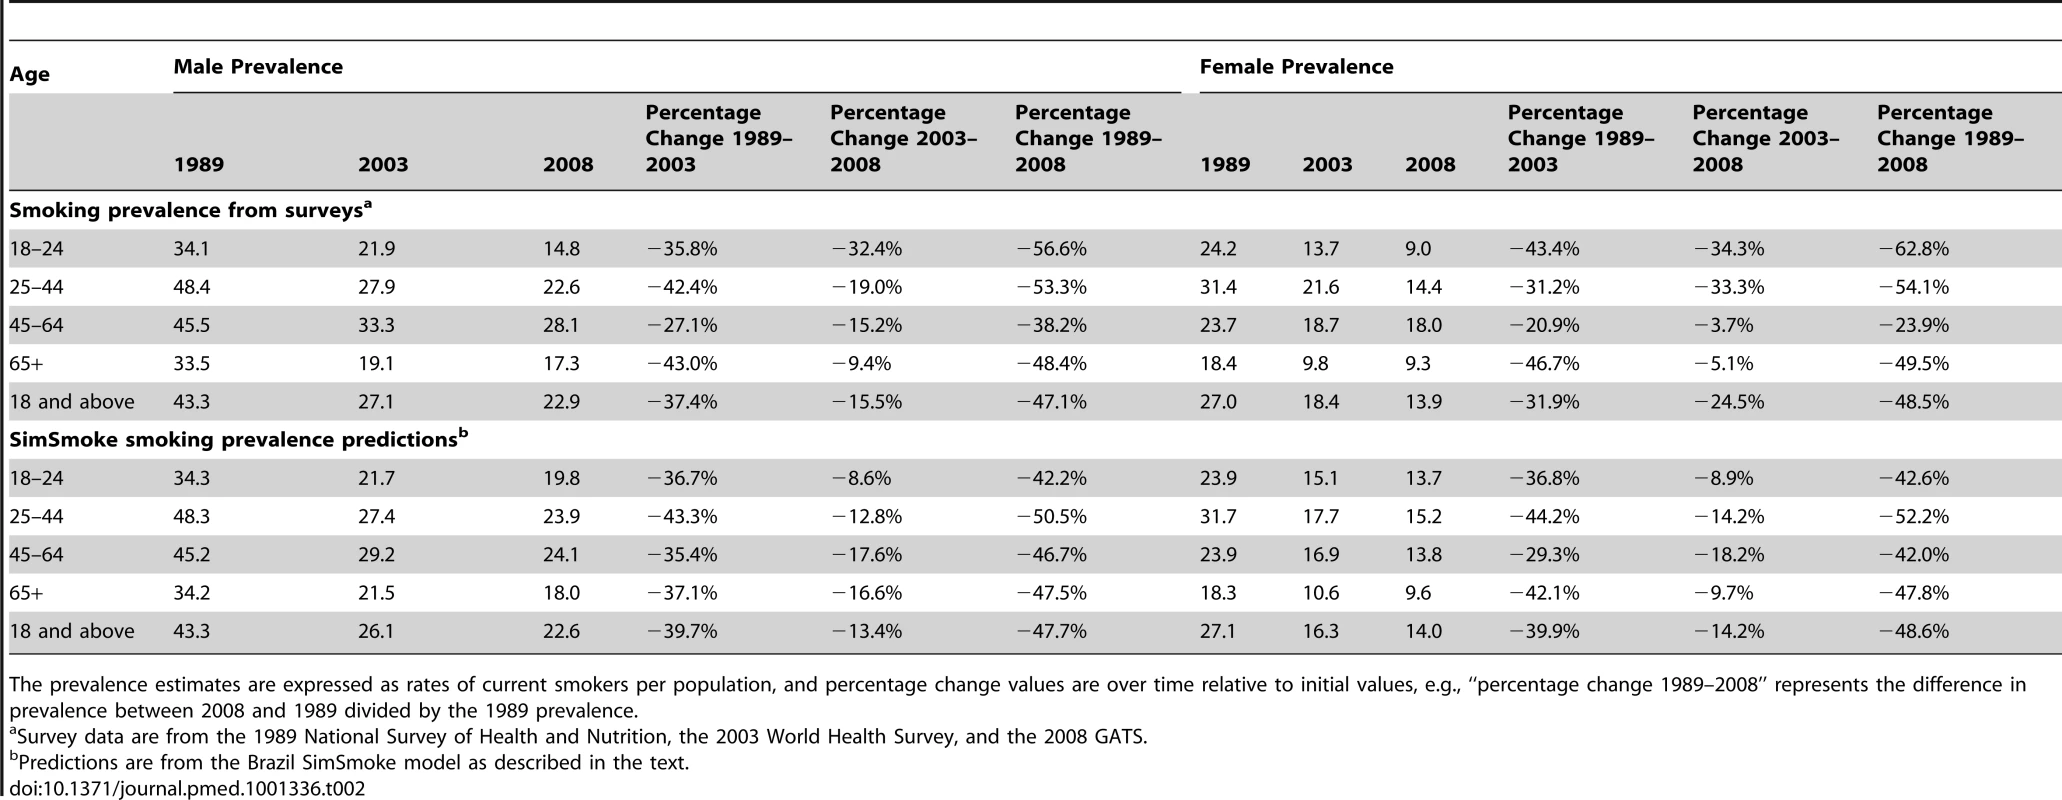
The prevalence estimates are expressed as rates of current smokers per population, and percentage change values are over time relative to initial values, e.g., “percentage change 1989–2008” represents the difference in prevalence between 2008 and 1989 divided by the 1989 prevalence. We also compared the predictions of smoking prevalence of those 15 y and above for 2008 to the estimates in the GATS report [32] and found that the predictions for males and females were well within the GATS 95% confidence intervals. The 2008 former smoker rates from SimSmoke also compared well to the rates from the 2008 GATS. For males and females combined, the former smoker rates of SimSmoke versus those of GATS were 10.1% versus 13.8% for ages 25–44 y, 30% versus 29% for ages 45–64 y, and 31% versus 30% for ages 65 y and above (data not shown).
The Role of Policies in Reducing Smoking Prevalence and Smoking-Attributable Deaths between 1989 and 2010
Tables 3 and 4 show the simulated smoking prevalence and SADs with and without the policies implemented between 1989 and 2010. The counterfactual, with policies at the 1989 levels, has no upper and lower bound since there are no policy effects.
Tab. 3. Smoking prevalence, counterfactuals of no policies changed since 1989 versus policies individually implemented and combined, Brazil SimSmoke, 1989–2050. 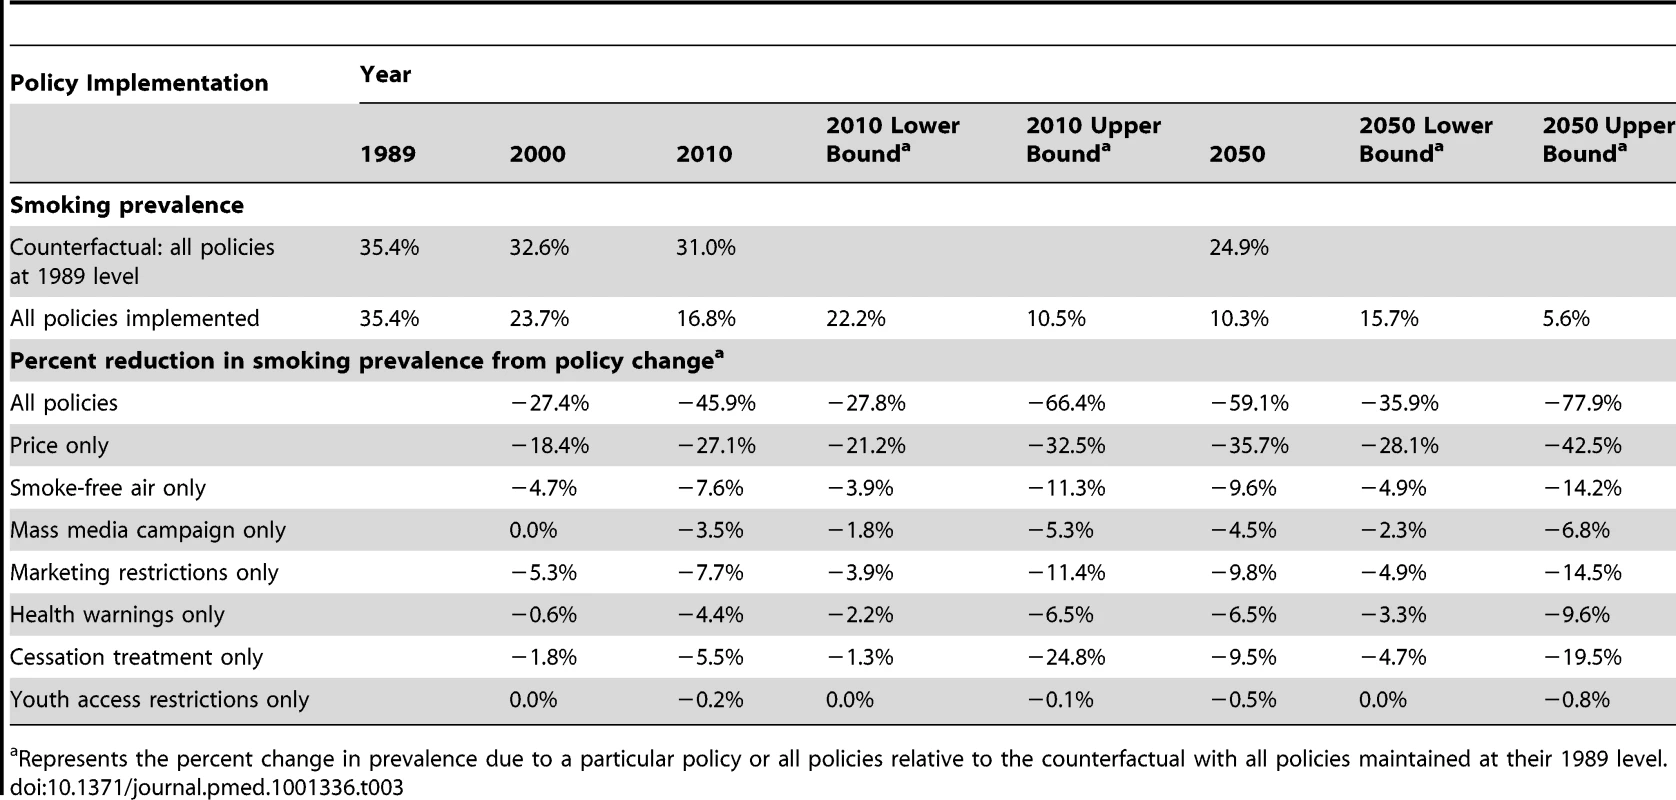
Represents the percent change in prevalence due to a particular policy or all policies relative to the counterfactual with all policies maintained at their 1989 level. Tab. 4. Smoking-attributable deaths, counterfactuals of no policies changed since 1989 versus policies individually implemented and combined, Brazil SimSmoke, 1989–2050. 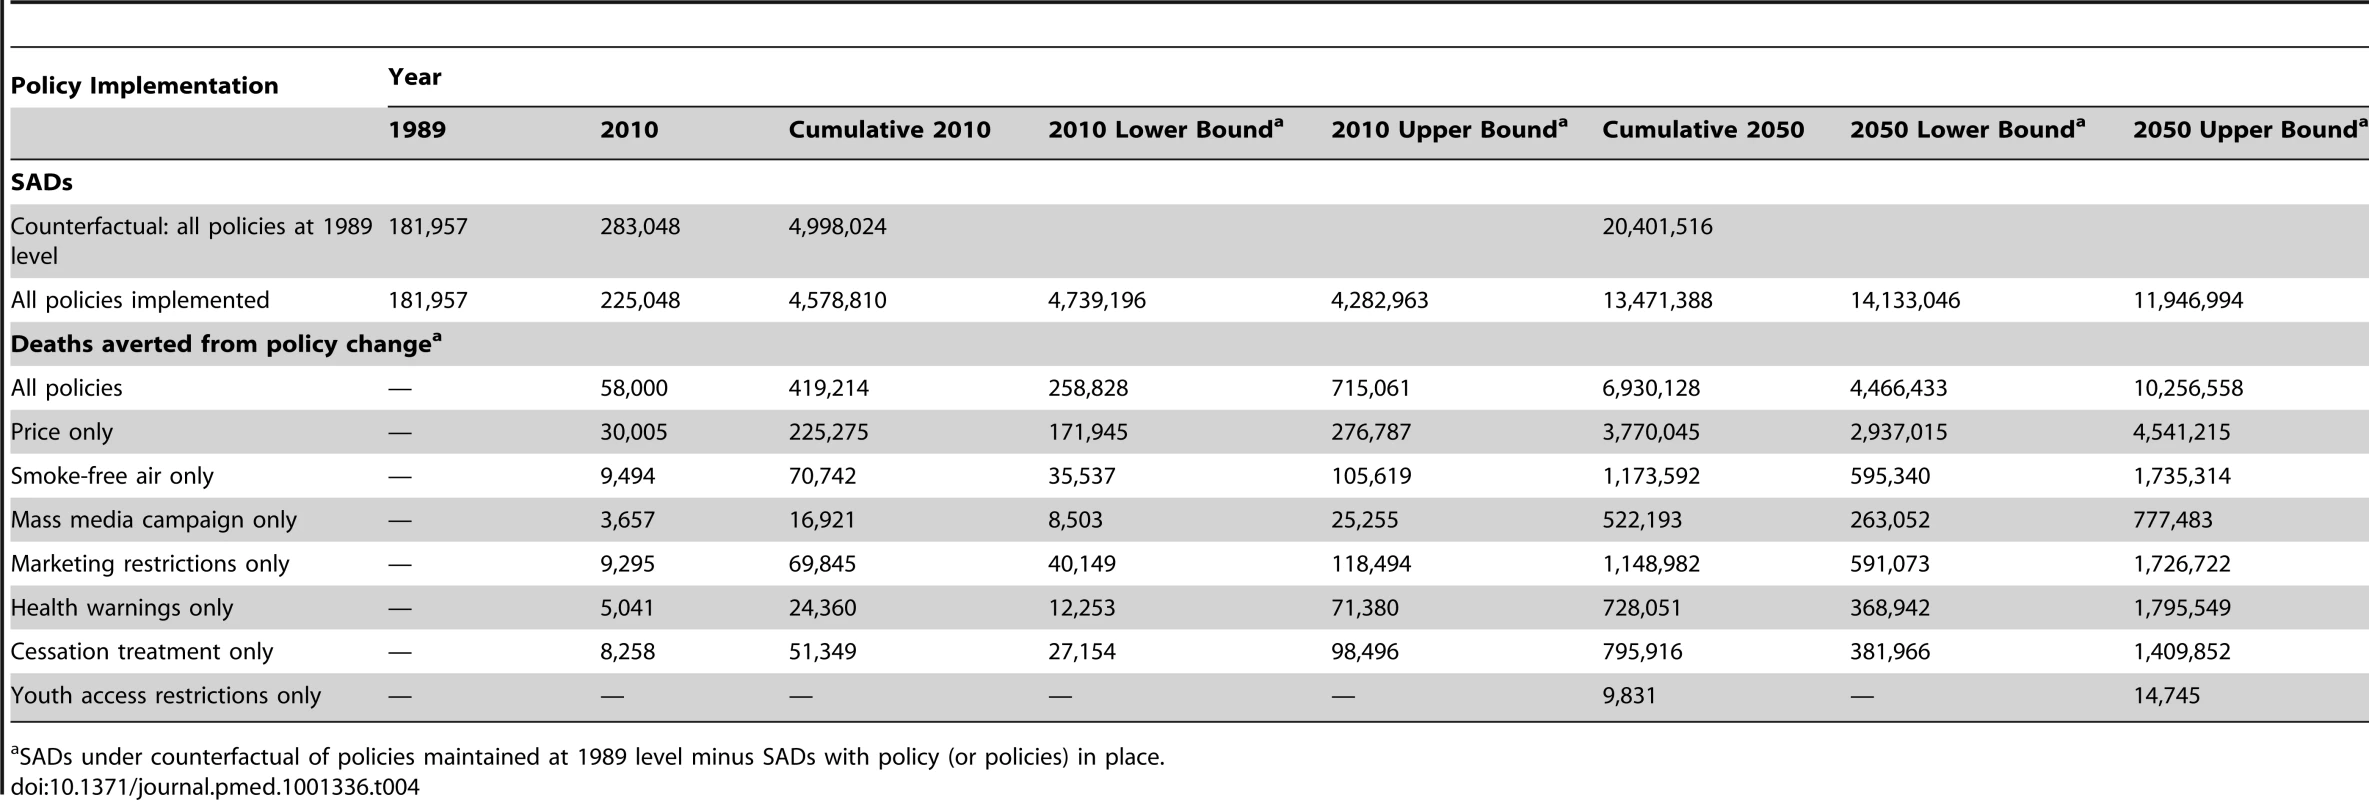
SADs under counterfactual of policies maintained at 1989 level minus SADs with policy (or policies) in place. Without any of the policies implemented since 1989, SimSmoke projected a slow downward trend in smoking rates, with rates falling from 35.4% in 1989 to 31.0% in 2010 through cessation rates. With all policies implemented, smoking prevalence declined to approximately 17% (lower and upper bounds: 11%–22%), which represents a 46% (28%–66%) relative decline from the 2010 counterfactual level without the implemented policies, and a 52% relative decline from the 1989 level. Similar results were observed for males and females (data not shown). The policy differential continues to grow after 2010, reaching an approximate 59% (36%–78%) relative decline from the simulated 2050 level with policies maintained at their 1989 levels.
As a result of the policies implemented between 1989 and 2010, SimSmoke estimates that a total of 58,000 (35,000–97,000) deaths were averted in 2010 alone. Summing over the years from 1989 to 2010, a total of about 420,000 (260,000–715,000) deaths are averted. The cumulative number of deaths averted increases to almost 7 million (4.5 million–10.3 million) by 2050, of which about 4.5 million are male and 2.5 million are female (data not shown).
By examining the effect of each policy implemented between 1989 and 2010 relative to the summed effects, we decomposed the prevalence reductions into component contributions of each policy, as shown in Figure 2. Of the 100% overall reduction in smoking prevalence due to policies implemented by 2010, the percent contributed by tax/price increases was 48%, by stricter smoke-free air laws was 14%, by mass media campaigns was 6%, by stricter marketing restrictions was 14%, by stronger health warnings was 8%, by cessation treatment programs was 10%, and by youth access restrictions was less than 1%. Results were similar by gender except that the relative effects were slightly greater among males for tax increases and among females for cessation policies. In simulation, by 2050, cessation policies and health warnings play a larger role because of their relatively larger effect on cessation rates compared to other policies.
Fig. 2. Percent of the reduction in 2010 smoking prevalence* due to individual policies implemented since 1989, estimated by Brazil SimSmoke. 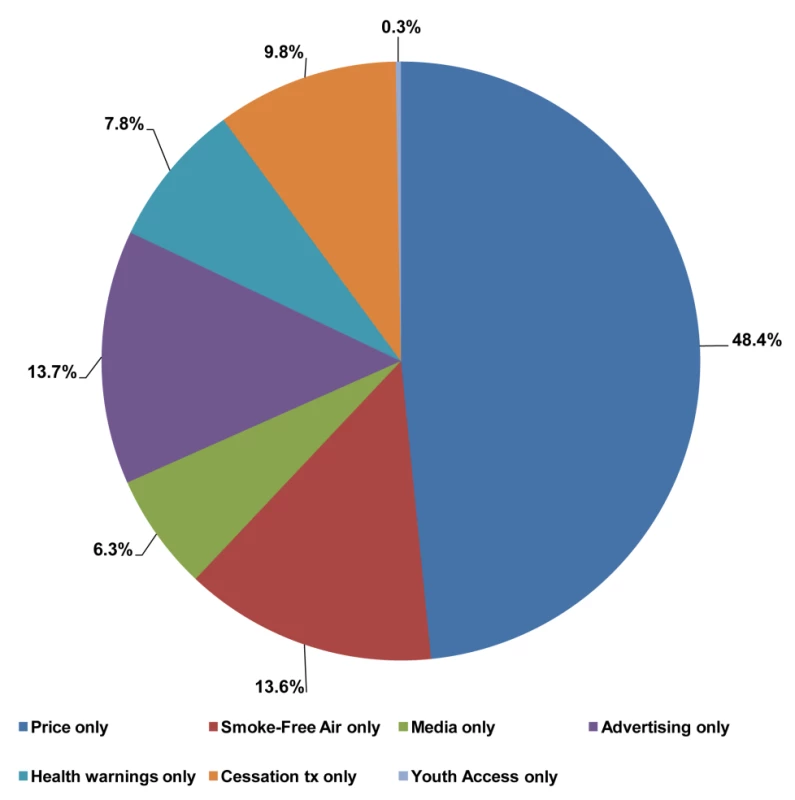
Cessation tx, cessation treatment. *Smoking prevalence is for both genders combined. Role of Policies Implemented in 2011 in Reducing Future Smoking Prevalence and Deaths
We simulated the effect of implementing a stricter set of FCTC-consistent policies maintained from 2011 onward versus a status quo scenario, where policies are maintained at 2010 levels, as shown in Table 5. SADs are summed over the years 2011 to 2050 to serve as an estimate of the SADs of the people alive today.
Tab. 5. Smoking prevalence for ages 18 and above, smoking-attributable deaths, and deaths averted under status quo and FCTC-consistent policy scenarios, Brazil SimSmoke, 2010–2050. 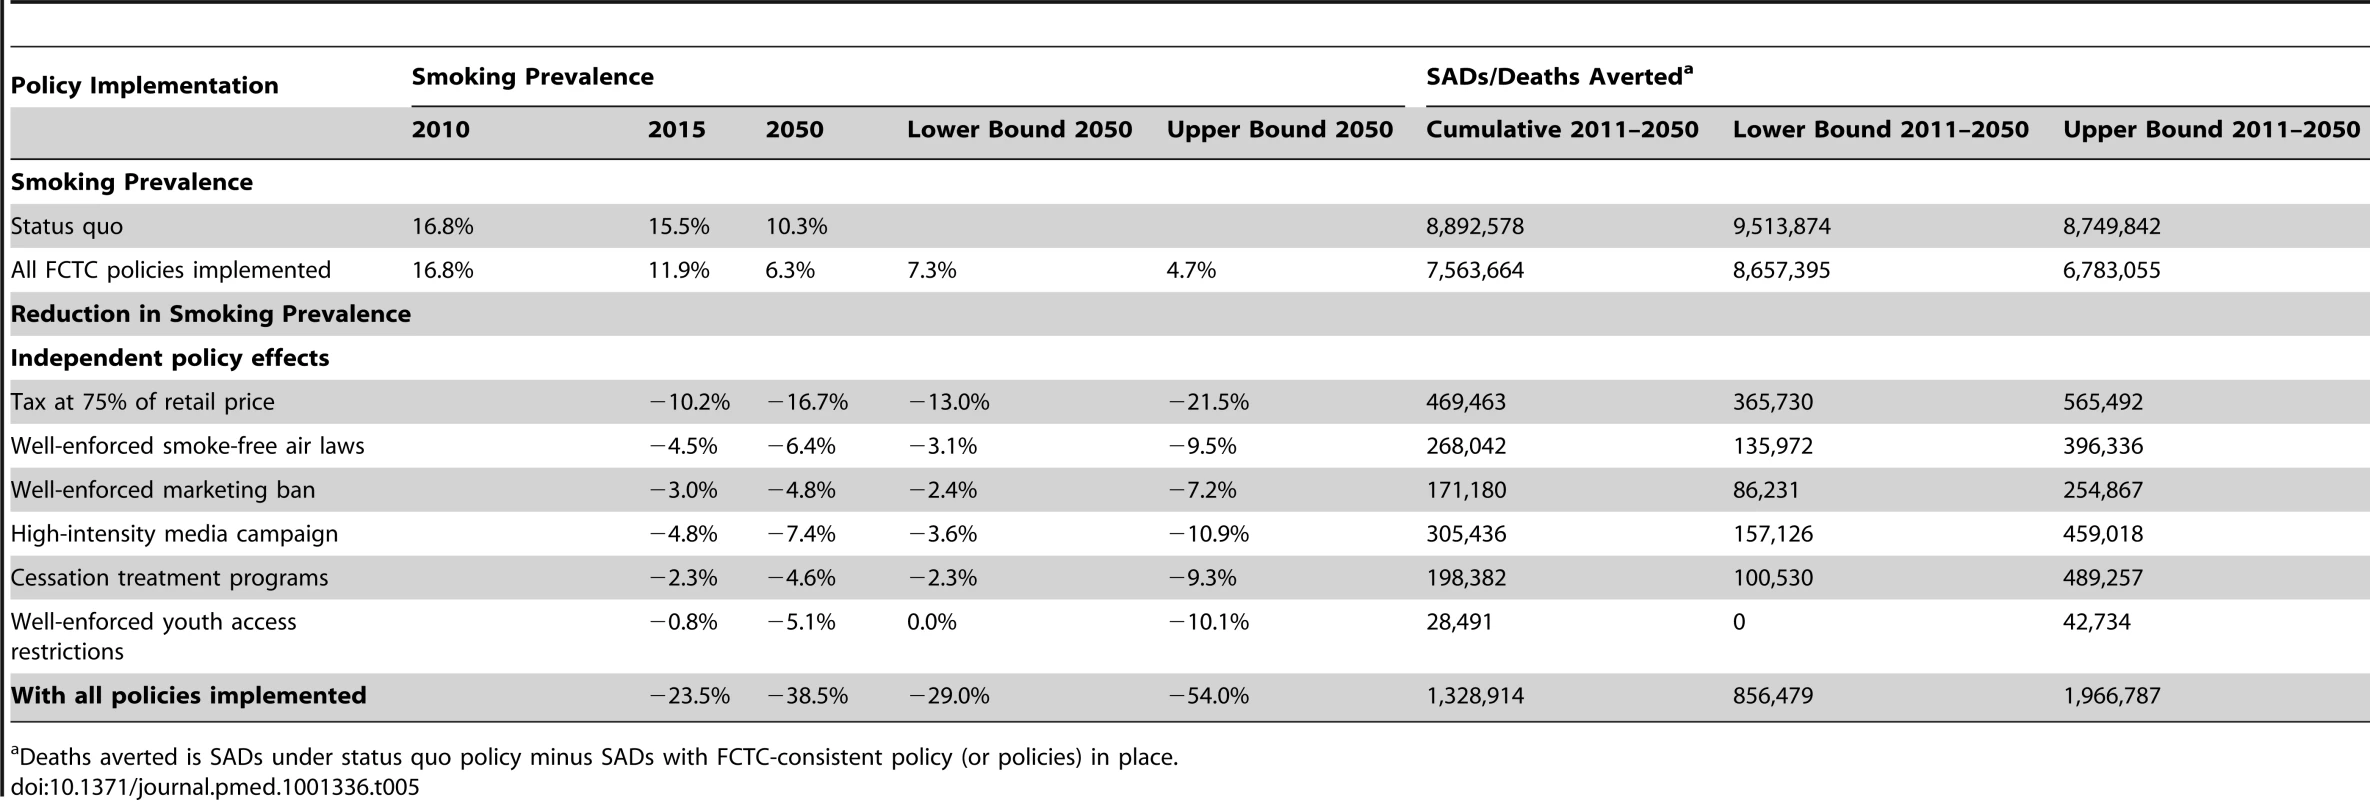
Deaths averted is SADs under status quo policy minus SADs with FCTC-consistent policy (or policies) in place. If tobacco control policies remain unchanged from their 2010 levels, as in the status quo scenario, the smoking prevalence is projected to decrease to approximately 10% by 2050. From 2011 to 2050, approximately 8.9 (8.7–9.5) million premature deaths in Brazil are attributed to smoking.
Among the available policy measures, tax policy appears especially effective in reducing youth smoking prevalence [33],[34]. With taxes increased from their current level of 60% to 75% of price, smoking prevalence is projected to decline by about 17% (13%–21%) relative to the status quo in 2050, and about 470,000 (366,000–565,000) deaths are averted as a result. By 2050, nationwide smoke-free air laws yield an expected 6% (3%–9%) reduction in prevalence, averting about 268,000 deaths (135,000–396,000); a comprehensive marketing ban yields an expected 5% (2%–7%) reduction in prevalence, averting about 171,100 (86,000–255,000) deaths; a sustained high-intensity campaign yields an expected 7% (4%–11%) reduction, averting 305,400 deaths (157,000–459,000); comprehensive smoking cessation treatment programs yield an expected 5% (2%–9%) reduction, averting about 198,400 (101,000–489,000) deaths; and well-enforced youth access laws yield an expected 5% (0%–8%) reduction, averting about 28,500 (0–43,000) deaths. For youth, deaths are not averted until about 2025, when they reach age 30 y and above.
The final scenario is for all policies combined. By 2050, smoking prevalence would be expected to drop in relative terms by about 39% (29%–54%)—38% for males and 40% for females—relative to the status quo, with upper and lower bounds of approximately 29% to 54%. By 2050, a total of approximately 1,300,000 (860,000–1,970,000) are projected to be averted, of which about 900,000 are male and 400,000 are female.
Discussion
Smoking prevalence in Brazil has fallen by almost 50% since 1989. Brazil SimSmoke shows that policies played a major role in those steep declines, estimating a 46% relative reduction in prevalence by 2010 above and beyond the reductions that would have occurred in the absence of the policies implemented since 1989. Almost half of the 46% projected reduction is from price increases, with an additional 14% from smoke-free air laws, 14% from marketing restrictions, 8% from health warnings, 6% from anti-smoking mass media campaigns, and 10% from cessation treatment programs. As a result of the policies implemented between 1989 and 2010, SimSmoke estimates that a total of around 420,000 deaths were averted by 2010, increasing to 7 million projected by 2050.
We recommend interpreting the Brazil SimSmoke projections in a conservative manner. The results depend on the reliability of the data and the estimated parameters and assumptions used in the models.
The validation process indicates that SimSmoke predicts less well for two age groups, which may reflect limitations in the model or in the data used to validate SimSmoke. SimSmoke underpredicted the smoking rate reduction for 1989–2008 for those aged 18–24 y. Consistent with the literature, SimSmoke assigns a small value to the impact of warning labels on the young, who are often thought to ignore or resent warnings. However, Brazil has extensively tested their warnings (as portrayed in Figure 3) with younger smokers [35], so that they may have a greater impact than found in previous studies. In particular, health warnings tested well for non-smokers below 24 y and, although aversive with loss-framed content [36], may have reduced initiation. The strong health warnings may have acted synergistically with price increases and stricter smoke-free air laws to obtain the dramatic reductions in smoking initiation since 2003. Additionally, SimSmoke overpredicts the smoking reduction among those aged 45–64 y. Policies, especially those encouraging cessation, may need to be directed at this age group.
Fig. 3. Examples of warnings on cigarette packages in Brazil. 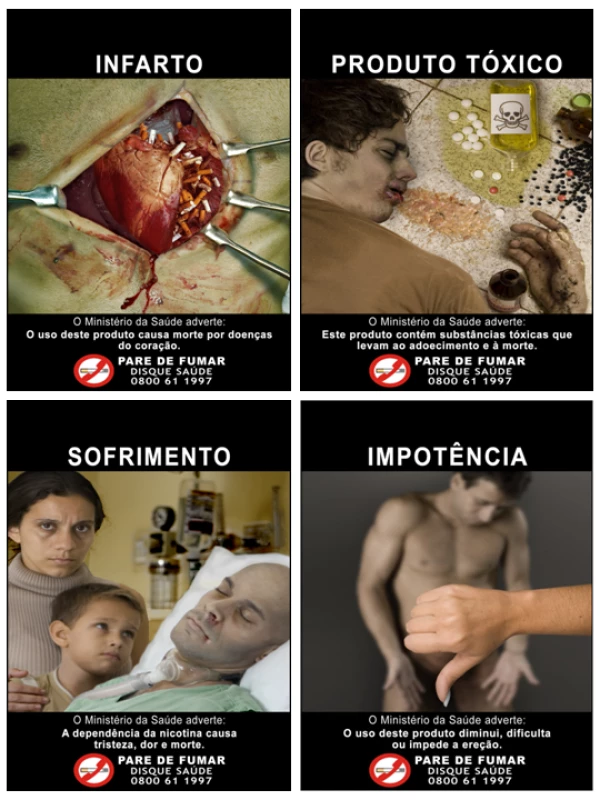
SimSmoke does not consider the effect of income on smoking rates. Past studies yield conflicting results on the role of income [37]. Increased purchasing power could influence price elasticities by making cigarettes more affordable [1]. While there are still considerable disparities in income and in access to health care [38], Brazil has made significant efforts to increase the purchasing power of the poor in recent years. Consequently, SimSmoke may overestimate the role of tobacco taxation among lower income segments of the population and underestimate the role of other policy drivers in reducing prevalence.
The estimated relative risks for total mortality of smokers are based on studies from the US [20],[22]–[24],[29],[39], but the risks may differ in Brazil. In particular, differences between Brazil and the US in smoking intensity and duration may influence relative risk. While studies from other middle income nations, including India [39] and Russia [40], obtain a relative risk comparable to that of the US, others such as for Taiwan and Korea [41]–[43] obtain a lower relative risk of about 1.6–1.7. When we used a relative mortality risk of 1.6 rather than the US rate (about 2.1), the number of SADs was reduced by about 35%, and the number of deaths averted due to policies implemented since 1989 was about 4.5 million by 2050 instead of the 7 million projected with US rates. However, the projections do not include the additional deaths averted due to reductions in second-hand smoke exposure and maternal smoking during pregnancy.
Uncertainty regarding individual policy effect sizes was considered for future projections. Uncertainty also arises when more than one policy is implemented. We assumed that the effect of adding a second policy is proportionally reduced if another policy is implemented, but allowed for synergies between media campaigns and other policies. Upon testing for sensitivity, we found that less than 4% of the estimated reduction due to past policies was from synergies with media campaigns. Furthermore, while past studies provide limited guidance on whether implementing multiple policies yields offsetting or synergistic effects [44], some evidence [45] indicates that public policies are synergistic through their cumulative impact on social norms and their reinforcing effects on motivations to quit. These synergies may be especially important in changing the attitudes held by youth and young adults. Nevertheless, with policies modeled as having a unidirectional effect on smoking rates, SimSmoke does not explicitly model feedbacks through social norms and attitudes, and peer and family behaviors.
Many physicians still do not regularly ask their patients whether they smoke, and are even less likely to follow up with advice to quit and suggestions on how best to quit. A US study [30] found that full physician involvement can reduce smoking prevalence by 0.5% in the first year and increase cessation by 10% in future years. These estimates may not be transferable to Brazil, especially because the rural population in Brazil has more limited access to health care. Yet, in one study, although Brazilians with low educational attainment went to health professionals the least (37%), they showed the same level of willingness to quit smoking and received the same level of smoking cessation counseling as individuals with a high degree of education [1].
In Brazil, tobacco control started with large price increases, followed by strong advertising restrictions and health warnings, and, later, partial smoke-free air laws and increased availability of cessation programs. SimSmoke shows that past policies have been very effective in reducing smoking rates, but there is also a strong potential for future policies consistent with the requirements of the FCTC. While Brazil has implemented many strong policies, tobacco control policies could be strengthened to be fully consistent with the FCTC, a legally binding treaty, with the projected effect of decreasing smoking prevalence by as much as 39% by 2050. By implementing these policies, about 1.3 million (out of almost 9 million) deaths could be averted. Low and middle income nations will face major challenges in the years ahead. Brazil's accomplishments demonstrate that, even for a middle income nation, reducing tobacco use is a “winnable battle” that carries huge dividends in terms of reducing mortality and morbidity. Furthermore, most of the measures that Brazil has undertaken cost the government limited resources and, in the case of taxes, generate revenue. Thus, they can help fund programs for those health challenges that have more direct costs, such as infectious diseases, maternal and child health issues, and the provision of basic health services.
Supporting Information
Zdroje
1. Iglesiasa R, Prabhat J, Pintoc M, Luiza da Costa e Silvad V, Godinhoe J (2007) Health, Nutrition and Population Discussion Paper: tobacco control in Brazil. Washington (District of Columbia): The World Bank.
2. MonteiroC, CavalcanteT, MouraE, ClaroR, SzwarcwaldC (2007) Population-based evidence of a strong decline in the prevalence of smokers in Brazil (1989–2003). Bull World Health Organ 85 : 527–534.
3. SzkloAS, de AlmeidaLM, FigueiredoVC, AutranM, MaltaD, et al. (2012) A snapshot of the striking decrease in cigarette smoking prevalence in Brazil between 1989 and 2008. Prev Med 54 : 162–167.
4. HuT-H, SungH-Y, KeelerTE (1995) Reducing cigarette consumption in California: Tobacco taxes vs. an anti-smoking media campaign. Am J Public Health 85 : 1218–1222.
5. HomerJB, HirschGB (2006) System dynamics modeling for public health: background and opportunities. Am J Public Health 96 : 452–458.
6. LevyDT, BauerJE, LeeHR (2006) Simulation modeling and tobacco control: creating more robust public health policies. Am J Public Health 96 : 494–498.
7. LevyD, BenjakulS, RossH, RitthiphakdeeB (2008) The role of tobacco control policies in reducing smoking and deaths in a middle income nation: results from the Thailand SimSmoke simulation model. Tob Control 17 : 53–59.
8. LevyDT, ChoS, KimY-M, ParkS, SuhM-K, et al. (2010) SimSmoke model evaluation of the effect of tobacco control policies in Korea: the unknown success story. Am J Public Health 100 : 1267–1273.
9. LevyD, TworekC, HahnE, DavisR (2008) The Kentucky SimSmoke tobacco policy simulation model: reaching healthy people 2010 goals through policy change. South Med J 101 : 503–507.
10. LevyDT, BauerJ, RossH, PowellL (2007) The role of public policies in reducing smoking prevalence and deaths caused by smoking in Arizona: results from the Arizona tobacco policy simulation model. J Public Health Manag Pract 13 : 59–67.
11. LevyDT, HylandA, HigbeeC, RemerL, ComptonC (2007) The role of public policies in reducing smoking prevalence in California: results from the California tobacco policy simulation model. Health Policy 82 : 153–166.
12. LevyDT, NikolayevN, MumfordEA (2005) Recent trends in smoking and the role of public policies: results from the SimSmoke tobacco control policy simulation model. Addiction 10 : 1526–1537.
13. LevyDT, BlackmanK, CurrieLM, MonsU (2012) Germany SimSmoke: the effect of tobacco control policies on future smoking prevalence and smoking-attributable deaths in Germany. Nicotine Tob Res E-pub ahead of print.
14. CurrieLM, BlackmanK, ClancyL, LevyDT (2012) The effect of tobacco control policies on smoking prevalence and smoking-attributable deaths in Ireland using the IrelandSS simulation model. Tob Control E-pub ahead of print.
15. NagelhoutGE, LevyDT, BlackmanK, CurrieL, ClancyL, et al. (2011) The effect of tobacco control policies on smoking prevalence and smoking-attributable deaths. Findings from the Netherlands SimSmoke tobacco control policy simulation model. Addiction 107 : 407–416.
16. Levy D, Zaloshjna E, Blackman K, Chaloupka F, Fong GT (2012) The role of tobacco control policies in reducing smoking and deaths caused by smoking in the eighteen nations with the largest smoking burden in tobacco control in low and middle income nations. In: Fong G, Chaloupka F, Yurekli A, editors. Tobacco control policies in low and middle income nations. Rockville: National Cancer Institute.
17. LevyD, BoyleR, AbramsD (2012) Using the Minnesota SimSmoke model to examine the role of past policies on smoking prevalence and smoking attributable deaths in Minnesota. Am J Prev Med In press.
18. LevyD, CurrieL, ClancyL (2012) SimSmokeFinn: how far can tobacco control policies move Finland toward tobacco-free 2040 goals? Scand J Public Health 40 : 544–552.
19. LevyD, CurrieL, ClancyL (2012) Tobacco control policy in the United Kingdom: blueprint for the rest of Europe? Eur J Public Health E-pub ahead of print.
20. US Department of Health and Human Services (1990) The health benefits of smoking cessation: a report of the Surgeon General. Atlanta (Georgia): US Department of Health and Human Services.
21. HughesJR, KeelyJ, NaudS (2004) Shape of the relapse curve and long-term abstinence among untreated smokers. Addiction 99 : 29–38.
22. Thun MJ, Myers DG, Day-Lally C, Namboodiri NM, Calle EE, et al. (1997) Age and the exposure-response relationships between cigarette smoking and premature death in Cancer Prevention Study II. In: National Cancer Institute, editor. Changes in cigarette related disease risks and their implication for prevention and control. Bethesda (Maryland): National Cancer Institute. pp. 383–475.
23. National Cancer Institute (1997) Changes in cigarette-related disease risks and their implication for prevention and control. Bethesda (Maryland): National Cancer Institute.
24. US Department of Health and Human Services (1989) Reducing the health consequences of smoking: 25 years of progress: a report of the Surgeon General. DHHS Publication No. [CDC] 89-8411. Atlanta (Georgia): Centers for Disease Control and Prevention.
25. CorreaPC, BarretoSM, PassosVM (2009) Smoking-attributable mortality and years of potential life lost in 16 Brazilian capitals, 2003: a prevalence-based study. BMC Public Health 9 : 206.
26. OliveiraA, ValenteJ, LeiteI (2008) The disease burden attributable to smoking in the state of Rio de Janeiro, Brazil 2000. Clinics (Sao Paulo) 63 : 215–222.
27. SuzukiI, HamadaGS, ZamboniMM, Cordeiro PdeB, WatanabeS, et al. (1994) Risk factors for lung cancer in Rio de Janeiro, Brazil: a case-control study. Lung Cancer 11 : 179–190.
28. MenezesAM, HortaBL, OliveiraAL, KaufmannRA, DuquiaR, et al. (2002) [Attributed risk to smoking for lung cancer, laryngeal cancer and esophageal cancer.]. Rev Saude Publica 36 : 129–134.
29. Burns DM, Lee L, Shen LZ, Gilpin E, Tolley HD, et al. (1997) Cigarette smoking behavior in the United States. In: National Cancer Institute, editor. Changes in cigarette-related disease risks and their implication for prevention and control. Smoking and Tobacco Control Monograph 8. Bethesda (Maryland): National Cancer Institute. pp. 13–112.
30. LevyD, GrahamA, MabryP, AbramsD, OrleansCT (2010) Modeling the impact of smoking cessation treatment policies on quit rates. Am J Prev Med 38: S364–S372.
31. World Health Organization (2008) WHO report on the global tobacco epidemic, 2008: the MPOWER package. Geneva: World Health Organization.
32. Instituto Nacional de Câncer/Ministério da Saúde (2010) Brazil global adult tobacco survey report. Rio de Janeiro: Instituto Nacional de Câncer
33. HopkinsDP, BrissPA, RicardCJ, HustenCG, Carande-KulisVG, et al. (2001) Reviews of evidence regarding interventions to reduce tobacco use and exposure to environmental tobacco smoke. Am J Prev Med 20 : 16–66.
34. JhaP, ChaloupkaFJ (2000) The economics of global tobacco control. BMJ 321 : 358–361.
35. NascimentoBE, OliveiraL, VieiraAS, JoffilyM, GleiserS, et al. (2008) Avoidance of smoking: the impact of warning labels in Brazil. Tob Control 17 : 405–409.
36. SzkloAS, CoutinhoES (2010) The influence of smokers' degree of dependence on the effectiveness of message framing for capturing smokers for a quitline. Addict Behav 35 : 620–624.
37. Jha P, Chaloupka F, editors(2000) Tobacco control in developing countries. New York: Oxford University Press.
38. AlmeidaC, BravemanP, GoldMR, SzwarcwaldCL, RibeiroJM, et al. (2001) Methodological concerns and recommendations on policy consequences of the World Health Report 2000. Lancet 357 : 1692–1697.
39. JhaP, JacobB, GajalakshmiV, GuptaPC, DhingraN, et al. (2008) A nationally representative case-control study of smoking and death in India. N Engl J Med 358 : 1137–1147.
40. PerlmanF, BobakM (2008) Socioeconomic and behavioral determinants of mortality in posttransition Russia: a prospective population study. Ann Epidemiol 18 : 92–100.
41. JeeSH, LeeJK, KimIS (2006) Smoking-attributable mortality among Korean adults: 1981–2003. Korean J Epidemiol 28 : 92–99.
42. KhangYH, LynchJW, Jung-ChoiK, ChoHJ (2008) Explaining age-specific inequalities in mortality from all causes, cardiovascular disease and ischaemic heart disease among South Korean male public servants: relative and absolute perspectives. Heart 94 : 75–82.
43. WenC-P, TsaiS-P, ChenC-J, ChengT-Y (2004) The mortality risks of smokers in Taiwan: part I: cause-specific mortality. Prev Med 39 : 528–535.
44. LevyDT, GitchellJG, ChaloupkaF (2004) The effects of tobacco control policies on smoking rates: a tobacco control scorecard. J Public Health Manag Pract 10 : 338–351.
45. US Department of Health and Human Services (2000) Reducing tobacco use: a report of the Surgeon General. Atlanta (Georgia): Centers for Disease Control and Prevention
Štítky
Interní lékařství
Článek vyšel v časopisePLOS Medicine
Nejčtenější tento týden
2012 Číslo 11- Není statin jako statin aneb praktický přehled rozdílů jednotlivých molekul
- Magnosolv a jeho využití v neurologii
- Biomarker NT-proBNP má v praxi široké využití. Usnadněte si jeho vyšetření POCT analyzátorem Afias 1
- Moje zkušenosti s Magnosolvem podávaným pacientům jako profylaxe migrény a u pacientů s diagnostikovanou spazmofilní tetanií i při normomagnezémii - MUDr. Dana Pecharová, neurolog
- Antikoagulační léčba u pacientů před operačními výkony
-
Všechny články tohoto čísla
- Population Health Impact and Cost-Effectiveness of Tuberculosis Diagnosis with Xpert MTB/RIF: A Dynamic Simulation and Economic Evaluation
- The Ottawa Statement on the Ethical Design and Conduct of Cluster Randomized Trials
- The Case for a Smoker's License
- Screening for Chronic Kidney Disease: Preventing Harm or Harming the Healthy?
- The Case against a Smoker's License
- The Long-Term Health Consequences of Child Physical Abuse, Emotional Abuse, and Neglect: A Systematic Review and Meta-Analysis
- Leisure Time Physical Activity of Moderate to Vigorous Intensity and Mortality: A Large Pooled Cohort Analysis
- New Signal Functions to Measure the Ability of Health Facilities to Provide Routine and Emergency Newborn Care
- G6PD Deficiency Prevalence and Estimates of Affected Populations in Malaria Endemic Countries: A Geostatistical Model-Based Map
- Chinese-Style Decentralization and Health System Reform
- Maternal Health Is Women's Health: A Call for Papers for Year 2 of the Maternal Health Task Force–PLOS Collection
- New Translational Research Provides Insights into Liver Dysfunction in Sepsis
- The Brazil SimSmoke Policy Simulation Model: The Effect of Strong Tobacco Control Policies on Smoking Prevalence and Smoking-Attributable Deaths in a Middle Income Nation
- Screening and Rapid Molecular Diagnosis of Tuberculosis in Prisons in Russia and Eastern Europe: A Cost-Effectiveness Analysis
- Risk Models to Predict Chronic Kidney Disease and Its Progression: A Systematic Review
- Liver Dysfunction and Phosphatidylinositol-3-Kinase Signalling in Early Sepsis: Experimental Studies in Rodent Models of Peritonitis
- PLOS Medicine
- Archiv čísel
- Aktuální číslo
- Informace o časopisu
Nejčtenější v tomto čísle- The Long-Term Health Consequences of Child Physical Abuse, Emotional Abuse, and Neglect: A Systematic Review and Meta-Analysis
- G6PD Deficiency Prevalence and Estimates of Affected Populations in Malaria Endemic Countries: A Geostatistical Model-Based Map
- Screening for Chronic Kidney Disease: Preventing Harm or Harming the Healthy?
- Screening and Rapid Molecular Diagnosis of Tuberculosis in Prisons in Russia and Eastern Europe: A Cost-Effectiveness Analysis
Kurzy
Zvyšte si kvalifikaci online z pohodlí domova
Autoři: prof. MUDr. Vladimír Palička, CSc., Dr.h.c., doc. MUDr. Václav Vyskočil, Ph.D., MUDr. Petr Kasalický, CSc., MUDr. Jan Rosa, Ing. Pavel Havlík, Ing. Jan Adam, Hana Hejnová, DiS., Jana Křenková
Autoři: MUDr. Irena Krčmová, CSc.
Autoři: MDDr. Eleonóra Ivančová, PhD., MHA
Autoři: prof. MUDr. Eva Kubala Havrdová, DrSc.
Všechny kurzyPřihlášení#ADS_BOTTOM_SCRIPTS#Zapomenuté hesloZadejte e-mailovou adresu, se kterou jste vytvářel(a) účet, budou Vám na ni zaslány informace k nastavení nového hesla.
- Vzdělávání


