-
Články
- Vzdělávání
- Časopisy
Top články
Nové číslo
- Témata
- Kongresy
- Videa
- Podcasty
Nové podcasty
Reklama- Kariéra
Doporučené pozice
Reklama- Praxe
Background sequence characteristics influence the occurrence and severity of disease-causing mtDNA mutations
MtDNA mutations are a major cause of genetic disease. Many of these variants have recurred several times in different populations and on diverse haplogroup backgrounds, but the clinical presentation of mutations causing Leber Hereditary Optic Neuropathy (LHON: m.14484T>C, m.3460A<G, m.11778A>G) are strongly associated with a specific mtDNA haplogroup. This raises the possibility that many pathogenic mtDNA mutations are subject to the same effects. Here, our analysis of 30,506 human mtDNA sequences shows that the association between disease-causing mtDNA mutations and background mtDNA haplogroups is not only restricted to three disease-causing mtDNA mutations known to cause LHON. The frequent recurrence of the same mutations on a population clade, and the reduced frequency of European mtDNAs harboring two or more diseases-causing mutations, suggest that the population mtDNA background influences the risk of developing mtDNA mutations. Our analysis also shows that disease-causing mtDNA mutations also occur more frequently on younger mtDNAs. This implies that, once formed, the mutations are selected against. These findings indicate that the clinical interpretation of mtDNA variants should be performed within an ethnogeographic context.
Published in the journal: . PLoS Genet 13(12): e32767. doi:10.1371/journal.pgen.1007126
Category: Research Article
doi: https://doi.org/10.1371/journal.pgen.1007126Summary
MtDNA mutations are a major cause of genetic disease. Many of these variants have recurred several times in different populations and on diverse haplogroup backgrounds, but the clinical presentation of mutations causing Leber Hereditary Optic Neuropathy (LHON: m.14484T>C, m.3460A<G, m.11778A>G) are strongly associated with a specific mtDNA haplogroup. This raises the possibility that many pathogenic mtDNA mutations are subject to the same effects. Here, our analysis of 30,506 human mtDNA sequences shows that the association between disease-causing mtDNA mutations and background mtDNA haplogroups is not only restricted to three disease-causing mtDNA mutations known to cause LHON. The frequent recurrence of the same mutations on a population clade, and the reduced frequency of European mtDNAs harboring two or more diseases-causing mutations, suggest that the population mtDNA background influences the risk of developing mtDNA mutations. Our analysis also shows that disease-causing mtDNA mutations also occur more frequently on younger mtDNAs. This implies that, once formed, the mutations are selected against. These findings indicate that the clinical interpretation of mtDNA variants should be performed within an ethnogeographic context.
Introduction
Human mitochondrial DNA (mtDNA) is exclusively maternally inherited and undergoes negligible recombination at the population level. As humans emerged from Africa and populated the globe, different sub-populations acquired single nucleotide variants (SNVs) that define geographically-restricted mtDNA ‘haplogroups’[1]. Some rare genetic variants have emerged as a common cause of inherited metabolic disease, affecting 1 in 10,000 of the population[2]. Many of these variants have recurred several times in different populations and on diverse haplogroup backgrounds, but the clinical presentation of mutations causing Leber Hereditary Optic Neuropathy (LHON: m.14484T>C, m.3460A<G, m.11778A>G) are strongly associated with a specific mtDNA haplogroup[3, 4]. This raises the possibility that many (but not all[5]) pathogenic mtDNA mutations are subject to the same effects. This has not been systematically studied to date, in large part because of the limited number of sequences available for analysis.
Results
Data description and quality control
30,506 mtDNA sequences were downloaded from GenBank (S1 Table and S2 Table). These included 3,852 sequences from macro-haplogroups L, 6,202 from M and 20,452 from N. In 17,815 of the 30,506 mtDNA sequences it was possible to identify all known appropriate haplogroup markers down to the sub-haplogroup level [6, 7] (http://www.phylotree.org/tree/index.htm) (referred to as ‘sub-haplogroup tagged’ S1 Table). Next we compared the frequency of the variants to the remaining 12,691 sequences (referred to as non-sub-haplogroup tagged), stratifying for each macro-haplogroup (2,710 sequences from L, 2,619 from M, and 7,362 from N; S1 Table). The allele frequencies were strongly correlated between the two groups (R2 = 0.842, p-value < 2.2e-16 for macro-haplogroup L; R2 = 0.968, p-value < 2.2e-16 for macro-haplogroup M; R2 = 0.988, p-value < 2.2e-16 for macro-haplogroup N, Person’s correlation test; Fig 1A, S1A Fig).
Fig. 1. mtDNA sequence quality control. 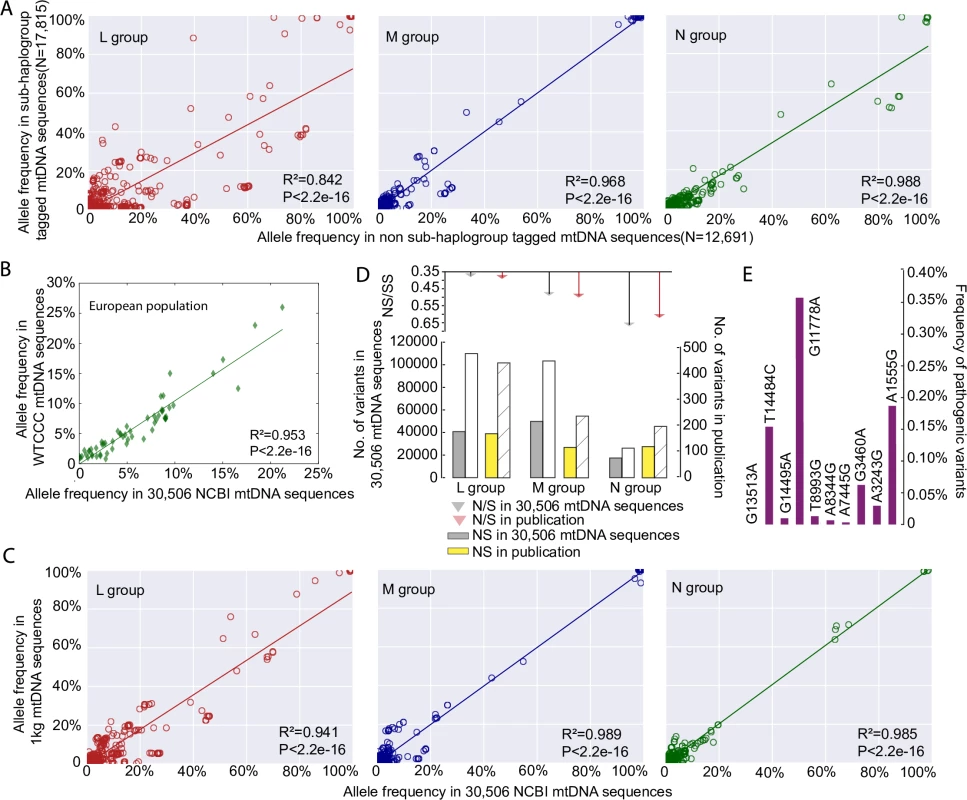
(A) Correlation of allele frequencies of the variants between 17,815 sub-haplogroup tagged mtDNA sequences and the remaining 12,691 non sub-haplogroup tagged mtDNA sequences. (B) Correlation of 59 mtDNA variant frequencies between 9,935 independent population controls from the Wellcome Trust Case Control Consortium and this study. (C) Correlation of allele frequencies of the variants between 1,370 mtDNA sequences from 1000 Genome Project (1kg) and 30,506 GenBank NCBI mtDNA sequences. (D) Ratio of non-synonymous (NS) to synonymous (S) mtDNA variants in 30,506 mtDNA sequences compared to an independent published dataset [9], the numbers of NS and S are shown in bar chart at the bottom. (E) Allele frequencies of ten common disease-causing mutations. There was no difference when compared to previously published values determined through a population-based study in sequential healthy live-births in Europeans[10]. Next we compared the allele frequencies in the 17,790 European haplogroup N(R) sequences to an independent sample of 9935 population controls from the Wellcome Trust Case Control Consortium [8]. Allele frequencies from the 59 mtDNA variants present in both datasets were highly correlated (R2 = 0.953, p-value < 2.2e-16, Person’s correlation test; Fig 1B). We then compared 30,506 mtDNA sequences with 1,370 mtDNA sequences from 1000 Genome Project (see Methods), which includes mtDNA sequences from across the world (462 from macro-haplogroup L, 271 from M, and 637 from N). The allele frequencies of the mtDNA variants were highly correlated between two datasets for each macro-haplogroup (R2 = 0.941, p-value < 2.2e-16 for macro-haplogroup L; R2 = 0.989, p-value < 2.2e-16 for macro-haplogroup M; R2 = 0.985, p-value < 2.2e-16 for macro-haplogroup N; Pearson’s correlation test; Fig 1C, S2 Fig, S3 Fig). Further evidence of quality control came from an independent comparison of the GenBank dataset to 1,125 published global human mtDNA sequences from the literature [9], where the ratios of non-synonymous variants (NS) and synonymous variants (SS) within major haplogroups were no different (p-value > 0.05, Fisher test; Fig 1D). Finally the allele frequencies of common disease-causing mutations were no different to previously published values derived from a healthy population birth cohort in Europeans (i.e. an established ‘population carrier frequency’ for these mutations, p-value > 0.05, Fisher test; Fig 1E)[10], providing further evidence that our dataset is not significantly enriched with sequences derived from patients with inherited mtDNA diseases in the European population. A similar comparison was not currently possible for African and Asian mtDNAs. However, we saw no relationship the pathogenicity score of specific alleles and the difference in allele frequency and sub-haplogroup tagged vs. non-sub-haplogroup tagged mtDNAs in our data set (See Methods for an explanation of pathogenicity scores, S1B Fig). When taken together, these analysis (Fig 1A–1E), indicate that the 30,506 GenBank sequences are a representative sample of the background populations and not significantly enriched for rare population variants or pathogenic mutations identified through patients presenting with mitochondrial diseases.
Determining the disease caused mutations
The 30,506 mtDNA sequences were predicted to cause 10,166 unique single amino acid substitutions (L = 3,732, M = 4,887, N = 8,427, Fig 2A). There was no difference in the frequency distribution for mtDNA variants between the macro-haplogroups (p-value = 1, ANOVA test; Fig 2B). Next we determined which variants were likely to be pathogenic. Ninety of the 202 proposed pathogenic mtDNA variants listed on the ClinVar database[11] were found in the 30,506 mtDNA sequences studied here (S3 Table). Incorporating published and on-line evidence of pathogenicity (see Methods), the number of likely pathogenic mutations reduced from 90 to 57(S4 Table).
Fig. 2. The distribution of variant frequency and assessing the pathogenicity score in 30,506 mtDNA sequences. 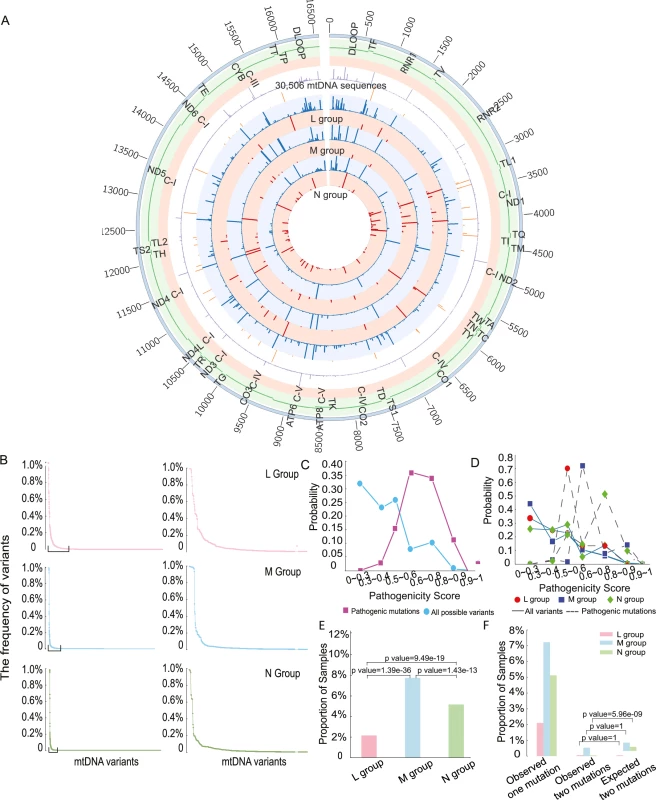
(A) Circos plot summarizing all of the genetic data in 30,506 mtDNA sequences. From outside the circle to inside: (1) mtDNA position, (2) mtDNA genes, (3) mtDNA Complex, (4) frequency of all variants in 30,506 mitochondrial sequences(range 0 to 98.70%), (5) frequency of diseases-causing mutations in 30,506 mitochondrial sequences(range 0 to 0.89%), (6) frequency of all variants in L group(range 0 to 99.45%), (7) frequency of diseases-causing mutations in L group(range 0 to 0.65%), (8) frequency of all variants in M group(range 0 to 99.60%), (9) frequency of diseases-causing mutations in M group(range 0 to 3.11%), (10) frequency of all variants in N group(range 0 to 98.60%), (11) frequency of diseases-causing mutations in N(range 0 to 1.26%), Color code for circles (4)–(11): Red—frequency of diseases-causing mutations, blue—frequency of all variants. (B) The distribution of frequency of variants in each macro-haplogroup. MtDNA variants in were ordered based on frequency from high to low. The right-hand panel highlights the variants with frequency above 0.5% in each group. (C) Probability distributions of the observed pathogenicity scores for all population variants and defined disease-causing mutations. (D) Probability distributions of the pathogenicity scores for all variants and disease-causing mutations within each macro-haplogroup. (E) Proportion of samples carrying disease-causing mutations. (F) Percentage of mtDNA sequences harboring two of more disease-causing mutations. Pathogenicity of variants in macro-haplogroups L, M and N
We initially focused on the pathogenicity of all variants within protein-encoding genes. 2,709 variants were present in 30,506 sequences, including 34 disease-causing mutations (S4 Table). As expected, variants with a higher pathogenicity score were less frequent in the population, and disease-causing mutations with a higher pathogenicity score were less frequent in the population (Fig 2C). Likewise, as expected, the probability distribution of pathogenicity scores for disease-causing mutations was significantly greater than the overall distribution of pathogenicity scores in the entire population (mean = 0.59 for disease-causing mutations, mean = 0.37 for all possible variants; two-sample t-test, p-value < 2.2e-16, Fig 2C). However, we were surprised to see that disease-causing mutations on the macro-haplogroup N and M backgrounds had significantly higher pathogenicity score than those occurring on the macro-haplogroup L background (mean = 0.47 for L group, mean = 0.62 for M group, mean = 0.59 for N group; L versus M: p-value = 1.959e-11, L versus N: p-value = 7.992e-08, M versus N: p-value = 8.967e-07, two-sample t test, Fig 2D). These differences could not be accounted for by the frequency of specific mutations, which did not follow the same trend (S4 Fig). 83(2.2%) mtDNA sequences carried at least one disease-causing mutation in L group, 481 (7.8%) in M group and 1,057 (5.2%) in N group. Group M sequences had a higher proportion of sequences carrying disease-causing mutations 481 (7.8%), followed by group N sequences 1,057 (5.2%), with the lowest in group L 83 (2.2%) (L versus M: p-value = 1.39e-36, L versus N: p-value = 9.49e-19, M versus N: p-value = 1.43e-13, Fisher test, Fig 2E).
Based on the overall frequency of disease causing mutations, we estimated the likelihood of a second mutation occurring by chance on the same genome (Fig 2F). For macro-haplogroups L and M, the observed frequency of mtDNAs with two of more disease-causing mutations was no different to the chance co-occurrence. However, for macro-haplogroup N sequences, the number of mtDNA sequences harboring two of more disease-causing mutations was 6-fold lower than expected by chance (p-value = 5.96e-09, Fisher test; Fig 2F). These observations implicate the mtDNA sequence background in the likelihood of acquiring or retaining a disease-causing mutation.
We then determined the frequency of the 57 disease-causing mutations on the ‘major’ haplogroups. Twenty-five (43.9%) of the 57 diseases-causing mutations were present on more than one macro-haplogroup, and 34 (59.6%) were present on more than one major haplogroup (Fig 3A, S5 Fig), indicating recurrent mutation events. 23 (40.4%) of the pathogenic mutations were only found on one haplogroup. Of these, m.4136A>G, m.4317A>G, m.7444G>A, m.11696G>A. and m.13637A>G were recurrent mutations based on analysis of the entire mtDNA sequence. This suggests that specific mtDNA mutations recur on specific mtDNA haplogroups, implying that the background haplogroup predisposes to the original mutation event, or the subsequent fixation of the allele on a particular maternal lineage. On the other hand, m.5631G>A (L), m.10663T>C (L), m.8313G>A (M), m.12770A>G (M), m.3890G>A (N), and m.14482C>A (N) were only seen on one clade, consistent with a single founder event. This raises the possibility that these several ‘disease-causing’ mutations are actually rare sub-haplogroup markers and not directly pathogenic (eg m.4295A>G, m.6489C>A). Overall, we found statistical evidence of haplogroup clustering for 10 (29.4%) of the 34 recurrent disease-causing mtDNA mutations after correcting for the sample size within each comparison (p-value < 0.01, Fisher test; Fig 3B).
Fig. 3. Frequency of disease causing mtDNA mutations in each macro-haplogroup. 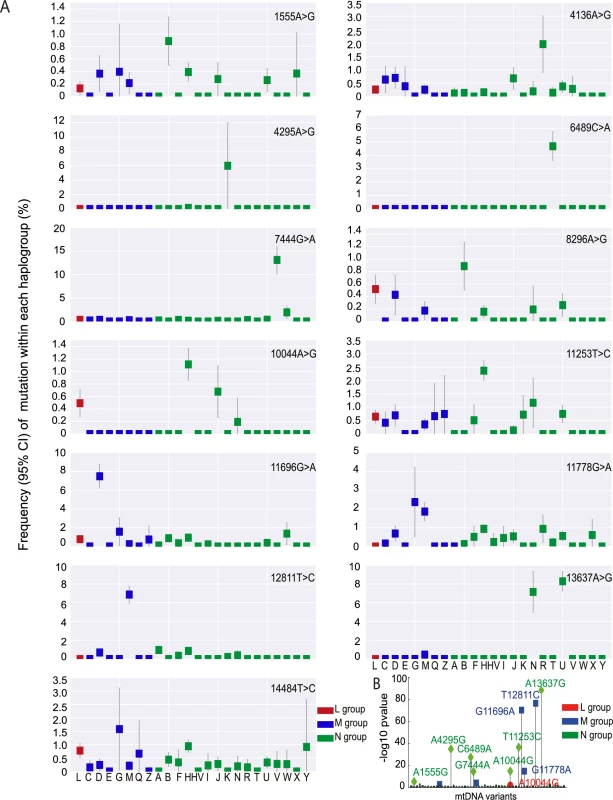
(A) Frequency of 13 disease causing mutations present at >0.1% frequency in each haplogroup. (B) Disease-causing mutations significantly associated with specific mtDNA haplogroups. Uncorrected p-value thresholds are shown. Mutational signature
We then determined the relative frequency of mutations within all 96 possible flanking nucleotide triplets[12]. Overall, across all macro-haplogroups we saw a greater prominence of C>T/A>G and T>C/A>G substitutions for all variants (p< 2.2e-16, Fisher test; Fig 4A–4C), and for disease causing mutations (p< 2.2e-16, Fisher test; Fig 4D–4F). In order to confirm the prominence of C>T and T>C mutations observed were not due to the selection of the rCRS [13] as the “reference” by which the mutations are classified, we realigned 30,506 mtDNA sequences to Reconstructed Sapiens Reference Sequence (RSRS) [14]. We observed similar patterns, with T>C and C>T substitutions frequently observed (S6 Fig), suggesting the profiles of mutational signatures were not driven by the alignment process and are independent of the reference sequence used in the analysis.
Fig. 4. The mutational signatures observed in 30,506 mtDNA sequences. 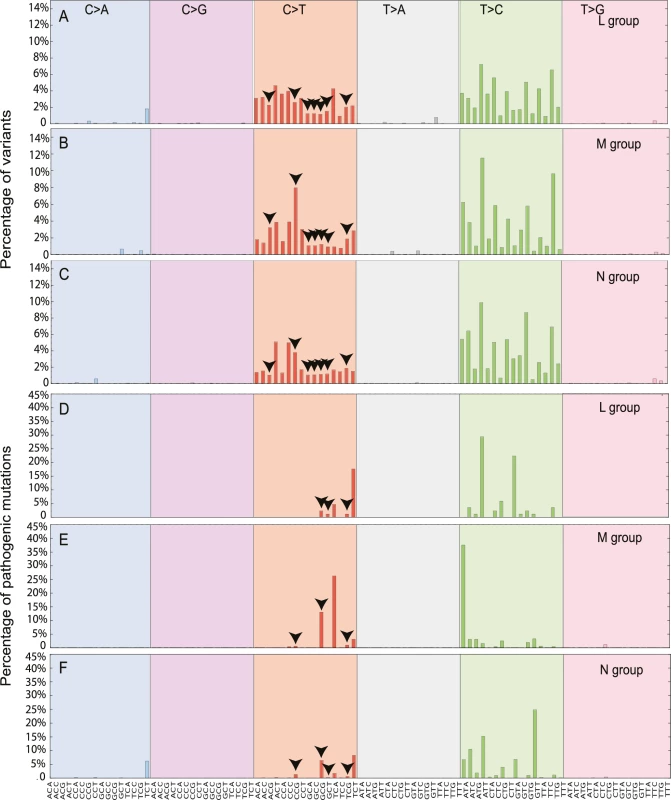
Each signature is displayed according to the 96 substitution classification defined by the substitution class and sequence context immediately 3’ and 5’ to the mutated base. The probability bars for the six types of substitutions are displayed in different colors and labeled at the top of the graph. The mutation types are on the horizontal axes at the bottom of the graph. (A) All possible variants in macro-haplogroup L. (B) All possible variants in macro-haplogroup M. (C) All possible variants in macro-haplogroup N. (D) All diseases-causing mutations in macro-haplogroup L. (E) All diseases-causing mutations in macro-haplogroup M. (F) All diseases-causing mutations in macro-haplogroup N. The arrows highlight the variants in CpG dinucleotides. We also observed that the higher mutability of CpG dinucleotides in disease-causing mutations when compared to all variants (CpG%, p-value = 0.00017, Fisher exact test; S7 Fig and S5 Table). Although the methylation of mtDNA appears to be rare in somatic tissues [15], nuclear genome methylation changes substantially during embryonic and germ-line development [16], raising the possibility that methylation of mtDNA CpGs during early development contributes to the origin of de novo mtDNA mutations [17]. Intriguingly, macro-haplogroup M had highest CpG% for all variants (19.93%; L versus M, p-value = 0; and M versus N p-value = 0, Fisher exact test) and defined diseases-causing mutations (21.21%; L versus M, p-value = 0.00049; and M versus N, p-value = 1.06e-06). By contrast, macro-haplogroup L had much lower CpG% than other two groups for disease-causing mutations (5.88%; L versus M p-value = 0.00049 and L versus N p-value = 0.15) (S7 Fig and S6 Table). These findings add further weight to the hypothesis that haplogroup-specific sequence context influences the acquisition of mtDNA mutations.
The age of mtDNA sequences
We then estimated the age of the each mtDNA sequence based on the major haplogroup classification, using the Rho statistic[18]. Overall, variants with higher pathogenicity scores were found on ‘younger’ (more recent) mtDNA sequences (Fig 5A and 5B, p-value < 2.2e-16, Wilcoxon Rank test). Disease-causing mutations were also found on younger mtDNA sequences (Fig 5A, p-value = 0.019, Wilcoxon Rank test). When we studied the same relationship after removing the main pathogenic allele from each sequence in silico (Fig 5C and 5D), we did not observe an association between the remaining sequence and the age of predicted age of the sequence. This indicates that the association between disease-causing variants and the age of the mitochondrial genome is driven by the pathogenic variant itself and not the entire mtDNA sequence. Although it is possible that Rho dating may be inaccurate in the absence of population expansions [19], these observations are in keeping with the effects of natural section acting on specific pathogenic variants.
Fig. 5. Predicted age of each mtDNA sequence. 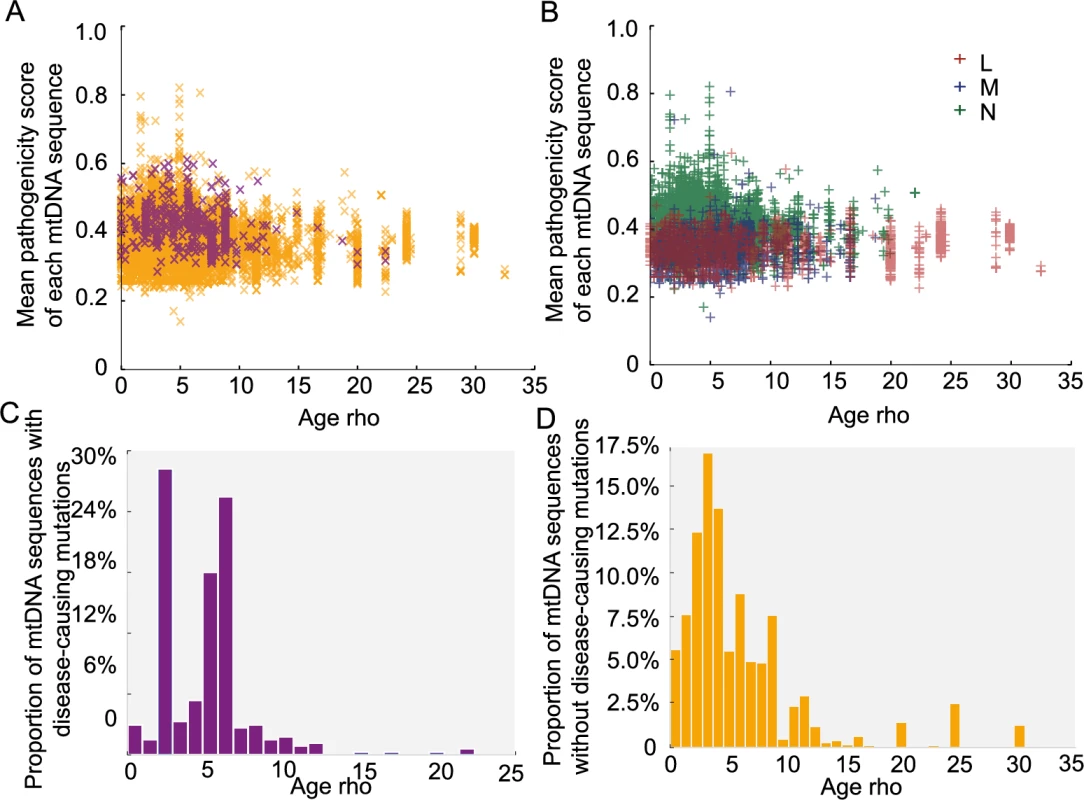
Age calculations are based on the Rho. (A) Distribution of the mean pathogenicity scores of each mtDNA sequence and predicted age (Rho). Orange “x”: mtDNA sequence not carrying disease-causing mutations; Purple “x”: mtDNA sequence carrying disease-causing mutations. (B) Distribution of mean pathogenicity scores of each mtDNA sequence and predicted age (Rho) (C) Distribution of mtDNA sequences with disease-causing mutations according to predicted age (Rho). (D) Distribution of mtDNA sequences with non-disease-causing mutations according to predicted age (Rho). The pathogenicity of mtDNA tRNAs
Finally, we estimated the pathogenicity scores for 207 variants in tRNA genes [20, 21]. Seventy-four tRNA variants were present in 30,506 sequences, including 16 previously defined disease-causing mutations (S4 Table). Consistent with the pathogenicity scores for non-synonymous variants, all tRNA variants and disease-causing tRNA mutations with a higher pathogenicity score were less frequent in the population (Fig 6A). Likewise, the probability distributions for disease-causing tRNA mutations was significantly greater than the overall distribution of pathogenicity scores in the entire population (mean = 0.427 for disease-causing tRNA mutations, mean = 0.102 for all possible tRNA variants; p-value < 2.2e-16, two-sample t test; Fig 6A). Again, we observed that disease-causing tRNA mutations on macro-haplogroups N and M had significantly higher pathogenicity score than those occurring on macro-haplogroup L (mean = 0.36 for L group, mean = 0.51 for M group, mean = 0.43 for N group; L versus M: p-value = 0.010, L versus N: p-value = 0.005, M versus N: p-value = 0.079, two - sample t test; Fig 6B). However, there was no correlation between either all tRNA variants or disease-causing tRNA mutations with the ages of the mtDNA sequences (Fig 6C and 6D). This could reflect the limited number of tRNA variants in the data set, or that the effects of selection cannot be detected for homoplasmic tRNA gene variants. This is in keeping with animal data, where there is severe selection against protein coding variants within one or two generations, but not tRNA variants[22].
Fig. 6. Pathogenicity of mtDNA tRNA variants in 30,506 mtDNA sequences. 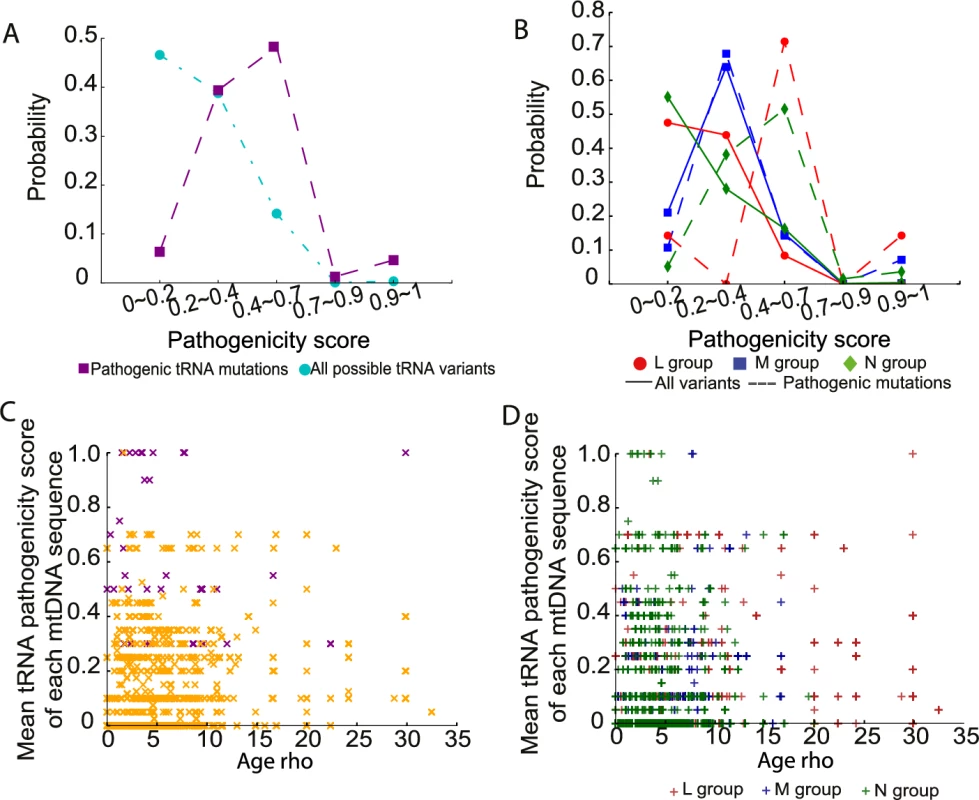
(A) Probability distributions of the observed pathogenicity scores for all tRNA variants and defined disease-causing tRNA mutations. (B) Probability distributions of the pathogenicity scores for all tRNA variants and disease-causing tRNA mutations within each macro-haplogroup. (C) Distribution of the mean pathogenicity scores for tRNA variants of each mtDNA sequence and predicted age (Rho). Orange “x”: mtDNA sequence not carrying disease-causing tRNA mutations; Purple “x”: mtDNA sequence carrying disease-causing tRNA mutations. (D) Distribution of mean pathogenicity scores for tRNA variants of each mtDNA sequence and predicted age (Rho) within each macrohaplogroup. Discussion
Our analysis of 30,506 human mtDNA sequences shows that the association between disease-causing mtDNA mutations and background mtDNA haplogroups is not only restricted to three disease-causing mtDNA mutations known to cause LHON. The frequent recurrence of the same mutations on a population clade, and the reduced frequency of European mtDNAs harboring two or more diseases-causing mutation, both suggest that the population mtDNA background influences the risk of developing mtDNA mutagenesis. Although it is conceivable that this is due to the functional consequences of haplogroup variants, perhaps though the generation of increased oxygen free radicals, or the segregation of heteroplasmic variants, our analysis indicates that this is unlikely because we also saw an association of mutations with underlying sequence characteristics (such as CpG%) that are not directly linked to oxidative phosphorylation or heteroplasmy segregation.
Our analysis also shows that disease-causing mtDNA mutations also occur more frequently on younger mtDNAs. This implies that, once formed, the mutations are selected against. Although tempting to think that this pattern simply reflects an ascertainment bias related to the number of defined disease-causing mtDNA mutations in populations of European origin, the data suggests that this is not the case. Firstly, the majority of mtDNA mutations were not restricted to specific continental populations; and secondly a greater proportion of known disease-causing mutations were seen in the sequences derived from the Asian population (Fig 3 and S5 Fig). To our mind, the simplest explanation is that the more severe homoplasmic mutations have been removed from the older populations through natural selection. A similar pattern has been noted previously in older African mtDNA sequences[23], which have been exposed to the effects of purifying selection for a longer period of time. This further endorses the validity of our dataset and analysis. Thus, both a predilection to mutate and natural selection explain the associations between different mtDNA haplogroups and known-pathogenic mutations, thereby explaining why different ethnic groups are more or less likely to present with a specific mtDNA disease. However, it is important to note that other population genetic effects could have influenced the current mtDNA landscape. For example, recent ancient mtDNA studies point to a European population bottleneck ~14,500 years ago[24], which could also explain the relative lack of evidence of selection in extant Europeans.
Our study was restricted to the major alleles within each mtDNA sequence, and not designed to study the effects of mtDNA heteroplasmy. The prospective analysis of mtDNA heteroplasmy and the segregation of heteroplasmic variants in the population adds a further complexity, but might cast further light on the mechanisms we propose. However, we did observe common heteroplasmic mtDNAs within the dataset across all populations (eg. m.3243A>G), and these variants followed the same overall patterns described here. In addition, no phenotypic data was available. Although a limitation, even without this information we can draw some conclusions. First, despite the well-established strong association between LHON families harboring m.11778A>G, m.3460A>G, and m.14484T>C and mtDNA haplgroup J, at the population level, these variants are found across a broad range of mtDNA haplogroups in all three continental groups (Fig 3). In this study, m.14484T>C was found on multiple haplogroups, with an allele frequency up to 1.5% on haplogroup M(G). This contrasts sharply with the almost exclusive association of m.14484T>C with haplogroup J described in epidemiological studies of LHON[3, 4]. This strongly supports the view that haplogroup J modifies the clinical penetrance of the m.11778A>G, m.3460A>G, and m.14484T>C mutations, and that the association is not due to an increased mutation rate. Although we cannot be certain, this indicates that the mutation has a reduced penetrance in certain contexts, perhaps related to the nuclear genetic background or environmental factors. Whichever is the case, our findings indicate that the clinical interpretation of mtDNA variants should be performed within an ethnogeographic context.
Materials & methods
mtDNA sequence source
30,619 human mtDNA sequences sampled from across the globe downloaded from GenBank (https://www.ncbi.nlm.nih.gov/genbank/). 113 were removed due to poor sequence quality. 30,506 sequences were included in this study and aligned to Revised Cambridge Reference Sequence (rCRS)[25] and Reconstructed Sapiens Reference Sequence (RSRS)[14] using BLASTn (S1 Table).
Phylogenetic analysis
Haplogroup assignment was performed using HaploGrep 2[7]. Sequences were classified into macro-haplogroups (L, M and N), major and sub-haplogroups based on the mtDNA phylogenetic tree[6] (http://www.phylotree.org/tree/index.htm) (S2 Table), including 3,852, 6,202 samples and 20,452 samples, respectively. Coalescence times were estimated using the ρ statistic (average distance of the haplotypes of a clade from the respective root haplotype) accompanied by a heuristic estimate of the standard error (σ) calculated from an estimate of the genealogy[18].
Sequence quality control datasets
‘Sub-haplogroup tagged’ mtDNA sequences in GenBank database
We selected the ‘sub-haplogroup tagged’ mtDNA sequences it was possible to identify all known appropriate haplogroup markers down to the sub-haplogroup level [6, 7] (http://www.phylotree.org/tree/index.htm), including 1,142 sequences from macro-haplogroups L, 3,583 from M and 13,090 from N(S1 Table). Next we compared the frequencies of the variants to the remaining 12,691 sequences (non - sub-haplogroup tagged), stratifying for each macro-haplogroup (2,710 sequences from L, 2,619 from M and 7,362 from N; S1 Table). The allele frequency (AF) difference of each variant between two groups was calculated as log2 (ratio of frequencies from two groups).
mtDNA sequences in 1000 genome project
mtDNA sequences from 2,182 samples were downloaded from 1000 Genome Project (http://www.internationalgenome.org/). mtDNA haplogroup of each sequence was predicted using HaploGrep 2[7] and mt-classifier[21]. We excluded the low quality mtDNA sequences using the following criteria: 1) when <90% of the known haplogroup markers were present for each mtDNA sequence; 2) when more than one haplogroup prediction was reported; 3) when the haplogroups predicted by two prediction tools were inconsistent. There were 1,370 mtDNA sequences, including 462 sequences from macro-haplogroups L, 271 from M and 637 from N for the further QC analysis.
Other published mtDNA sequences
We compared the ratio of non-synonymous to synonymous substitutions of 3,852 mtDNA sequences in macro-haplogroup L, 6,202 in M and 2,662 in N (nonR) from this study to 1,125 published global human mtDNA sequences (445 mtDNA sequences in macro-haplogroup L, 239 in M and 199 in N (nonR))[9], across the entire mtDNA phylogenetic tree. For the 17,790 European haplogroup N(R) sequences we also compared the frequency of 59 mtDNA variants to 9,935 population controls from the Wellcome Trust Case Control Consortium[8].
Determining the disease caused mutations
We determined which variants were likely to be pathogenic. We listed the variants which were present in 30,506 mtDNA sequences and also proposed pathogenic mtDNA variants on the ClinVar database[11]. We did not include data where two or more nucleotide variations and Indels were listed (S4 Table). We then reviewed published and on-line evidence of pathogenicity for each one of the 90 variants using the following criteria: (1) Reported more than once with mtDNA disease and/or (2) Documented heteroplasmy, with evidence of segregation with the phenotype at the clinical or biochemical level.
Pathogenicity measure
The MutPred analysis score[26] was used for the pathogenicity of an amino acid variation for the 13 proteins encoded by the mtDNA. Pathogenicity scores were calculated for all of the 24,206 possible amino acid variations defined by a single point mutation away from the reference sequence (S7 Table). The list of all possible amino acid variations from the reference sequence (rCRS)[25] was defined by using the mtDNA-GenesSyn software[27]. The pathogenicity scores of variants in tRNA genes were retrieved from the literature[20, 21].
The MutPred score is determined by a set of features reflecting protein structure and its dynamics, the presence of functional residues, biases of amino acid sequence, and evolutionary conservation at the substitution site and in its neighborhood. The software was trained as a random forest classification model to discriminate between disease-associated amino acid substitutions from the Human Gene Mutation Database and putatively neutral polymorphisms from Swiss-Prot, and is thus not directly dependent on allele frequencies in the human population.
Mutational signature
Mutational spectra were derived directly from the both rCRS [25] and RSRS mtDNA[14] reference sequences and alternative alleles at each variant site. The resulting spectra are composed of the relative frequencies of the six distinguishable point mutations (C:G>T:A, T:A>C:G, C:G>A:T, C:G>G:C, T:A>A:T and T:A>G:T). Each signature was displayed using a 96 substitution classification defined by the substitution class and the sequence context immediately 3’ and 5’ to the mutated base[12].
Statistical analysis
The p-values for all comparisons of mean values were calculated by using two-sample t tests or Wilcoxon Rank test as appropriate. Variant counts or fractions were performed using Fisher’s exact test. Pearson’s correlation coefficient (R2) and the significance were calculated using the correlation test. All statistical analyses were performed using R (v3.3) (https://www.r-project.org).
Data availability
The mtDNA sequences that support the findings of this study are available in Genbank: https://www.ncbi.nlm.nih.gov/genbank/. Accession numbers are supplied in S1 Table. No other data is generated specifically in this study.
Supporting Information
Zdroje
1. Stewart JB, Chinnery PF. The dynamics of mitochondrial DNA heteroplasmy: implications for human health and disease. Nat Rev Genet. 2015;16(9):530–42. doi: 10.1038/nrg3966 26281784.
2. DiMauro S, Schon EA, Carelli V, Hirano M. The clinical maze of mitochondrial neurology. Nat Rev Neurol. 2013;9(8):429–44. doi: 10.1038/nrneurol.2013.126 23835535; PubMed Central PMCID: PMCPMC3959773.
3. Brown MD, Torroni A, Reckord CL, Wallace DC. Phylogenetic analysis of Leber's hereditary optic neuropathy mitochondrial DNA's indicates multiple independent occurrences of the common mutations. Hum Mutat. 1995;6(4):311–25. doi: 10.1002/humu.1380060405 8680405.
4. Hudson G, Carelli V, Spruijt L, Gerards M, Mowbray C, Achilli A, et al. Clinical expression of Leber hereditary optic neuropathy is affected by the mitochondrial DNA-haplogroup background. Am J Hum Genet. 2007;81(2):228–33. doi: 10.1086/519394 17668373; PubMed Central PMCID: PMCPMC1950812.
5. Torroni A, Campos Y, Rengo C, Sellitto D, Achilli A, Magri C, et al. Mitochondrial DNA haplogroups do not play a role in the variable phenotypic presentation of the A3243G mutation. Am J Hum Genet. 2003;72(4):1005–12. doi: 10.1086/373936 12612863; PubMed Central PMCID: PMCPMC1180329.
6. van Oven M, Kayser M. Updated comprehensive phylogenetic tree of global human mitochondrial DNA variation. Hum Mutat. 2009;30(2):E386–94. doi: 10.1002/humu.20921 18853457.
7. Weissensteiner H, Pacher D, Kloss-Brandstatter A, Forer L, Specht G, Bandelt HJ, et al. HaploGrep 2: mitochondrial haplogroup classification in the era of high-throughput sequencing. Nucleic Acids Res. 2016;44(W1):W58–63. doi: 10.1093/nar/gkw233 27084951; PubMed Central PMCID: PMCPMC4987869.
8. Hudson G, Panoutsopoulou K, Wilson I, Southam L, Rayner NW, Arden N, et al. No evidence of an association between mitochondrial DNA variants and osteoarthritis in 7393 cases and 5122 controls. Ann Rheum Dis. 2013;72(1):136–9. doi: 10.1136/annrheumdis-2012-201932 22984172; PubMed Central PMCID: PMCPMC3551219.
9. Ruiz-Pesini E, Mishmar D, Brandon M, Procaccio V, Wallace DC. Effects of purifying and adaptive selection on regional variation in human mtDNA. Science. 2004;303(5655):223–6. doi: 10.1126/science.1088434 14716012.
10. Elliott HR, Samuels DC, Eden JA, Relton CL, Chinnery PF. Pathogenic mitochondrial DNA mutations are common in the general population. Am J Hum Genet. 2008;83(2):254–60. doi: 10.1016/j.ajhg.2008.07.004 18674747; PubMed Central PMCID: PMCPMC2495064.
11. Landrum MJ, Lee JM, Benson M, Brown G, Chao C, Chitipiralla S, et al. ClinVar: public archive of interpretations of clinically relevant variants. Nucleic Acids Res. 2016;44(D1):D862–8. doi: 10.1093/nar/gkv1222 26582918; PubMed Central PMCID: PMCPMC4702865.
12. Alexandrov LB, Nik-Zainal S, Wedge DC, Aparicio SA, Behjati S, Biankin AV, et al. Signatures of mutational processes in human cancer. Nature. 2013;500(7463):415–21. doi: 10.1038/nature12477 23945592; PubMed Central PMCID: PMCPMC3776390.
13. Andrews RM, Kubacka I, Chinnery PF, Lightowlers RN, Turnbull DM, Howell N. Reanalysis and revision of the Cambridge reference sequence for human mitochondrial DNA [letter]. Nat Genet. 1999;23(2):147. doi: 10.1038/13779 10508508
14. Behar DM, van Oven M, Rosset S, Metspalu M, Loogvali EL, Silva NM, et al. A "Copernican" reassessment of the human mitochondrial DNA tree from its root. Am J Hum Genet. 2012;90(4):675–84. doi: 10.1016/j.ajhg.2012.03.002 22482806; PubMed Central PMCID: PMCPMC3322232.
15. Liu B, Du Q, Chen L, Fu G, Li S, Fu L, et al. CpG methylation patterns of human mitochondrial DNA. Scientific reports. 2016;6 : 23421. Epub 2016/03/22. doi: 10.1038/srep23421 26996456; PubMed Central PMCID: PMCPMC4800444.
16. Tang WW, Dietmann S, Irie N, Leitch HG, Floros VI, Bradshaw CR, et al. A Unique Gene Regulatory Network Resets the Human Germline Epigenome for Development. Cell. 2015;161(6):1453–67. doi: 10.1016/j.cell.2015.04.053 26046444; PubMed Central PMCID: PMCPMC4459712.
17. Ren L, Zhang C, Tao L, Hao J, Tan K, Miao K, et al. High-resolution profiles of gene expression and DNA methylation highlight mitochondrial modifications during early embryonic development. J Reprod Dev. 2017;63(3):247–61. Epub 2017/04/04. doi: 10.1262/jrd.2016-168 28367907; PubMed Central PMCID: PMCPMC5481627.
18. Forster P, Harding R, Torroni A, Bandelt HJ. Origin and evolution of Native American mtDNA variation: a reappraisal. Am J Hum Genet. 1996;59(4):935–45. 8808611; PubMed Central PMCID: PMCPMC1914796.
19. Cox MP. Accuracy of molecular dating with the rho statistic: deviations from coalescent expectations under a range of demographic models. 2008. Hum Biol. 2009;81(5–6):911–33. Epub 2010/05/28. doi: 10.3378/027.081.0631 20504206.
20. McFarland R, Elson JL, Taylor RW, Howell N, Turnbull DM. Assigning pathogenicity to mitochondrial tRNA mutations: when "definitely maybe" is not good enough. Trends Genet. 2004;20(12):591–6. doi: 10.1016/j.tig.2004.09.014 15522452.
21. Rubino F, Piredda R, Calabrese FM, Simone D, Lang M, Calabrese C, et al. HmtDB, a genomic resource for mitochondrion-based human variability studies. Nucleic Acids Res. 2012;40(Database issue):D1150–9. doi: 10.1093/nar/gkr1086 22139932; PubMed Central PMCID: PMCPMC3245114.
22. Stewart JB, Freyer C, Elson JL, Wredenberg A, Cansu Z, Trifunovic A, et al. Strong purifying selection in transmission of mammalian mitochondrial DNA. PLoS Biol. 2008;6(1):e10. doi: 10.1371/journal.pbio.0060010 18232733; PubMed Central PMCID: PMCPMC2214808.
23. Howell N, Elson JL, Howell C, Turnbull DM. Relative rates of evolution in the coding and control regions of African mtDNAs. Mol Biol Evol. 2007;24(10):2213–21. Epub 2007/07/24. doi: 10.1093/molbev/msm147 17642471.
24. Posth C, Renaud G, Mittnik A, Drucker DG, Rougier H, Cupillard C, et al. Pleistocene Mitochondrial Genomes Suggest a Single Major Dispersal of Non-Africans and a Late Glacial Population Turnover in Europe. Curr Biol. 2016;26(6):827–33. Epub 2016/02/09. doi: 10.1016/j.cub.2016.01.037 26853362.
25. Andrews RM, Kubacka I, Chinnery PF, Lightowlers RN, Turnbull DM, Howell N. Reanalysis and revision of the Cambridge reference sequence for human mitochondrial DNA. Nat Genet. 1999;23(2):147. doi: 10.1038/13779 10508508.
26. Li B, Krishnan VG, Mort ME, Xin F, Kamati KK, Cooper DN, et al. Automated inference of molecular mechanisms of disease from amino acid substitutions. Bioinformatics. 2009;25(21):2744–50. doi: 10.1093/bioinformatics/btp528 19734154; PubMed Central PMCID: PMCPMC3140805.
27. Pereira L, Freitas F, Fernandes V, Pereira JB, Costa MD, Costa S, et al. The diversity present in 5140 human mitochondrial genomes. Am J Hum Genet. 2009;84(5):628–40. doi: 10.1016/j.ajhg.2009.04.013 19426953; PubMed Central PMCID: PMCPMC2681004.
Štítky
Genetika Reprodukční medicína
Článek vyšel v časopisePLOS Genetics
Nejčtenější tento týden
2017 Číslo 12- Akutní intermitentní porfyrie
- Farmakogenetické testování pomáhá předcházet nežádoucím efektům léčiv
- Růst a vývoj dětí narozených pomocí IVF
- Pilotní studie: stres a úzkost v průběhu IVF cyklu
- Vliv melatoninu a cirkadiálního rytmu na ženskou reprodukci
Nejčtenější v tomto čísle- Deep Reads: How I learnt to love population genetics
- Background sequence characteristics influence the occurrence and severity of disease-causing mtDNA mutations
Kurzy
Zvyšte si kvalifikaci online z pohodlí domova
Autoři: prof. MUDr. Vladimír Palička, CSc., Dr.h.c., doc. MUDr. Václav Vyskočil, Ph.D., MUDr. Petr Kasalický, CSc., MUDr. Jan Rosa, Ing. Pavel Havlík, Ing. Jan Adam, Hana Hejnová, DiS., Jana Křenková
Autoři: MUDr. Irena Krčmová, CSc.
Autoři: MDDr. Eleonóra Ivančová, PhD., MHA
Autoři: prof. MUDr. Eva Kubala Havrdová, DrSc.
Všechny kurzyPřihlášení#ADS_BOTTOM_SCRIPTS#Zapomenuté hesloZadejte e-mailovou adresu, se kterou jste vytvářel(a) účet, budou Vám na ni zaslány informace k nastavení nového hesla.
- Vzdělávání


