-
Medical journals
- Career
Mid ‑ diastolic flow and mid ‑ diastolic mitral annular motion – relation to pulmonary capillary wedge pressure in dilated cardiomyopathy patients
Authors: MUDr. Helena Podroužková 1,2; Prof. MUDr. Jaroslav Meluzín, CSc.; Fesc 1,2; prof. MUDr. Lenka Špinarová, Ph.D.; Fesc 1,2; MUDr. Petr Hude, Ph.D. 1,2; MUDr. Jan Krejčí, Ph.D. 1,2
Authors‘ workplace: Department of Cardiovascular Diseases St. Anne‘s Hospital, ICRC, Brno, Czech Republic 1; Department of Cardiovascular Diseases Faculty of Medicine, Masaryk University, Brno Czech Republic 2
Published in: Kardiol Rev Int Med 2013, 15(3): 172-176
Category:
Overview
Background:
The mid ‑ diastolic transmitral flow (L wave) and the mid ‑ diastolic mitral annular motion (L’ wave) are associated with increased left ventricle filling pressures in patients with left ventricle hypertrophy and atrial fibrillation. The aim of this study was to assess the significance of L and L’ waves in dilated cardiomyopathy patients and its relation to pulmonary capillary wedge pressure.Methods:
Idiopathic dilated cardiomyopathy patients scheduled for right heart catheterization were enrolled in the study. Echocardiography was performed simultaneously with pulmonary capillary pressure measurement. The L wave was regarded as a flow towards the apex that occurs after the early and before the late transmitral filling waves. Similarly, an L’ wave was considered a negative motion after the early diastolic mitral annular motion and before the late mitral annular motion.Results:
66 dilated cardiomyopathy patients and 14 healthy volunteers were examined. The L wave was present in six (9%) dilated cardiomyopathy patients and was not found in any of the healthy volunteers. Patients with an L wave (n = 5) had significantly higher pulmonary capillary wedge pressures than patients who did not have an L wave (n = 43, p = 0.015) after 18 patients with heart rates above or equal to 80 were excluded. An L’ wave was observed in 17 patients and in six healthy volunteers. There was no significant difference between pulmonary capillary wedge pressure in the group of patients with and without an L’ wave.Conclusion:
In dilated cardiomyopathy patients with lower heart rates, the L wave is associated with elevated LV filling pressures.Keywords:
triphasic mitral flow pattern – tissue Doppler echocardiography – diastolic dysfunctionMeSH: cardiomyopathy – dilated – echocardiography – Doppler – pulsed – mitral valveBackground
In dilated cardiomyopathy patients (DCM), the diastolic function correlates well with symptoms and is a marker of prognosis. The impaired diastolic function in these patients is connected to higher mortality and a higher hospitalisation rate [1].
Mean pulmonary capillary wedge pressure (PCWP) is an invasive parameter reflecting the mean left atrial pressure and thus left ventricle (LV) filling pressure. Elevated LV filling pressure represents the physiologic consequence of diastolic dysfunction.
The diastolic flow across the mitral valve can be divided by its timing into early and late. The early transmitral diastolic flow (E) or, in other words, the rapid left ventricle (LV) filling is attributed to active relaxation of LV, as the LV pressure drops below the left atrial pressure. The late mitral diastolic flow (A) is a result of atrial contraction and accounts for only 15% to 20% of LV filling in healthy subjects. The time period in between these two flows in diastole is called the diastasis and is characterised by no pressure gradient thus no flow through the mitral valve in normal heart and lower heart rates.
However, in a small group of both healthy individuals and patients with heart pathologies, a mid ‑ diastolic transmitral flow (L wave) can be observed. In the literature the mid ‑ diastolic transmitral flow is also referred to as triphasic mitral flow or L wave. A correlate of L wave – a mid ‑ diastolic mitral annular motion is observed in both M ‑ mode echocardiography and Tissue Doppler (L’ wave).
According to previously published studies in LV hypertrophy and atrial fibrillation [2] patients, the presence of L wave [3] and L’ wave [4] is connected to echocardiography parameters of elevated LV filling pressures.
In contrast to LV hypertrophy patients, DCM patients often have additional factors that could influence their diastolic function such as higher LV volumes, mitral regurgitation and contractile asynchrony caused by left bundle branch block.
The aim of this study was to describe the L and L’ waves in DCM patients and to find out whether there is a relationship of L and L’ waves to invasively measured PCWP.
Methods
Seventy idiopathic DCM patients with symptomatic heart failure, referred to our centre for right heart catheterization, were enrol-led in the study. All these patients were assessed as potential candidates for heart transplantation and thus underwent detailed cardiology examination. The examination included electrocardiogram (ECG), physical examination, history, routine blood tests, chest radiograph and transthoracic echocardiography prior to and during the right heart catheterization.
Exclusion criteria were: bad acoustic window, any valvular disease besides secondary mitral regurgitation, heart rhythm other than sinus. Ischemic coronary disease was ruled out by coronary angiography in all included patients.
Enrolled patients underwent simultaneous echocardiography examination and right heart catheterization. Fifteen sex ‑ and age ‑ matched apparently healthy volunteers, who had no risk of cardiovascular disease and who were on no medication, were included in the study to undergo echocardiography examination. The right heart catheterization in the healthy volunteers was not performed, as pulmonary capillary wedge pressure was expected to be normal in this group.
All patients gave their written consent and the study was approved by the local ethical committee and complied with the Helsinki Declaration.
Both the pre‑catheter and catheter echocardiography were performed using VIVID 7(GE, Milwaukee, WI, USA) during shallow respiration.
Pre‑catheter echocardiography
Routine echocardiography, including chamber quantification, was performed according to the guidelines [5]. Transmitral and aortic flows were recorded with pulsed wave Doppler to determine individual phases of the cardiac cycle. A pulsed wave Doppler recording through mitral valve was used to measure the peak early (E) and late (A) diastolic flow velocity and deceleration time (DT) of E.
Mitral regurgitation was quantified by comparing the regurgitant jet area to the size of the left atrium. The regurgitant jet comprising less than 15% of the left atrium area was graded as 1, 15 – 30% as grade 2, 36 – 55% as grade 3 and above 55% as grade 4. Grades 1 and 2 were considered mild mitral regurgitation, grades 3 and 4 were rated as severe. Pulsed wave tissue Doppler of mitral annulus was recorded at septum and lateral, inferior and anterior walls. For tissue Doppler recordings, the preset for TDI on the machine was used with a sample volume of 5.9 mm (including narrow sector width and low gain) to assure optimal image quality and high frame rates. Peak systolic and early and late diastolic mitral annular velocities were measured at septum, lateral, inferior and anterior wall. If an L’ wave was present in more than one corner of the mitral annulus, the average value of all corners that presented an L’ wave was used for analysis. All values were obtained as a mean of three consecutive heart cycles.
Right heart catheterization
A 7F catheter was inserted into the right ventricle through the right jugular vein. The catheter was positioned in the pulmonary artery where the mean pulmonary artery pressure was measured, then was located further to the pulmonary capillary wedge position. Here the balloon was inflated and values of pulmonary capillary wedge pressure and heart rate were obtained using a mechanoelectrical transducer (P23XL, Ohmeda medical devices division, Oxnard, CA USA).
Subsequently the catheter balloon was deflated in the wedge position without changing the catheter location and all the catheter echocardiography loops were recorded within 15 minutes. Afterwards the catheter balloon was inflated again to repeat the PCWP measurement. Cardiac output was measured by the thermodilution method. The PCWP values used for the analysis were obtained as an average of both PCWP values measured before and after echocardiography.
During the examination patients were permanently in a supine position and did not change their position.
Echocardiography during catheterization
Pulsed wave Doppler and pulsed wave Tissue Doppler were recorded during the right heart catheterization as described above. All echocardiography data were analysed offline with the observer blinded to PCWP results.
L wave was considered a clear positive wave after the E wave and before the A wave (fig. 1), found in all three consecutive heart cycles. In order to avoid artifacts in our dataset, we set a cut‑off value of 0.2 m/ s. The waves with lower speeds than the cut‑off value were considered artifacts and were not included in the analysis.
Fig. 1. Mid-diastolic flow pattern in a dilated cardiomyopathy patient. The L wave (labelled with arrows) is the first positive wave following the E wave. 
The L’ wave was regarded as a clear negative wave after the E’ wave and before the A’ wave, (fig. 2) repeating in all three consecutive heart cycles with a cut‑off value for amplitude of the wave set of 0.02 m/ s.
Fig. 2. Mid-diastolic mitral annular motion in a dilated cardiomyopathy patient. The L’ wave (labeled with an arrow) is the first negative wave following the E’ wave. 
Measured values were: time of L wave and L’ wave onset, peak velocity and duration of L and L’ waves. Time intervals were measured in reference to the beginning of the QRS complex on ECG. For further calculations, the time intervals were corrected for heart rate and expressed as a percentage of RR interval.
Statistical analysis
Results are expressed as mean ± standard error of the mean for continuous variables and number (percentage) for categorical variables. Variables did not present normal distribution, therefore non‑parametric tests were used.
For the comparison of two independent continuous variables the Mann‑Whitney U test was used; to compare the differences in categorical variables the χ2 test was applied. When a number smaller than five occurred in a cell of a contingency table, the Yates correction for χ2 test was applied. If zero appeared in a cell of a contingency table, the Fisher exact test was used. Spearman’s correlation coefficient expressed the correlations. The analyses were performed using Statistica, Statsoft Inc.
Results
Out of 70 patients who underwent simultaneous right heart catheterization and echocardiography and out of 15 healthy volunteers, four patients and one volunteer had to be excluded from the analysis because of poor image quality.
Thus a final cohort included 66 patients and 14 healthy volunteers. There was no significant difference in age or sex distribution between the groups (tab. 1).
1. Baseline characteristics of patients and healthy volunteers. Data are presented as mean ± standard error of the mean or number (percentage). 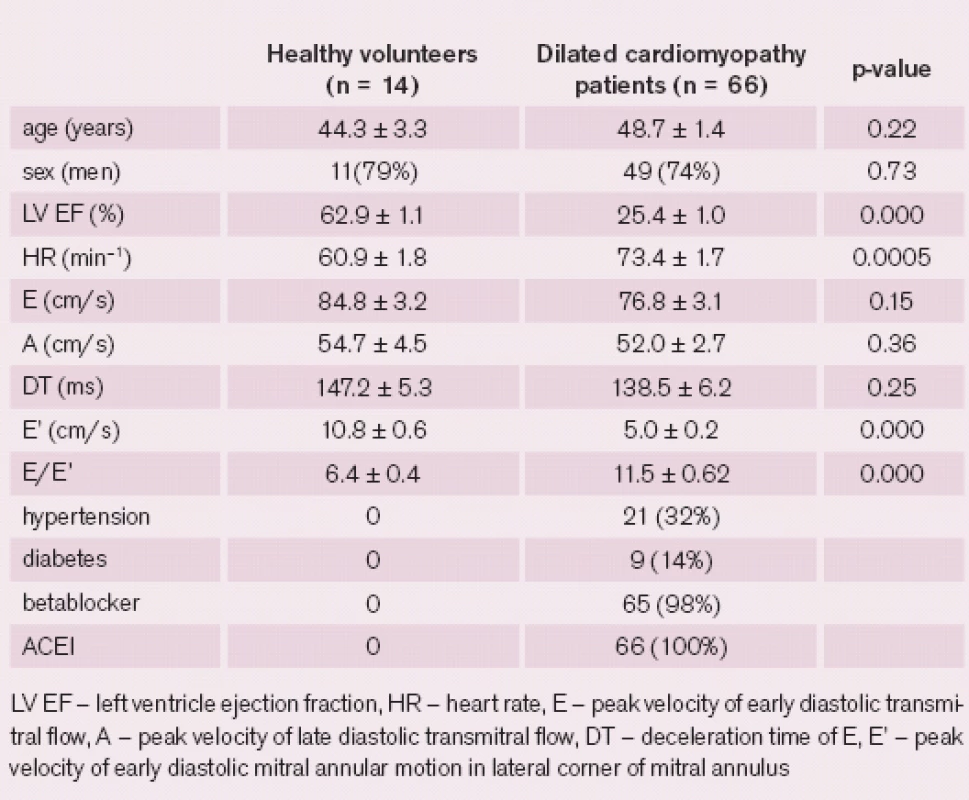
The majority of DCM patients presented with severely impaired LV systolic function as 71% of the patients had LV ejection fraction (LV EF) below 30%. Twenty ‑ six percent of patients had moderately impaired LV EF and only 3% of patients had mildly abnormal LV EF. Half of the patients had either left bundle branch block or left anterior hemiblock on ECG.
A certain degree of mitral regurgitation was present in all patients. To be precise, grade 1 in 30%, grade 2 in 33%, grade 3 in 24%, and grade 4 in 12% of the patients. Baseline characteristics were summarised in tab. 1.
Right heart catheterization
The DCM patients included in the study had a wide range of PCWP, from 4 to 50 mmHg, with the mean value 20.2 ± 1.3 mmHg. Cardiac output, mean pulmonary artery pressure, and mean aortic pressure were 3.9 ± 0.1 L/ min, 29.1 ± 1.7 mmHg, and 88.5 ± 1.5 mmHg, respectively.
Patients with a heart rate higher or equal to 80 were excluded from L and L’ waves analyses. Firstly patients were divided into two groups by a presence or absence of L wave. For the second part of data analysis, patients were divided into two groups by the presence of L’ wave.
L wave analysis
The L wave was observed in six (9%) of DCM patients and was not present in any of the healthy volunteers. After excluding 18 patients with higher heart rates, there was a significantly increased PCWP in a group of patients with L wave present (n = 5) comparing with a group where L wave was not observed (n = 43, p = 0.015), yet there was a very small number of patients in the L wave group. For a detailed comparison of the two groups, see tab. 2.
2. Dilated cardiomyopathy patients with lower heart rates (<80): comparison between groups with mid-diastolic flow present (L+) and absent (L–). Data are presented as mean ± standard error of the mean or number (percentage). 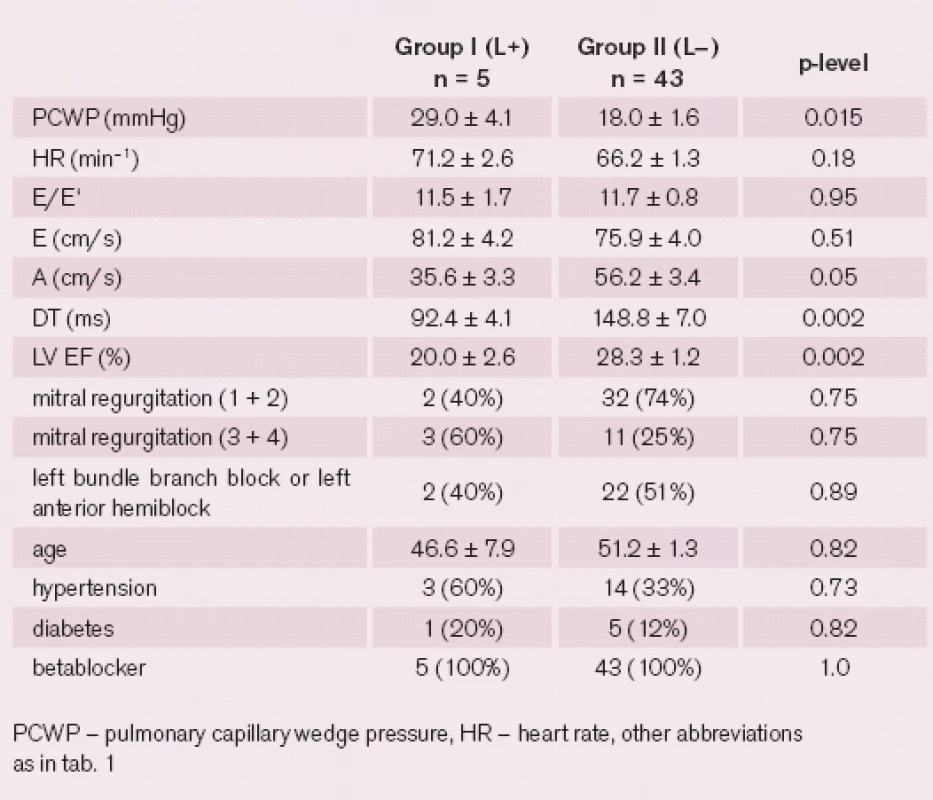
No significant correlations were found between the PCWP and L wave characteristics such as amplitude, duration or time of onset, even when the time intervals were corrected for the heart rate.
L’ wave analysis
The L’ wave was present in 26% of DCM patients and 43% of the healthy volunteers. There were no significant differences between the groups of patients with and without L’ wave. For a detailed comparison between the groups, see tab. 3. In four (6%) patients the L and L’ waves were found simultaneously. For characteristics of L’ wave in healthy volunteers and patients with dilated cardiomyopathy, see tab. 4. Neither amplitude nor time of peak or duration of L’ wave correlated with PCWP. Neither L nor L’ wave was associated with mitral regurgitation or left bundle branch block.
3. Dilated cardiomyopathy patients with heart rates lower than 80 beats per minute (n = 48): comparison between groups with mid-diastolic mitral annular motion present (L‘+) and absent (L‘-). 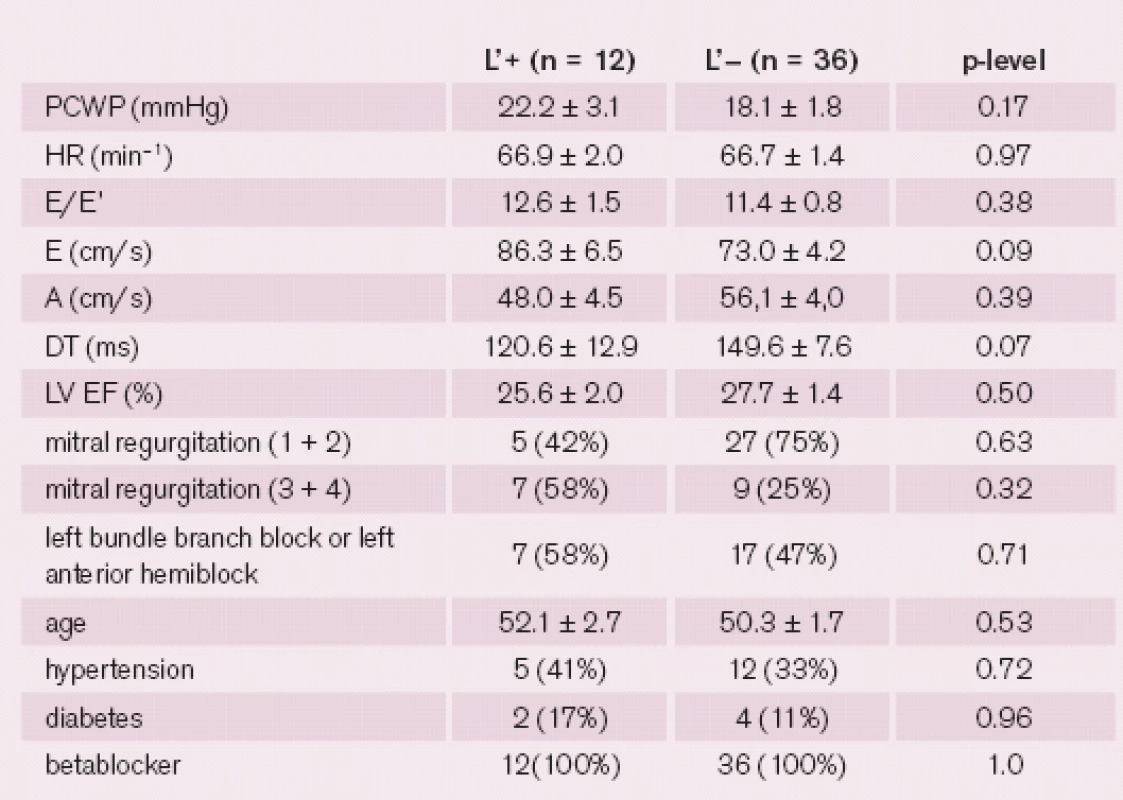
4. Characteristics of mid-diastolic mitral annular motion in healthy volunteers and in DCM patients with all heart rates. Values presented as mean ± standard error of the mean. 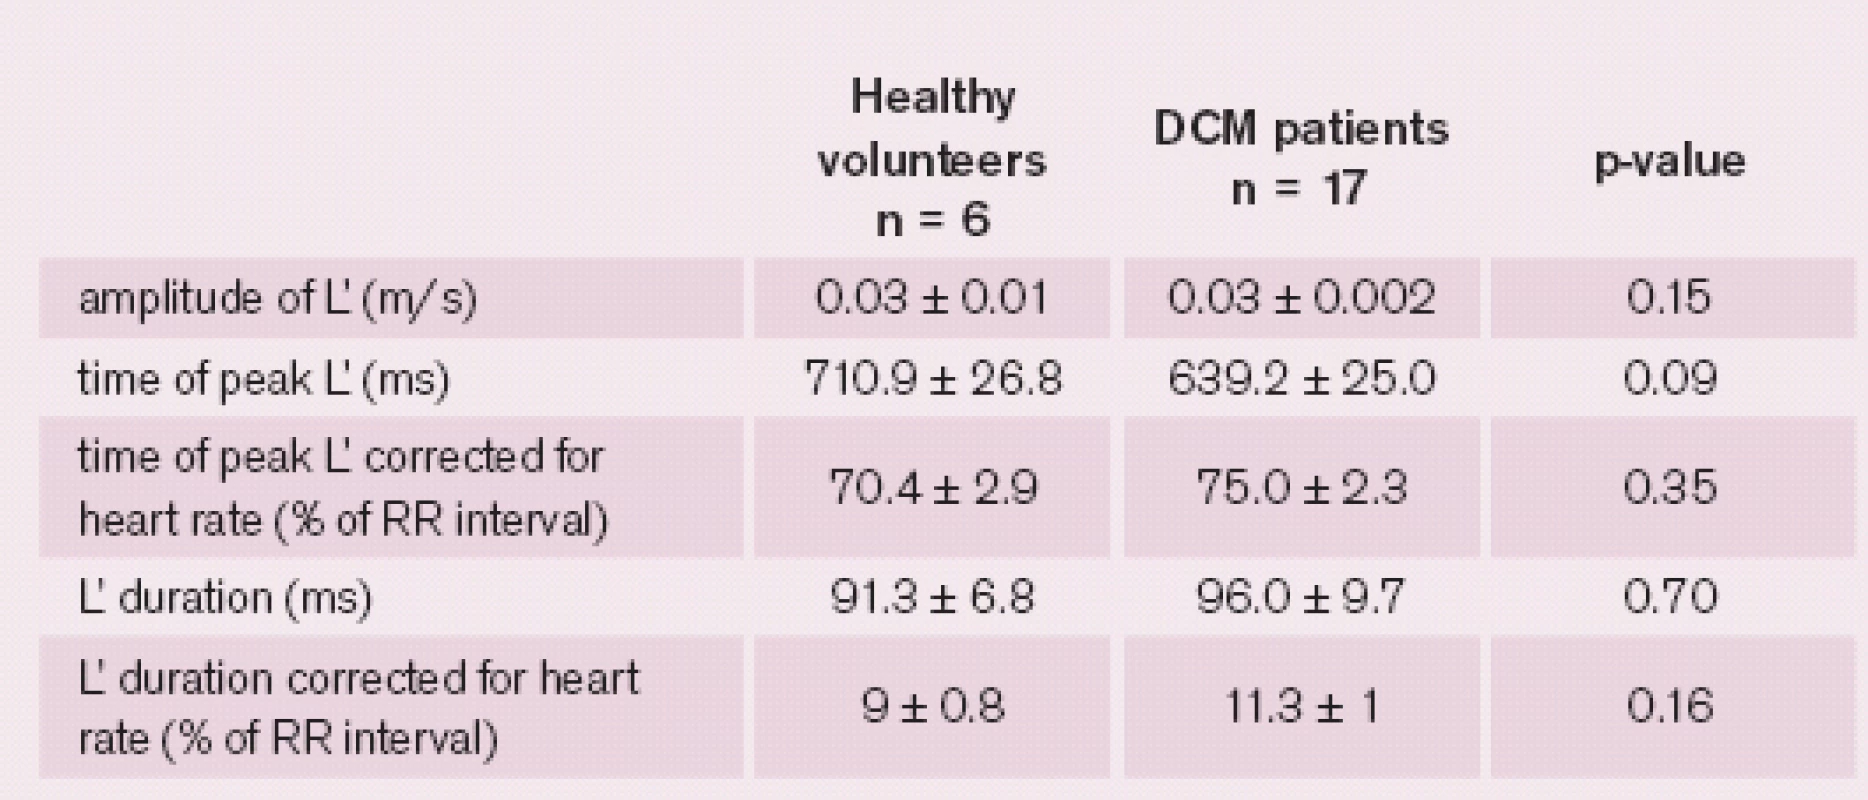
Discussion
To our knowledge, this is the first study to involve DCM patients in the assessment of L and L’ waves. Additionally, this is the first study to compare L and L’ waves to invasively measured LV filling pressures in DCM patients.
The mid ‑ diastolic flow across the mitral valve has first been described in 1986 as an extension of pulmonary vein flow through the left atrium to the left ventricle after early filling [6]. At present a pulmonary venous flow together with prolonged relaxation have been proposed as possible mechanisms of L wave [3]. The markedly prolonged LV relaxation continuing into mid ‑ diastole creates a pressure gradient, resulting in an additional ventricular filling during the mid ‑ diastole. The elevated LA pressure can persist during mid ‑ diastole due to pulmonary vein inflow into a non‑compliant LA. The L wave is preload dependent as the Valsalva maneuver decreases and leg elevation increases the amplitude of L wave, and the amplitude of L wave correlates with the levels of Brain natriuretic peptide as shown in patients with atrial fibrillation.
The L’ wave in healthy volunteers may be driven by strain energy of myocardial recoil stored from the previous systole [7]. The pathological L’ may rise as the mitral inflow hits the stiff ventricle and bounces back in the setting of delayed and prolonged relaxation.
Dilated cardiomyopathy leads to increased filling pressures and later to dilatation of mitral annulus and functional mitral regurgitation. Severe mitral regurgitation causes left atrium volume overload and leads to further elevation of LV filling pressures.
Asynchronous contraction in patients with left bundle branch block leads to asynchrony in relaxation. This may result in post‑systolic contraction in some segments, while other segments are already relaxed, causing impairment of global LV relaxation and thus contributing to increased LV filling pressures. In our study, however, no relationship of mitral regurgitation or left bundle branch block to presence of L or L’ wave was observed.
In DCM patients the presence of L wave may indicate higher LV filling pressures. But the clinical applicability of L wave is limited to patients with lower heart rates. In higher heart rates, the L can merge with the E or A wave and thus become undetectable. After we excluded the patients with heart rates higher than or equal to 80, we found a significant increase of PCWP in the group of patients with mid ‑ diastolic flow.
The major limitation of our study is the small number of patients with L wave present. An additional limitation is that the Valsalva maneuver was not performed.
Conclusion
The L wave in dilated cardiomyopathy patients is associated with higher PCWP values when comparing with patients without L wave, after excluding patients with higher heart rates. The L’ wave was not a predictor of higher PCWP in our group. The L’ wave was observed in both DCM patients and healthy volunteers and there was no characteristic of the L’ wave, such as the duration, amplitude or timing, which would distinguish the two.
Supported by the European Regional Development Fund – Project FNUSA ‑ ICRC (No. CZ.1.05/ / 1.1.00/ 02.0123).
Delivered to the editor: 6. 7. 2013
Accepted after review: 29. 7. 2013
MUDr. Helena Podroužková1,2
prof. MUDr. Jaroslav Meluzín, CSc., FESC1,2
prof. MUDr. Lenka Špinarová, Ph.D., FESC1,2
MUDr. Petr Hude, Ph.D.1,2
MUDr. Jan Krejčí, Ph.D.1,2
1Department of Cardiovascular Diseases,
St. Anne‘s Hospital, ICRC, Brno, Czech Republic
2Department of Cardiovascular Diseases,
Faculty of Medicine, Masaryk University, Brno, Czech Republic
podrouzkova@gmail.com
Redakční poznámka: První anglicky psaný článek, srovnávající na základě vlastních výsledků invazivní a neinvazivní zjišťování plnícího tlaku u nemocných s chronickou DKMP, pochází z brněnského ICRC.
Sources
1. Nagueh SF, Appleton CP, Gillebert TC et al. Recommendations for the evaluation of left ventricular diastolic function by echocardiography. J Am Soc of Echocardiogr 2009; 22 : 107 – 33.
2. Nakai H, Takeuchi M, Nishikage T et al. The mitral L wave: a marker of advanced diastolic dysfunction in patients with atrial fibrillation. Circ J 2007; 71 : 1244 – 1249.
3. Lam CS, Han L, Ha JW et al. The mitral L wave: a marker of pseudonormal filling and predictor of heart failure in patients with left ventricular hypertrophy. J Am Soc Echocardiogr 2005; 18 : 336 – 41.
4. Lam CS, Han L, Oh JK et al. The mitral annular middiastolic velocity curve: functional correlates and clinical significance in patients with left ventricular hypertrophy. J Am Soc Echocardiogr 2008; 21 : 165 – 70.
5. Lang RM, Bierig M, Devereux RB et al. Recommendations for chamber quantification: a report from the American Society of Echocardiography’s Guidelines and Standards Committee and the Chamber Quantification Writing Group, developed in conjunction with the European Association of Echocardiography, a branch of the European Society of Cardiology. J Am Soc Echocardiogr 2005; 18 : 1440 – 63.
6. Keren G, Meisner JS, Sherez J et al. Interrelationship of mid ‑ diastolic mitral valve motion, pulmonary venous flow, and transmitral flow. Circulation 1986; 74 : 36 – 44.
7. Su HM, Lin TH, Lee CS et al. Differentiation of left ventricular diastolic function by mid ‑ diastolic mitral annular motion patterns. Ultrasound Med Biol 2008; 34 : 753 – 759.
Labels
Paediatric cardiology Internal medicine Cardiac surgery Cardiology
Article was published inCardiology Review

2013 Issue 3-
All articles in this issue
- Transcatheter aortic valve implantation (TAVI) – current situation and news in 2013
- Pregnancy in patients with valvular prosthesis
- Pregnancy in patients with congenital heart disease
- Premature beats – arrhythmias and treatment options in the context of valvular heart disease
- A few remarks on the history of cardiac surgery
- Levosimendan and renal function
- Selected aspects in the philosophy of cardiac care
- The diagnosis of aortic stenosis
- New trends in aortic valve surgery
- Mid‑ diastolic flow and mid‑ diastolic mitral annular motion – relation to pulmonary capillary wedge pressure in dilated cardiomyopathy patients
- Cardiology Review
- Journal archive
- Current issue
- Online only
- About the journal
Most read in this issue- The diagnosis of aortic stenosis
- Premature beats – arrhythmias and treatment options in the context of valvular heart disease
- Transcatheter aortic valve implantation (TAVI) – current situation and news in 2013
- A few remarks on the history of cardiac surgery
Login#ADS_BOTTOM_SCRIPTS#Forgotten passwordEnter the email address that you registered with. We will send you instructions on how to set a new password.
- Career

