-
Články
- Vzdělávání
- Časopisy
Top články
Nové číslo
- Témata
- Kongresy
- Videa
- Podcasty
Nové podcasty
Reklama- Kariéra
Doporučené pozice
Reklama- Praxe
QUANTIFYING CARDIORESPIRATORY THORAX MOVEMENT WITH MOTION CAPTURE AND DECONVOLUTION
Unobtrusive sensing is a growing aspect in the field of biomedical engineering. While many modalities exist, a large fraction of methods ultimately relies on the analysis of thoracic movement. To quantify cardiorespiratory induced thorax movement with spatial resolution, an approach using high-performance motion capture, electrocardiography and deconvolution is presented. In three healthy adults, motion amplitudes are estimated that correspond to values reported in the literature. Moreover, two-dimensional mappings are created that exhibit physiological meaningful relationships. Finally, the analysis of waveform data obtained via deconvolution shows plausible pulse transit behavior.
Keywords:
Cardiorespiratory movement, motion capture, deconvolution, biosignal processing, unobtrusive sensing
Authors: Christoph Hoog Antink; David Hejj; Bernhard Penzlin; Steffen Leonhardt; Marian Walter
Authors place of work: Philips Chair for Medical Information Technology, RWTH Aachen University, Aachen, Germany
Published in the journal: Lékař a technika - Clinician and Technology No. 4, 2017, 47, 141-145
Category: Původní práce
Summary
Unobtrusive sensing is a growing aspect in the field of biomedical engineering. While many modalities exist, a large fraction of methods ultimately relies on the analysis of thoracic movement. To quantify cardiorespiratory induced thorax movement with spatial resolution, an approach using high-performance motion capture, electrocardiography and deconvolution is presented. In three healthy adults, motion amplitudes are estimated that correspond to values reported in the literature. Moreover, two-dimensional mappings are created that exhibit physiological meaningful relationships. Finally, the analysis of waveform data obtained via deconvolution shows plausible pulse transit behavior.
Keywords:
Cardiorespiratory movement, motion capture, deconvolution, biosignal processing, unobtrusive sensingIntroduction
Ambient and unobtrusive cardiorespiratory sensing techniques form an increasing subfield within biomedical engineering [1]. Sensor principles range from camera-based methods [2] over ultrasound [3], radar [4] and laser [5] to force sensors [2] and high-frequency oscillator circuits [6]. For a comprehensive overview, the interested reader is referred to [1]. While the sensors span a wide range of devices and physical principles, many methods that allow unobtrusive monitoring of heart and lung are ultimately based on the analysis of thoracic movement.
Most of the time, unobtrusive sensing modalities are evaluated in terms of their ability to detect respiratory rate, respiratory patterns, heart rate or beat-to-beat intervals. Thus, they are commonly compared to a medical gold standard, such as the electrocardiogram (ECG) or an air flow sensor. However, spatially resolved quantification of the actual thoracic motion is seldom performed. For this, specialized measurement equipment is necessary. Moreover, if cardiac induced motion is to be quantified, submillimeter accuracy is required. At the same time, spatially resolved information could help to optimize regions of interest for existing and future sensing modalities. Thus, the aim of this paper is to develop a method for the spatially resolved analysis and mapping of cardiorespiratory induced thorax movement. For this, volunteers sitting in an armchair are monitored with a high-performance motion capture (MoCap) system and an ECG. To extract and quantify the spatial impulse responses of cardiac and respiratory activity, deconvolution [7] is used. This paper is a reprint of the work presented at the conference POSTER 2017.
Materials and Methods
The overall setup of the system is demonstrated in Fig. 1. Only three of the seven cameras used for MoCap are visualized, which are placed around the subject in a semicircle.
Fig. 1. Schematic overview of the system setup. 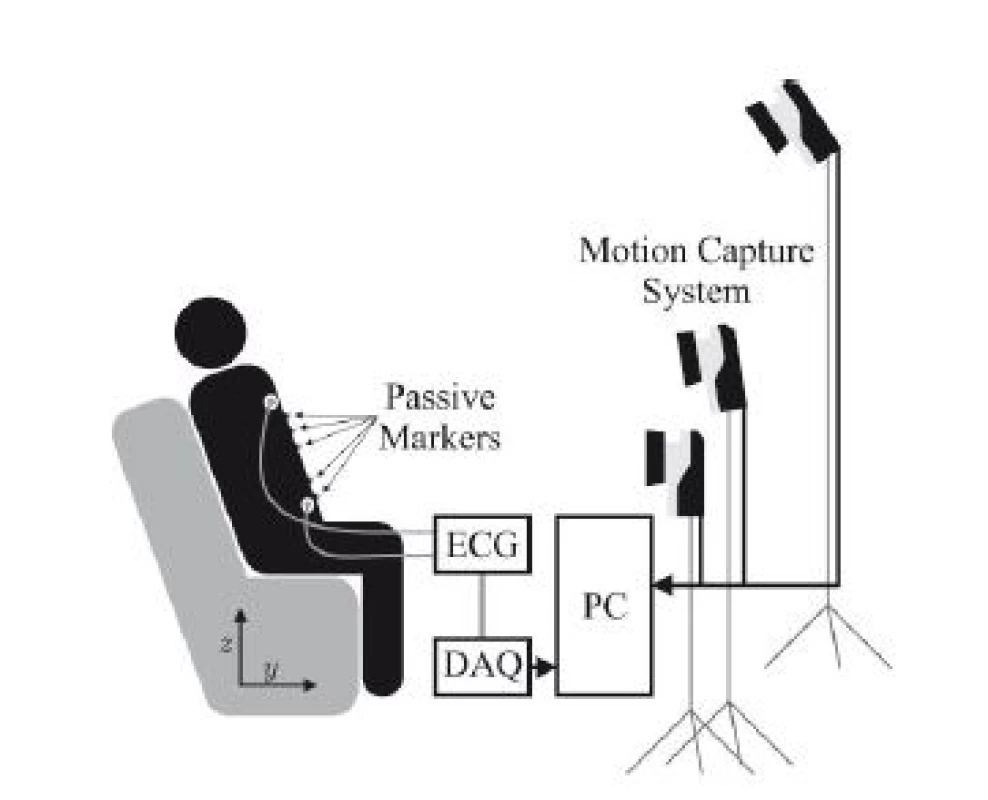
Hardware
For motion capture, the “Oqus” system from Qualisys AB, Göteborg, Sweden configured with seven “Opus 500+” infrared (IR) tracking cameras and ten passive reflective markers was used. Each camera has a resolution of 4 megapixels at fs,max = 180 Hz and is equipped with a C-mount lens with a focal length of 13 mm. The aperture was set to f/4.0 and manual focusing was performed. Illumination was provided by rings of IR LEDs integrated into each camera unit. Marker positions were tracked at fs,M = 100 Hz. For ECG acquisition, the “MP30” patient monitor, manufactured by Philips, Amsterdam, The Netherlands was used as analog front end. Digitalization was performed at fs,A = 800 Hz with a DAQ system which was synchronized with the cameras.
Three healthy volunteers participated in the trial which was conducted as self-experimentation. A schematic of the marker positions is given in Fig. 2, which are further described in Table 1. Fig. 2 B) shows a photograph of the marker positions for one participant and in Fig. 2 C), the coordinate system is given, x being the right/left axis. Since the subjects are sitting in a chair with approximately 20° recline, y and z only approximate the dorsoventral and the craniocaudal axis respectively.
Tab. 1. Position of reflective markers for motion capture 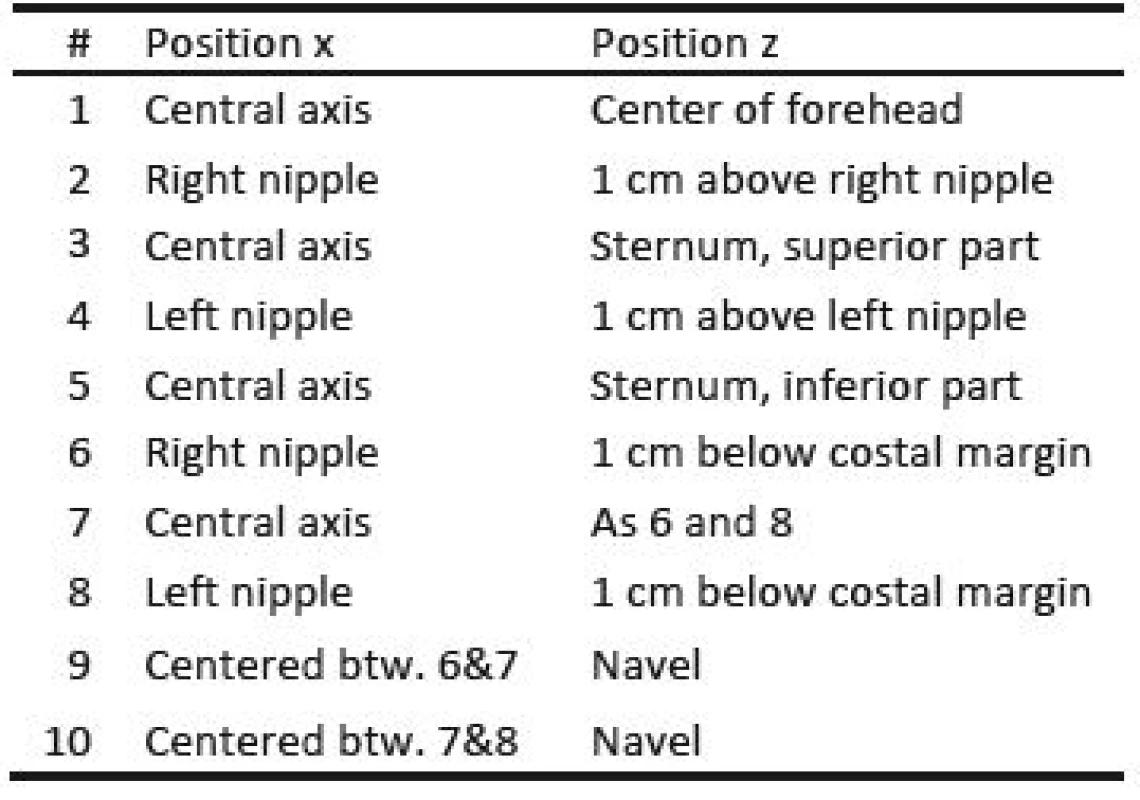
Fig. 2. A) Schematic of marker positions, B) Photography of actual marker positions, C) Coordinate system. 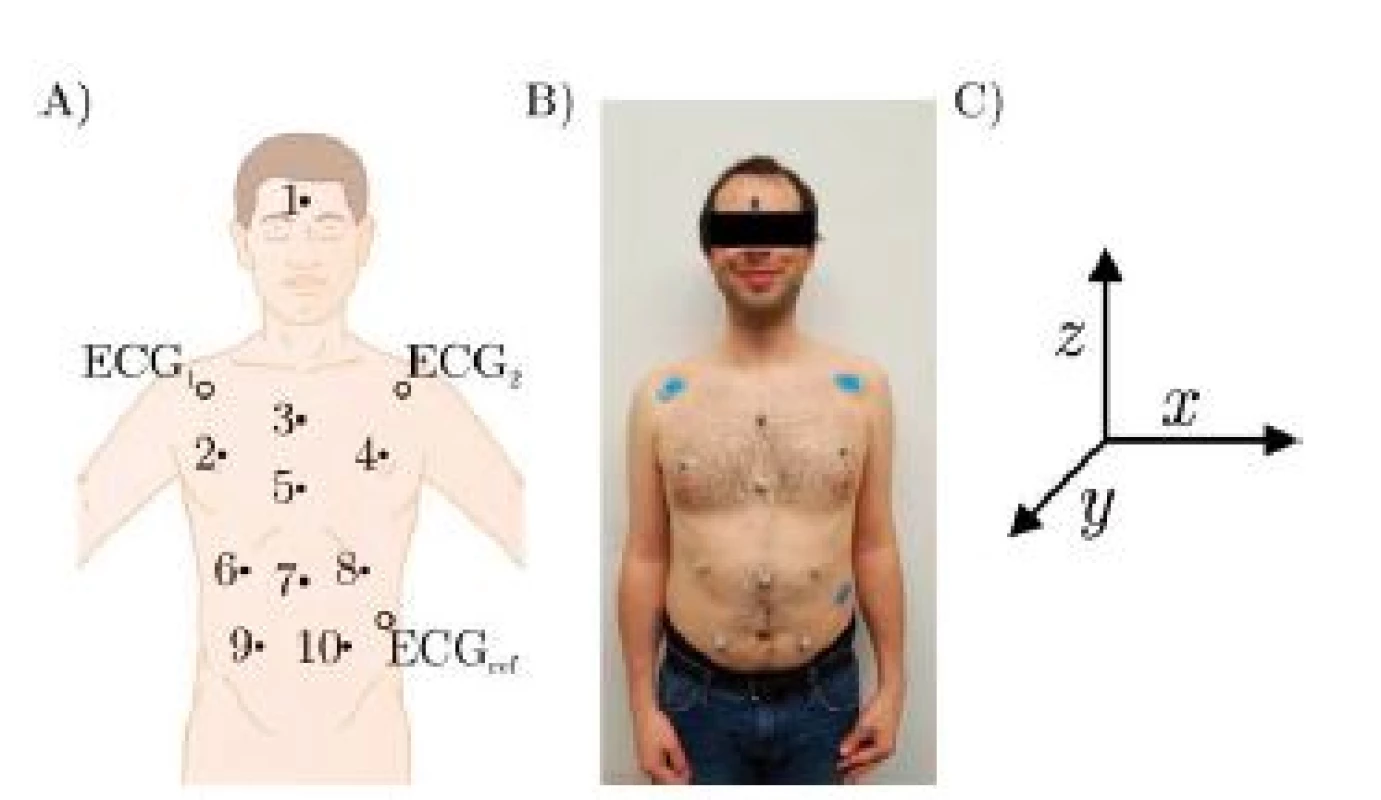
Data Analysis
The proposed model is shown in Fig. 3. The motion of each marker i is described as yi and is influenced by a cardiac and a respiratory component. For each marker, these components are generated by filtering a virtual train of impulses originating from the heart and the lung with marker-specific transfer functions acard,i and aresp,i, respectively. If yi, scard and sresp are known, the filter coefficients acard,i and aresp,i can be estimated via deconvolution [7].
Fig. 3. Proposed source-filter structure of thoracic movement influenced by a superposition of cardiac and respiratory component. For each marker i and axis x, y, z, individual filters a exist. 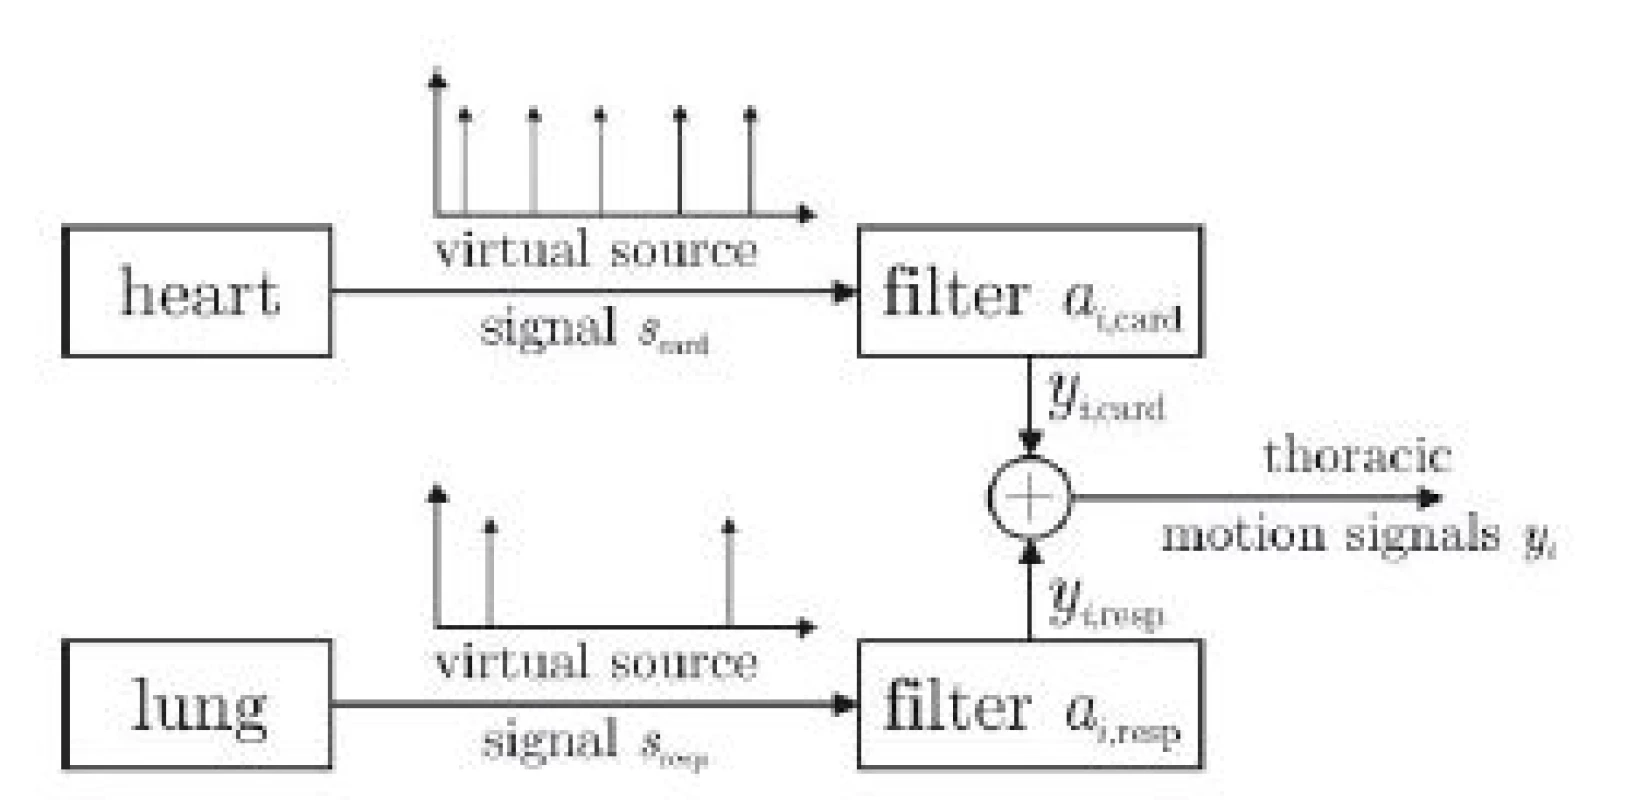
In the proposed approach deconvolution is performed separately for the cardiac and the respiratory component. For either component, the convolution is described by
where n is the discrete time, Q the filter order and z is additive noised. The subscripts ‘card’ and ‘resp’ are omitted for reasons of brevity. In the Fourier domain, this can be expressed via
Here xi[k], si[k], and zi[k] are the Fourier transforms of their time-domain equivalents. The discrete frequency is marked by k and N is the number of samples. The filter coefficients are not transformed but the delay is expressed explicitly by the term e-j2πkτ/N .This can be expressed in matrix notation as
with the Fourier-domain delay-vector
and the vector of filter coefficients
Let [∙]T be the transpose, [∙]H the Hermitian transpose and [∙]* the conjugation operator. If the source signal is known, the optimal filter coefficients in terms of a minimal quadratic error can be determined with
with the matrix
and the vector
For a more detailed derivation and an applications to blind deconvolution, the interested reader is referred to [8].
Note that the calculations are carried out separately for all i markers, for the respiratory component and for the cardiac component. Moreover, a separate filter is estimated for the each dimension x, y, and z. To obtain the cardiac related motion yi,card, the marker position is filtered with a secondorder Butterworth bandpass with 0.8 to 30 Hz passband. The respiratory component yi,resp is obtained via filtering with a passband of 0.01 to 0.3 Hz. The cardiac impulse signal scard is obtained from R-peaks of the ECG, while sresp is obtained via peak-detection on the geometric mean of y and z component of the central marker #5. To quantify the cardiac and respiratory induced motion, the range of ai,est, i.e. the maximum minus the minimum of the respective impulse response, is calculated. For visualization, the range is colorcoded and interpolated, the mapping is shown in Fig. 4.
Fig. 4. Mapping of the color-coded ranges, see also Fig. 6. Note that the mapping is slightly distorted as the subjects were monitored in a sitting position with a recline of approximately 20°. 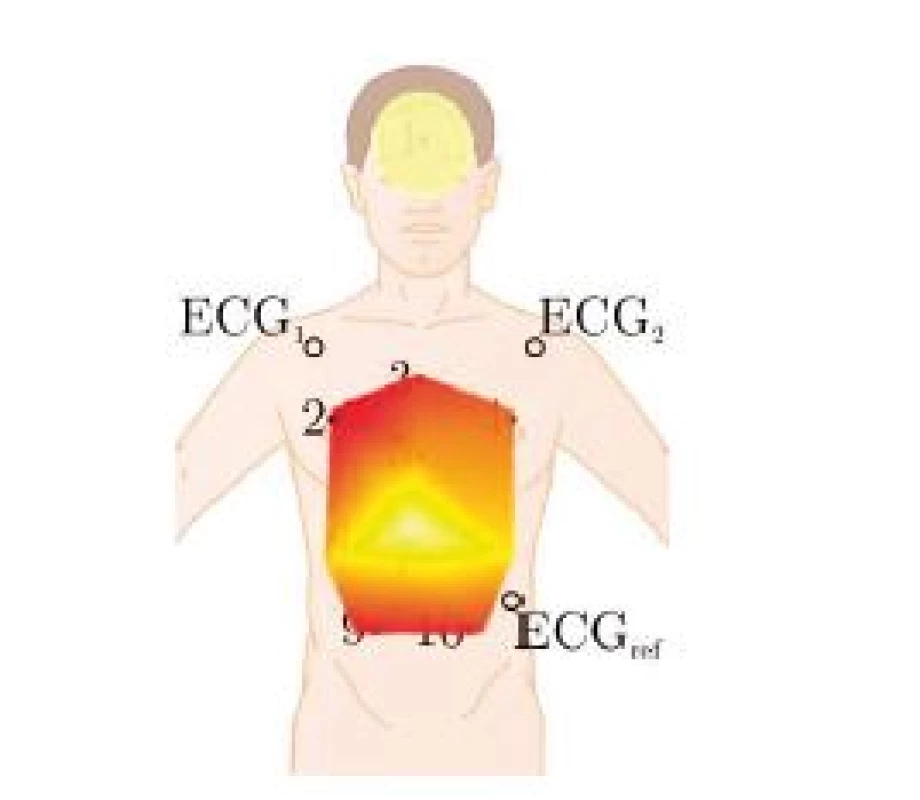
Results and Discussion
In Fig. 6, the colorcoded ranges are visualized. Several observations can be made. First, neither cardiac nor respiratory activity create a significant x (i.e. left-right) motion in any subject, which is to be expected. Next, the strongest respiratory motion in the y (dorsoventral) direction occurs in the belly area, whereas the strongest z (craniocaudal) component is measured in the upper part of the thorax. This is consistent with normal physiological breathing, where the ribcage is lifted and the downward motion of the diaphragm displaces organs which extend the belly. In terms of amplitude, the maximum respiratory induced motion is in the range of 5 to 7 mm, while the maximum cardiac induced motion ranges from 0.25 to 0.3 mm, which is consistent with values reported in the literature [9, 10]. In conclusion, more than an order of magnitude lies between the cardiac and the respiratory effect. Similar to the observations made with respect to respiration, the strongest z component can be measured in the upper part of the thorax close to the heart, whereas the strongest y movement of the thorax due to cardiac activity occurs in the belly region. At the same time, a relatively strong y-motion of approximately 0.25 mm can be observed on the foreheads of all subjects. Compared to the thoracic region, the influence of respiratory induced motion on the forehead is relatively low. In Fig. 5, the impulse response of the z-component of markers 4 and 9 are shown for subject 1.
Fig. 5. Impulse response of the z-component of cardiac induced thoracic movement for subject 1, markers 4 and 9. The each maximum value is marked with an x. 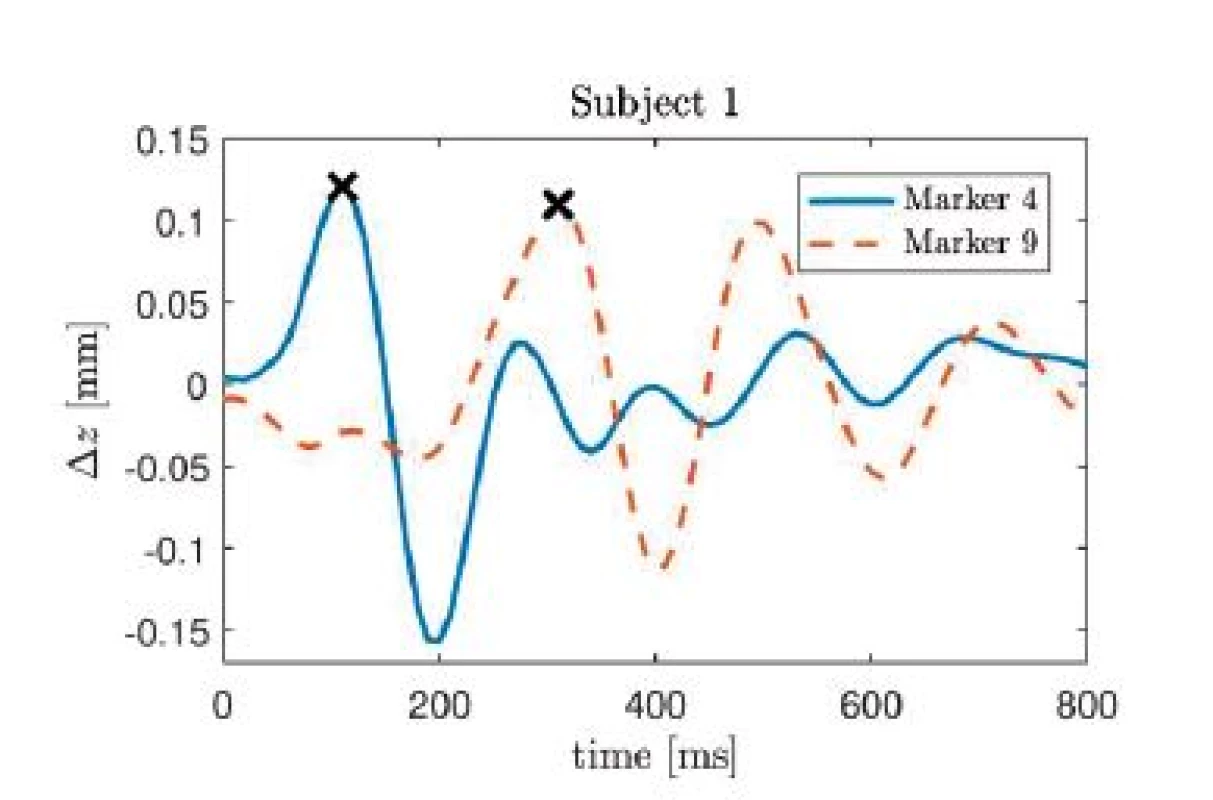
Fig. 6. Mapping of respiratory (left) and cardiac (right) induced movement, see also Fig. 5. For each subject, an individual color code was used for respiratory and cardiac movement, which was constant for x, y, and z component. Values are given in mm. 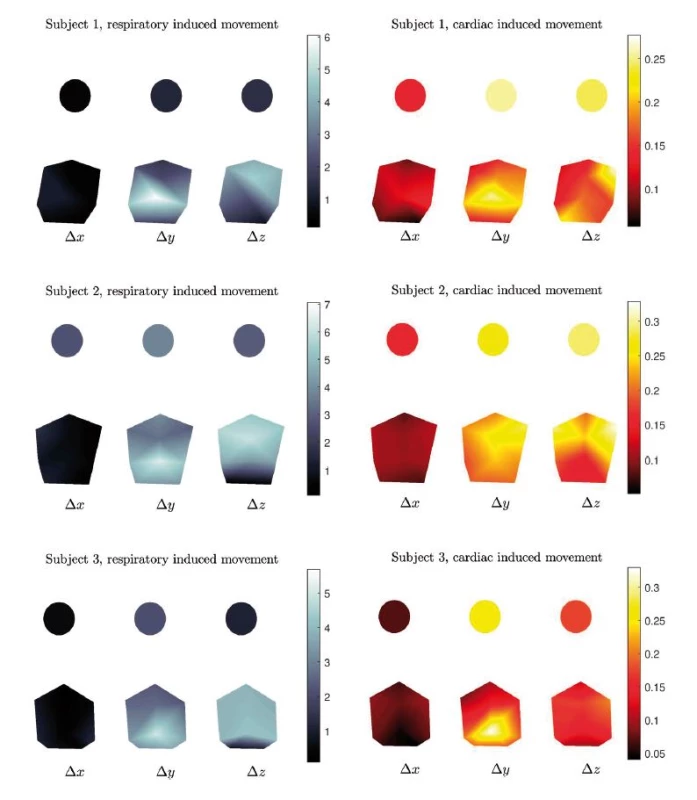
On can see that the largest peak occurs at 110 ms in the time course of marker 4, whereas for marker 9, the largest peak is found at 310 ms. Thus, the marker closest to the heart exhibits a delay of 110 ms with respect to the R-peak, i.e. the electrical activity, whereas the pulse transit time between both markers is 200 ms.
Conclusions and Outlook
In this paper, the use of motion capture and deconvolution to quantify cardiorespiratory thorax movement was demonstrated. Using a high-performance MoCap system and an ECG, movement amplitudes from three healthy subjects were obtained that are consistent with values reported in the literature. From these values, spatially resolved maps were created that exhibit physiological plausible distributions. Moreover, the phenomenon of pulse transit could be observed and quantified. In the future, a larger study with a statistical analysis needs to be performed. It is hoped that our findings can be used in the future for the optimization of regions of interest for unobtrusive sensing, for example by focusing on the head or belly region.
Acknowledgement
The authors gratefully acknowledge financial support provided by the German Research Foundation [Deutsche Forschungsgemeinschaft (DFG), grant no. LE 817/26-1]. The authors would like to thank Jakob Orschulik for participating in the measurements.
Dipl. Ing. Christoph Hoog Antink, M.S.
Philips Chair for Medical Information Technology
Helmholtz-Institute
RWTH Aachen University of Technology
Pauwelsstr. 20, 52074 Aachen
E-mail: hoog.antink@hia.rwth-aachen.de
Phone: +49 241 80 23202
Zdroje
1. Brüser, C., Hoog Antink, C., Wartzek, T., Walter, M., Leonhardt, S.: Ambient and Unobtrusive Cardiorespiratory Monitoring Techniques, IEEE Reviews in Biomedical Engineering, 2015, vol. 8, pp. 30–43.
2. Hoog Antink, C., Gao, H., Brüser, C., Leonhardt, S.: Beat-to-beat heart rate estimation fusing multimodal video and sensor data, Biomedical Optics Express, 2015, vol. 6, no. 8, pp. 2895–2907.
3. Yamana, Y., Tsukamoto, S., Mukai, K., Maki, H., Ogawa, H., Yonezawa, Y.: A sensor for monitoring pulse rate, respiration rhythm, and body movement in bed, 33rd Annual International Conference of the IEEE Engineering in Medicine and Biology Society, 2011 pp. 5323–5326.
4. Massagram, W., Lubecke, V., Host-Madsen, A., Boric-Lubecke, O.: Assessment of Heart Rate Variability and Respiratory Sinus Arrhythmia via Doppler Radar, IEEE Transactions on Microwave Theory and Techniques, 2009, vol. 57, no. 10, pp. 2542–2549.
5. Hong, H., Fox, M.D.: Noninvasive detection of cardiovascular pulsations by optical Doppler techniques, Journal of Bio-medical Optics, 1997, vol. 2, no. 4, pp. 382–390.
6. Oum, J. J., Lee, S. S., Kim, D. W., Hong, S.: Non-contact heartbeat and respiration detector using capacitive sensor with Colpitts oscillator, Electronics Letters, 2008, vol. 44, no. 2, p. 87.
7. He, Z. S., Xie, S. L., Fu, Y. L.: A new blind deconvolution algorithm for SIMO channel based on neural network, 4th International Conference on Machine Learning and Cyber-netics, 2005 pp. 3602–3616.
8. Hoog Antink, C., Brüser, C., Leonhardt, S.: Multimodal Sensor Fusion of Cardiac Signals via Blind Deconvolution: A Source-Filter Approach, Computing in Cardiology, 2014, vol. 41, pp. 805–808.
9. Droitcour, A. D.: Non-contact measurement of heart and respiration rates with single-chip microwave Doppler radar, Diss. Stanford University, 2006.
10. Suzuki, S., Matsui, T., Sugawara, K., Asao, T., Kotani, K.: An Approach to Remote Monitoring of Heart Rate Variability (HRV) Using Microwave Radar during a Calculation Task, Journal of PHYSIOLOGICAL ANTHROPOLOGY, 2011, vol. 30, no. 6, pp. 241–249.
Štítky
Biomedicína
Článek vyšel v časopiseLékař a technika
2017 Číslo 4-
Všechny články tohoto čísla
- ANALYSIS OF ULTRASOUND FIELD PARAMETERS DURING SONICATION EXPERIMENTS IN VITRO - INFLUENCE OF LABORATORY GLASS AND PLASTICS
- SENSITIVITY OF AUDITORY PERCEPTION TO CHANGES IN PHASE SPECTRUM
- CHARACTERIZATION OF THE BIAS BETWEEN OXYGEN SATURATION MEASURED BY PULSE OXIMETRY AND CALCULATED BY AN ARTERIAL BLOOD GAS ANALYZER IN CRITCALLY ILL NEONATES
- PAIN AND STRESS MEASUREMENT DURING GENERAL ANESTHESIA USING THE RESPIRATORY SINUS ARRHYTHMIA
- QUANTIFYING CARDIORESPIRATORY THORAX MOVEMENT WITH MOTION CAPTURE AND DECONVOLUTION
- Lékař a technika
- Archiv čísel
- Aktuální číslo
- Informace o časopisu
Nejčtenější v tomto čísle- ANALYSIS OF ULTRASOUND FIELD PARAMETERS DURING SONICATION EXPERIMENTS IN VITRO - INFLUENCE OF LABORATORY GLASS AND PLASTICS
- CHARACTERIZATION OF THE BIAS BETWEEN OXYGEN SATURATION MEASURED BY PULSE OXIMETRY AND CALCULATED BY AN ARTERIAL BLOOD GAS ANALYZER IN CRITCALLY ILL NEONATES
- SENSITIVITY OF AUDITORY PERCEPTION TO CHANGES IN PHASE SPECTRUM
- QUANTIFYING CARDIORESPIRATORY THORAX MOVEMENT WITH MOTION CAPTURE AND DECONVOLUTION
Kurzy
Zvyšte si kvalifikaci online z pohodlí domova
Autoři: prof. MUDr. Vladimír Palička, CSc., Dr.h.c., doc. MUDr. Václav Vyskočil, Ph.D., MUDr. Petr Kasalický, CSc., MUDr. Jan Rosa, Ing. Pavel Havlík, Ing. Jan Adam, Hana Hejnová, DiS., Jana Křenková
Autoři: MUDr. Irena Krčmová, CSc.
Autoři: MDDr. Eleonóra Ivančová, PhD., MHA
Autoři: prof. MUDr. Eva Kubala Havrdová, DrSc.
Všechny kurzyPřihlášení#ADS_BOTTOM_SCRIPTS#Zapomenuté hesloZadejte e-mailovou adresu, se kterou jste vytvářel(a) účet, budou Vám na ni zaslány informace k nastavení nového hesla.
- Vzdělávání


