-
Medical journals
- Career
PAIN AND STRESS MEASUREMENT DURING GENERAL ANESTHESIA USING THE RESPIRATORY SINUS ARRHYTHMIA
Authors: Janosch Kunczik 1; Marcus Koeny 1; Michael Czaplik 2; Vladimir Blazek 1,3; Steffen Leonhardt 1
Authors‘ workplace: Chair for Medical Information Technology, Helmholtz-Institute for Biomedical Engineering, RWTH Aachen University, Pauwelsstrasse 0, 5 074 Aachen, Germany 1; Department of Anesthesiology, University Hospital RWTH Aachen, Aachen, Germany 2; The Czech Institute of Informatics, Robotics and Cybernetics, CTU Prague, Prague, Czech Republic 3
Published in: Lékař a technika - Clinician and Technology No. 4, 2017, 47, 135-140
Category: Original research
Overview
Measuring intraoperative pain and stress during general anesthesia is still problematic. Instead of having access to meaningful and robust pain measurements, anesthetists must use their experience and intuition to ensure a proper pain therapy. The correct dosage of analgesics is crucial for a stable patient, since underdosing may lead to neurogenic shock. Overdosing can result in critically low blood pressures and heart rates. Several possible approaches towards measuring pain have been proposed in the last years. We briefly summarize them and evaluate their usability in a general anesthesia setting. A promising approach is given by the Analgesia Nociception Index. We developed an advanced algorithm, called the Surgical Analgesia Index, which improves its concept for the use in a fully connected smart operating room. This paper is dedicated to its description, preliminary validation and comparison against the original index.
Keywords:
Pain, Respiratory Sinus Arrhythmia, Heart Rate Variability, Analgesia Nociception Index, Spectral Analgesia IndexIntroduction
Several approaches towards the measurement of pain have been proposed in the past. The span reaches from statistic-, model-, or physiology-based algorithms towards more complex approaches facilitating machine learning.
The Noxious Stimulation Response Index (NRSI) from Luginbuehl et al. [1] uses a pharmacokinetic model to make predictions about the effectside concentration of opioid analgesics and Propofol to estimate the probability of a patient's reaction onto painful stimuli. Implemented in syringe pumps, the NRSI allows the anesthetist to set a target anesthetic depth, instead of volume flows. Since the NRSI doesn’t include any feedback measurements, it is less a pain measuring and more a pain estimating algorithm.
A measurement-based pain index was proposed by Wennervirta et al. [2]. The collected PPG signals from 26 patients during general anesthesia were used for statistical analysis. Increased blood pressure, movement or coughing were interpreted as painrelated responses and treated with opioid analgesics. Through a correlation analysis, the heartbeat interval (HBI) and the amplitude of the pulse wave (PPGA) were identified to be the most pain sensitive characteristics in the PPG signal. The Surgical Stress Index (SSI) uses these two characteristics to provide an automated pain scale, ranging 0 to 100:
It is well known that pain influences a person’s mimic significantly. Advanced image recognition and machine-learning algorithms have been applied by multiple research groups to measure the pain level automatically. For example, Gholami et al. [3] described how relevance vector machine (RVM) learning techniques can be used to compute the similarity of a facial expression to different base emotions. This approach allows to tell how many percent of any base emotion are detectable in the shown mimic. While this approach is trendsetting for pain measurement in awake patients, it can’t be used during general anesthesia.
All so far presented pain indices are limited or non-usable in a general anesthesia setting. The NRSI is a purely predictive model, the SSI depends on relatively unreliable PPG signals and facial recognition doesn’t work with anesthetized patients. A promising approach to fill this gap utilizes the measurement of the heart rate variability (HRV) to estimate the patients pain.
The Analgesia Nociception Index (ANI), proposed by Logier et al. [4], analyzes the modulation of the heart frequency through respiratory activity, the so called Respiratory Sinus Arrhythmia (RSA) [5]. It has been shown that this modulation originates from the parasympathetic activity of the Vegetative Nervous System (isn’t a pain measuring index in the exact case. It rather VNS), which is responsible for relaxation, regeneration and digestion. In contrast to its antagonist, the sympathetic part, which is responsible for activation in stressful events, the parasympathetic neurons conduct signals faster. Therefore, they can modulate the heart frequency within a breath cycle. This modulation appears between 0.15–0.4 Hz, in the range of normal respiratory activity.
As the sympathetic - and parasympathetic part of the VNS work antagonistically, stressful events lead to an increased sympathetic - and decreased parasympathetic tone. This phenomenon allows the indirect observation of the patient’s stress level. Since the patient is hypnotized, no psychological factors influence the activity of the VNS. By implication, this means that only physical pain leads to a lowered parasympathetic and increased sympathetic activity.
To quantify pain in an easily interpretable scale, Logier et al. used a normalized HRV, obtained by division with the signals own 2-norm. To neglect other influences onto the HRV, the signal was bandpass-filtered between 0.15 Hz and 0.5 Hz, so that only RSA-induced HRV remains. Ideally, the remaining signal only consisted of one component, the parasympathetic activity. To recover this amplitude, Logier et al. calculated the upper and lower envelope of the signal and computed the Area Under the Curve (AUC) of the difference-signal in analysis windows of 64-second length. After dividing the window into four subwindows of 16-second length, the minimum area under the curve AUCmin was determined. In a last step this value was used to compute the index through a linear transformation:
The parameters were published as α = 5.1 and β = 1.2. The commercially available Metro-Doloris ANI-monitor, however uses a short initialization phase to compute these parameters individually for each patient. Unfortunately, the initialization algorithm proprietary and therefore can’t be independently assessed.
The working principle of the ANI seems to be the most suitable for the measurement of pain during general anesthesia. However, a few extensions and changes in the original algorithm can yield improvements for its use during general anesthesia:
- The actual respiratory frequency is not considered, although it is set to a fixed frequency through the anesthesia machine. In a fully networked operating room, as described by Koeny et al. [7], this parameter can be obtained and used to reduce the influence of signal noise drastically.
- Through the long analysis window with length of 64 seconds, the ANI has a noticeable low-pass character. This prevents a fast reaction onto a painful event.
- The static scaling factors of the original index yield a bad interpretability, because the RSA-amplitude depends on multiple factors like gender and age. A normalization can be introduced to solve this problem.
Methods
This section presents all details and requirements for the extended pain assessment algorithm, called the Surgical Analgesia Index (SAI). Firstly, an approach to obtain all required vitals through advanced hospital IT-infrastructure concepts will be presented. Also, the computation of heart rate variability and breath rate from ECG, PPG or capnometry will be shown. This section will be concluded by describing the algorithm deign of the new index.
The proposed algorithm works in a manufacturer-independent, networked operating room, which is currently developed in the OR.NET project [7]. All medical sensors and actors can communicate with another over a standardized protocol, called the Open Surgical Communication Protocol (OSCP), which also allows the communication with other hospital IT-systems. This setting builds the base for advanced algorithms that use signalfusion or big data analysis to assist physicians with their decisions.
The HRV, as well as the current breath rate can be obtained from a multitude of actors and sensors in a modern operating room. For example, the heart rate can be extracted from ECG-, PPG-, invasive blood pressure signals or even video (PPGI®) [8, 9]. Breath rates can be obtained from the ventilator settings, ECG - or even PPG signals. By fusing all different sources, noise and artifacts can be efficiently removed and more robust signals can be delivered.
Heart beats or breaths can be extracted from raw signals by using peak detection algorithms, like the ADAPIT-algorithm proposed by Yu et al. [6]. Firstly, this algorithm filters the raw signal with a median filter. The filter length depends on the underlying signal (ECG: 55 ms; PPG: 550 ms, CO2 : 1 s). The filtered version of the signal gets subtracted from its original. The result is a residual signal with only high frequent components remaining. Every peak, greater than a threshold is considered a maximum value. In a second step, a new threshold is chosen to be the half the mean value of all detected signal maxima. All values above this new threshold are collected as a string of markers. The period time P between two consecutive markers may not vary more than fifty percent. Otherwise, the specific marker will be discarded. The time stamps of the resulting signals can be differentiated to compute the so called Inter-Beat-Intervals (IBI), which represents the HRV in the time domain. The breath rate can be computed by differentiating the time stamps and computing their reciprocal values.
In the frequency representation of the HRV, the RSA can be best seen [10]. Figure 1 shows the spectrogram-representation of a HRV-signal, recorded from a mechanically ventilated patient during general anesthesia. The spectrogram was computed by calculating the short-time Fast Fourier transform (FFT) of the HRV with a Hamming window of length L = 30 s and a window overlap of 28 s. Explicitly noticeable is the maximum at breathing frequency (around 0.2 Hz). This is the RSA, caused by the mechanical ventilation with a static frequency (ventilator setting is highlighted in green). A slightly less prominent maximum at the double frequency can be interpreted as the second harmonic of the RSA.
1. Spectral signal representation of the heart rate variability trough short time Fourier transforms (tA10). 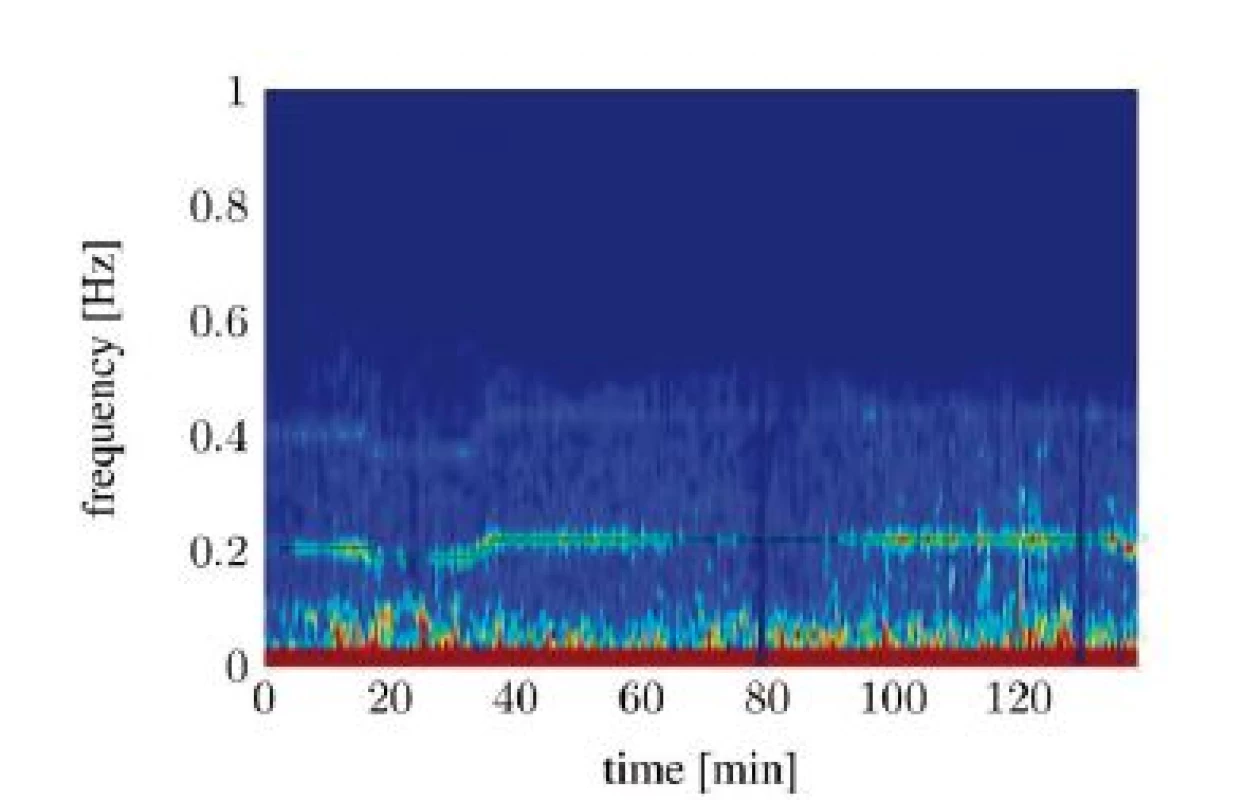
To analyze the signal, the amplitude of the frequency component that is the nearest to the given respiratory frequency fRSA is determined and called ARSA:
Depending on its magnitude, the RSA might disappear in the signal noise. To only consider signals above the noise floor, the expected noise value µ inside the band of possible respiratory frequencies is computed and subtracted from ARSA. All components smaller than zero are clipped in the resulting signal:
value of Aeff = 0 means that no RSA has been detected. To obtain an index that is comparable between patients, Aeff needs to be scaled properly. Since the maximum RSA magnitude for a specific patient, which occurs theoretically in a state of total relaxation is unknown, the scaling of Aeff poses some problems. In the following a possible approach to solve this problem is provided.
In Figure 2, the time series of Aeff is split into two different components: one slowly changing baseline and one faster changing component with almost constant magnitude. The baseline was calculated by applying a median filter with length of 300 seconds onto the signal from Figure 2. The high frequent residual signal was computed by subtracting the baseline from the original signal.
2. Unscaled A<sub>eff</sub> computed over the time (tA10). 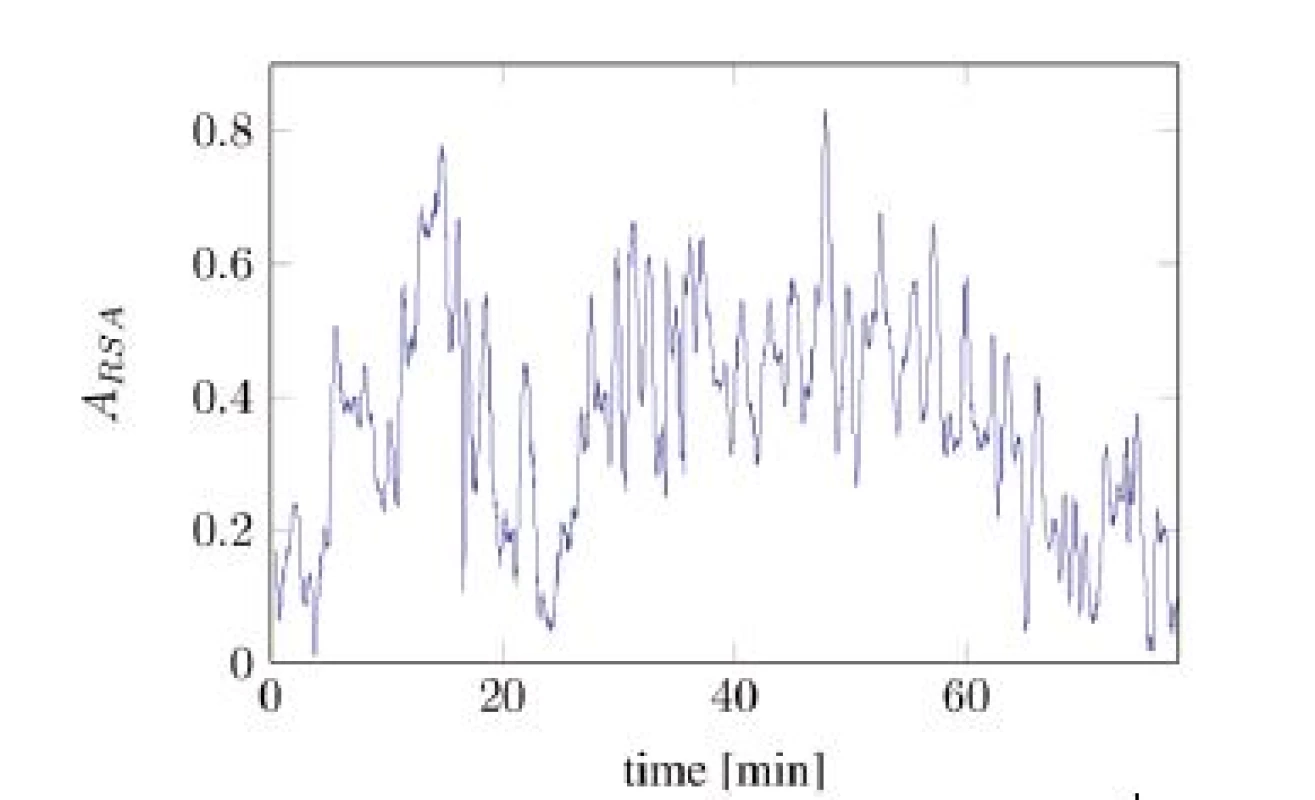
The observation was made that the baseline correlates with the administration of analgesics and the number of painful events, while the residual signal was mostly independent to pain-related influences. Moreover, this signal was similar regarding to mean frequency and magnitude variation among all recorded subjects but had different expected magnitudes. Hence, a normalization of Aeff, onto the expected magnitude of the residual signal Aeff,res, can increase the compatibility between patients. This leads to the formulation of the pain index as:
For an approximation of the expected value of Aeff,res a training phase of 5 min is used in case of realtime analysis. The factor in the above equation has been empirically chosen to yield a good transformation into the range [0,100].
3. Splitted components of A<sub>eff</sub>. 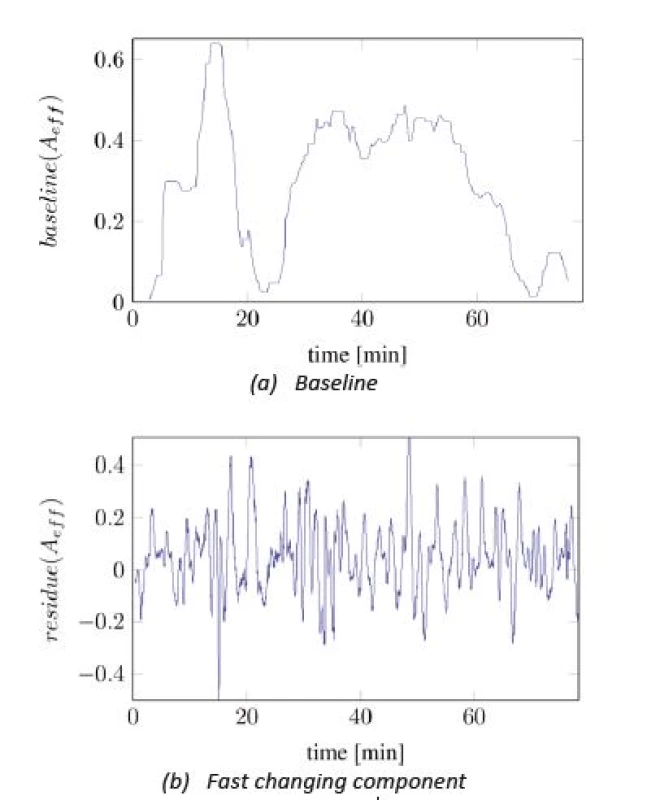
Results
Figure 4 and Figure 5 show the comparisons of the ANI and SAI for two anesthetized patients undergoing a surgical procedure. A clear difference between both indices can be seen. While the SAI shows distinct reactions on the most painful events and applications of analgesics, the ANI responds slower and more indistinct. Especially the reactions of the SAI onto morphine analgesics are remarkable. After every application an increase in the index value can be observed. Painful events mostly cause a decrease in the index value. The dead time between an event and its response is a few minutes faster than that of the ANI.
4. SAI baseline (blue) compared with ANI baseline (black) with particular, painful events (tA10). 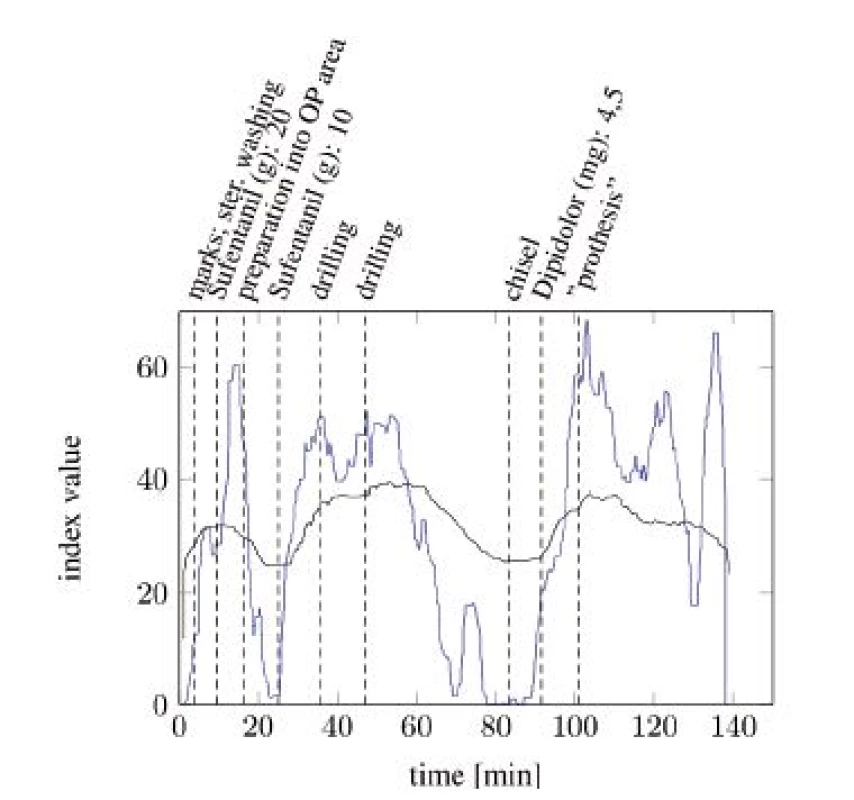
5. SAI baseline (blue) compared with ANI baseline (black) with particular painful events (tA13). 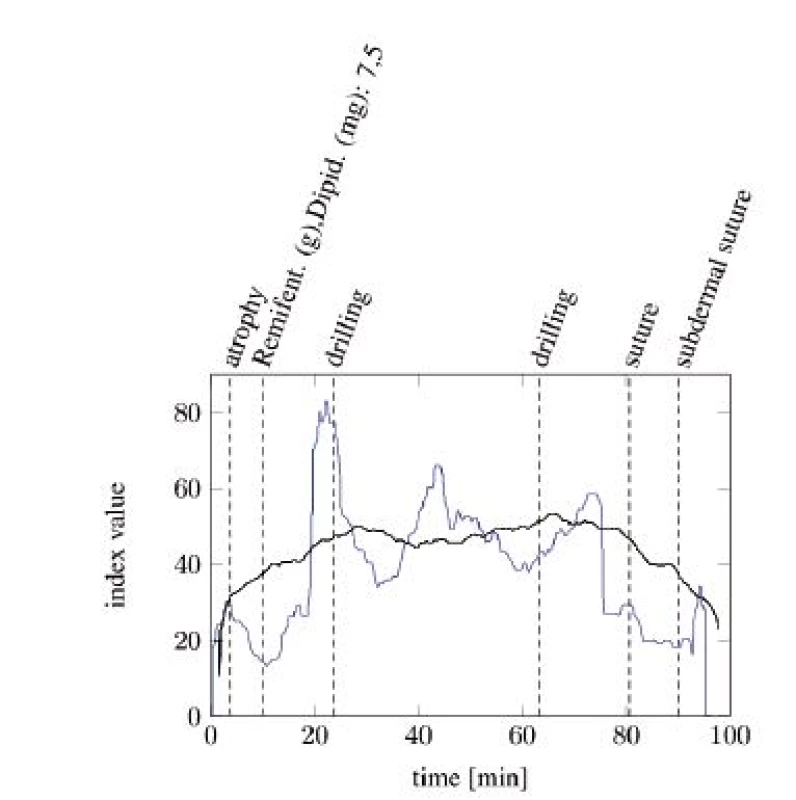
Unfortunately, both algorithms only work when the RSA is clearly detectable. Evaluating the spectrograms of all study participants shows that an interpretable RSA is often not given. In many cases the RSA below the SNR threshold or fully disappears in the signal noise. The situation gets worse in awake patients. A study conducted in a recovery room yields that the HRV from awake patients shows now clearly identifiable frequency containing a maximum, which could be interpreted as RSA. Figure 6 and Figure 7 show two different classes of spectra that don’t yield enough information for both algorithms: spectra with a highly irregular pattern (Figure 6) and spectra with almost no frequency components in the area of interest (Figure 7).
6. Spectral signal representation of the heart rate variability through the short time Fourier transform (pat02): no RSA detectable. 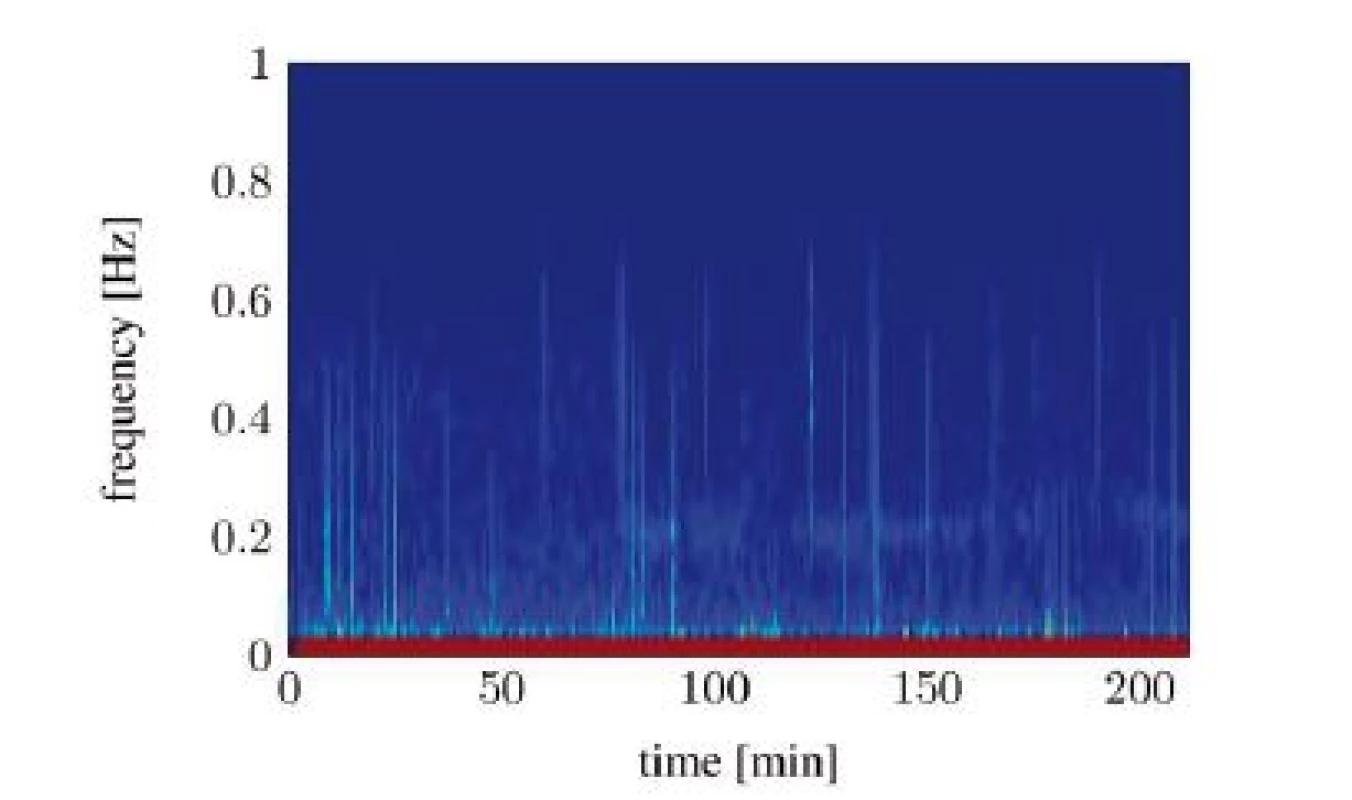
7. Spectral signal representation of the heart rate variability trough short time Fourier transform (pat03): noisy spectrum. 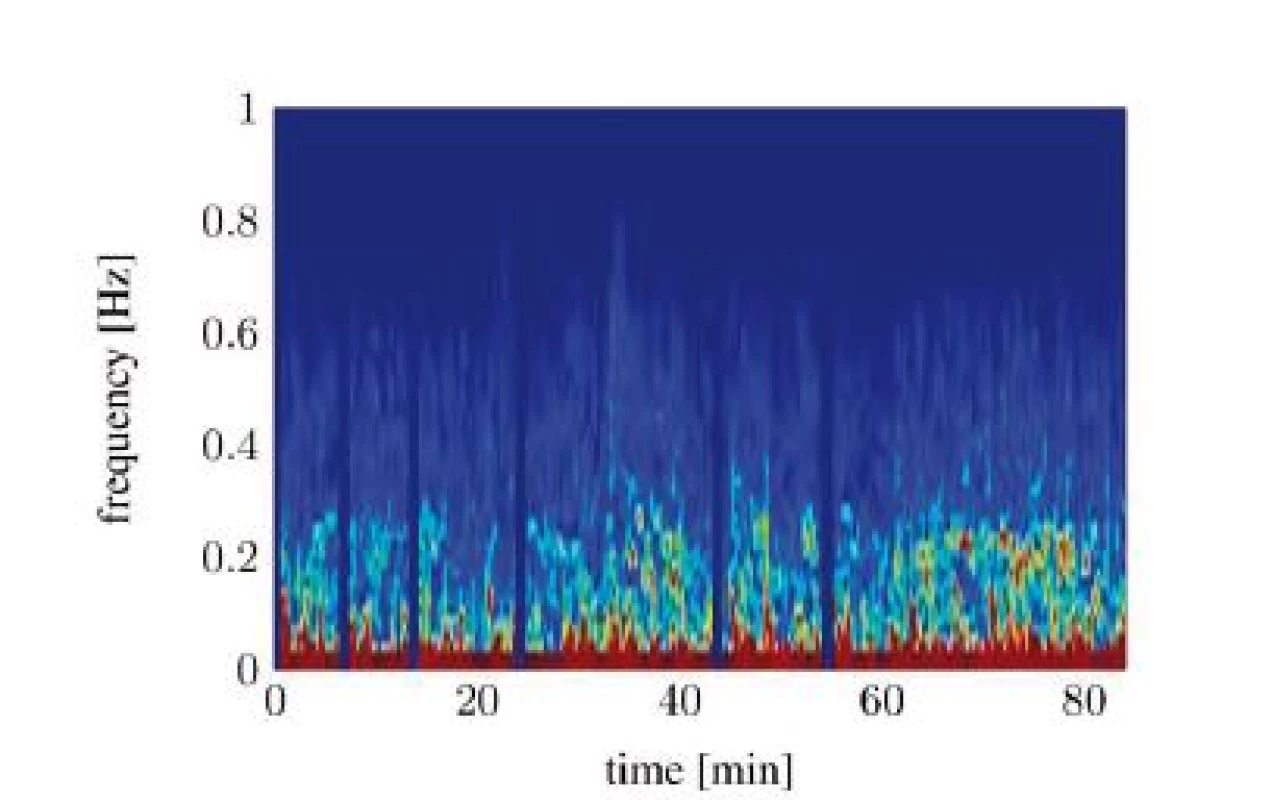
The question why different patients show no usable RSA during surgery is mostly unsolved. The study shows that mostly young, male subjects show a strong RSA, but we lack a clear explenation. There is also a good chance that the type of performed anesthesia or the ventilator settings alter the quality of the RSA. We found that the most interventions with a good detectable RSA were in short chronologically distance to another, which could imply that they were performed by the same anesthetist. To make statistically signifycant statements, these phenomena must be investigated on a larger scale.
Conclusion
We conclude that the SAI is promising for measuring pain during general anesthesia. A larger control study, possibly with a defined application of analgesics and painful events is needed to prove the validity of the index. Before that, the general occurrence of the RSA should be studied more in detail to evaluate, if the principle is suitable for a large range of patients. If the RSA is detectable with good signal to noise ratio, we believe that its observation yields a way towards an automated stress and pain analysis. We believe that our proposed algorithm works well under those conditions during general anesthesia. If the principle works for awake patients is still questionable, since many other factors also affect the HRV in this case.
This work is part of the OR.NET project, which was gratefully supported by the German Federal Ministry of Education and Research (BMBF) (16KT1228). We thank Simon Bertling and Xinchi Yu for their research work in this area as part of their thesis.
Janosch Kunczik, B. Sc.
Chair for Medical Information Technology
Helmholtz-Institute for Biomedical Engineering
RWTH Aachen University
Pauwelsstr. 20 D-52074 Aachen
E-mail: janosch.kunczik@rwth-aachen.de
Sources
1. Luginbuehl, M., Shumacher, P., Vuilleumier, P., Vereecke, H., Heise, B., Bouillon, T., Styrus, M.: Noxious Stimulation Response Index A Novel Anesthetic State Index Based on Hypnotic Opioid Interaction. In The Journal of the American Society of Anesthesiologists. Volume 112, 872–880.
2. Wennervirta, J., Hynynen, M., Koivusalo, A.-M., Uutela, K., Huiku, M., Vakkuri, A.: Surgical Stress Index as a Measure of Nociception/Antinociception Balance During General Anesthesia. In Acta Anaesthesiologica Scandinavica, vol. 52 2008.
3. Gholami, B., Haddad, M. M., Tannenbaum, A. R.: Relevance Vector Machine Learning for Neonate Pain Intensity Assessment Using Digital Imaging, In IEEE Transactions on Biomedical Engineering, vol. 57, no. 6, pp. 1457,1466, June 2010 doi: 10.1109/TBME.2009.2039214.
4. Logier, R., Jeanne, M., Tavernier, B., De Jonckheere, J.: Pain/Analgesia Evaluation Using Heart Rate Variability Analysis. In Engineering in Medicine and Biology Society, 2006. EMBS ’06. 28th Annual International Conference of the IEEE. ISBN 1557170X, 4303–4306.
5. Berntson, G., Cacioppo, J., Quigley, K.: Respiratory Sinus Arrhythmia: Autonomic Origins, Physiological Mechanisms, and Psychophysiological Implications. Psychophysiology, 1993, 30. Jg., Nr. 2, S. 183–196.
6. Yu, Z., Liu Z., Mckenna, T., Reisner At., Reifman J.: A Method for Automatic Identification of Reliable Heart Rates Calculatd from ECG and PPG Waveforms. In Jounral of the American Medical Informatics Association: JAMIA. 2006;13(3):309–320.
7. Koeny, M., Czaplik, M., Walter, R., Rossaint, R., Leonhardt, S.: Perspectives for Anesthesia in a Manufacturer Independent Networked Operating Room. In Biomedical Engineering – Pro-ceedings BMT 2014, 2014. 48. DGBMT Jahrestagung. Volume 59, Number S1, 373–375.
8. Koeny, M., Blanik, N., Yu, X., Czaplik, M., Walter, M., Rossaint, R., Leonhardt, S.: Using Photoplethysmography Imaging For Objective Contactless Pain Assessment. In Acta Polytechnica. Volume 54, Number 4, 275–280.
9. Koeny, M., Yu, X., Czaplik, M., Walter, M., Rossaint, R., Leonhardt, S.: Computing the Analgesia Nociception Index Based on PPG Signal Analysis. In Twenty-sixth European Congress on Surgical Infection, 2013.
10. Malik, M.: Heart rate variability. In Annals of Noninvasive Electrocardiology, 1996, 1(2), 151–181.
Labels
Biomedicine
Article was published inThe Clinician and Technology Journal
2017 Issue 4-
All articles in this issue
- ANALYSIS OF ULTRASOUND FIELD PARAMETERS DURING SONICATION EXPERIMENTS IN VITRO - INFLUENCE OF LABORATORY GLASS AND PLASTICS
- SENSITIVITY OF AUDITORY PERCEPTION TO CHANGES IN PHASE SPECTRUM
- CHARACTERIZATION OF THE BIAS BETWEEN OXYGEN SATURATION MEASURED BY PULSE OXIMETRY AND CALCULATED BY AN ARTERIAL BLOOD GAS ANALYZER IN CRITCALLY ILL NEONATES
- PAIN AND STRESS MEASUREMENT DURING GENERAL ANESTHESIA USING THE RESPIRATORY SINUS ARRHYTHMIA
- QUANTIFYING CARDIORESPIRATORY THORAX MOVEMENT WITH MOTION CAPTURE AND DECONVOLUTION
- The Clinician and Technology Journal
- Journal archive
- Current issue
- Online only
- About the journal
Most read in this issue- ANALYSIS OF ULTRASOUND FIELD PARAMETERS DURING SONICATION EXPERIMENTS IN VITRO - INFLUENCE OF LABORATORY GLASS AND PLASTICS
- CHARACTERIZATION OF THE BIAS BETWEEN OXYGEN SATURATION MEASURED BY PULSE OXIMETRY AND CALCULATED BY AN ARTERIAL BLOOD GAS ANALYZER IN CRITCALLY ILL NEONATES
- SENSITIVITY OF AUDITORY PERCEPTION TO CHANGES IN PHASE SPECTRUM
- QUANTIFYING CARDIORESPIRATORY THORAX MOVEMENT WITH MOTION CAPTURE AND DECONVOLUTION
Login#ADS_BOTTOM_SCRIPTS#Forgotten passwordEnter the email address that you registered with. We will send you instructions on how to set a new password.
- Career


