-
Medical journals
- Career
ANALYSIS OF ULTRASOUND FIELD PARAMETERS DURING SONICATION EXPERIMENTS IN VITRO - INFLUENCE OF LABORATORY GLASS AND PLASTICS
Authors: Martin Snehota 1,2; Jaromír Vachutka 1; Ladislav Dolezal 1; Hana Kolarova 1,2; Zuzana Mala 1; Ludmila Zarska 1
Authors‘ workplace: Department of Medical Biophysics, Faculty of Medicine and Dentistry, Palacky University Olomouc, Czech Republic 1; Institute of Molecular and Translational Medicine, Faculty of Medicine and Dentistry, Palacky University Olomouc, Czech Republic 2
Published in: Lékař a technika - Clinician and Technology No. 4, 2017, 47, 113-121
Category: Original research
Overview
Apart from being a powerful medical imaging technique ultrasound can also be used as a therapeutic modality. In vitro sonication experiments performed on cultured cells are one of primary research methods. However present sonication protocols and methods meet many effects influencing the final ultrasound dose experienced by the sonicated samples. The main aim of this study is to assess the influence of laboratory glass and plastics on ultrasound field parameters during in vitro sonication experiments. We performed measurements of ultrasound field parameters (ultrasound intensity and its local distribution) behind commonly used laboratory glass and plastics placed into the far field region of an ultrasound transducer. We tested the influence of several types of culture dishes, culture plates and sample test tubes. Culture dishes reduced ultrasound intensity by tens of percent but did not affect the shape of ultrasound field.
6-well plate reduced ultrasound intensity only by 5%. Culture plates with well diameter smaller than the diameter of the main lobe of ultrasound beam focus ultrasound energy. Laboratory glass and plastics with curved surface also focus ultrasound energy. We proved that laboratory glass and plastics considerably affect ultrasound field parameters. Thus sonicated samples are exposed to different ultrasound conditions compared to those reported in some of scientific articles. Rest of factors (standing waves formation, streaming, cell mixing, heating and homogeneity of ultrasound field in terms of near and far ultrasound field) affecting the ultrasound field parameters experienced by sonicated samples also need to be studied further.Keywords:
Ultrasound, ultrasound field, sonication, in vitro experiment, ultrasound dosimetryIntroduction
Ultrasound is defined as mechanical waves of frequency above 20 kHz. It has been used as a powerful medical imaging technique for more than 40 years. In the past decades ultrasound has also been extensively studied for its possible therapeutic effects. Therapeutic ultrasound is defined as the use of ultrasound for the treatment of diseased organs or structures [1]. Spectrum of therapeutic ultrasound use is wide including either already clinically used HIFU, lithotripsy, sonothrombolysis and physiotherapy procedures or scientifically researched modalities such as gene therapy, sonophoresis, sonoporation and sonodynamic therapy [2–4]. Therapeutic ultrasound delivers its effects via different mechanisms of action depending on the desired biological outcome. The most important mechanisms of action of therapeutic ultrasound encompass inertial and non-inertial cavitation, heating and mechanical stress [5].
In vitro experiments using cultured cells are one of the basic research methods. However nowadays in vitro experiments using sonication protocols and methods meet many factors influencing the final ultrasound field parameters like standing waves formation, streaming, cell mixing, heating and reduction of ultrasound energy behind laboratory glass and plastics (= LGP) [6]. Local distribution of ultrasound intensity also needs to be assessed.
Nowadays there are many sonication protocols developed leading to uncertainty of ultrasound dose received by the sonicated sample and thus leading to low reproducibility of these experiments. The uncertainty of actual ultrasound exposure dose experienced by the sonicated cells can be up to 700% [7]. When standing waves are eliminated the sonicated samples may not undergo desired biological effects [8]. Indeed, Secomski et al. proved that 18 times lower spatial average, temporal average ultrasound intensity is needed to destroy the cells under the standing wave conditions in comparison with the intensity level needed to achieve the same effect under free field exposure [9].
Fig. 1 represents in vitro sonication set-ups, which are used mostly.
1. Mostly used in vitro sonication set-ups. (a) The sonicated sample is placed on the water surface in sonication tank. The ultrasound transducer is placed at the bottom of the tank. (b) The sonicated sample is placed in front of the transducer. Both are immersed in sonication tank. (c) Same as (b) but there is an ultrasound absorber placed behind the sonicated sample. (d) The sonicated sample in LGP is placed directly on the ultrasound transducer. The space between LGP and transducer is filled with ultrasound coupling material. (e) The ultrasound transducer is placed directly in the sonicated sample. 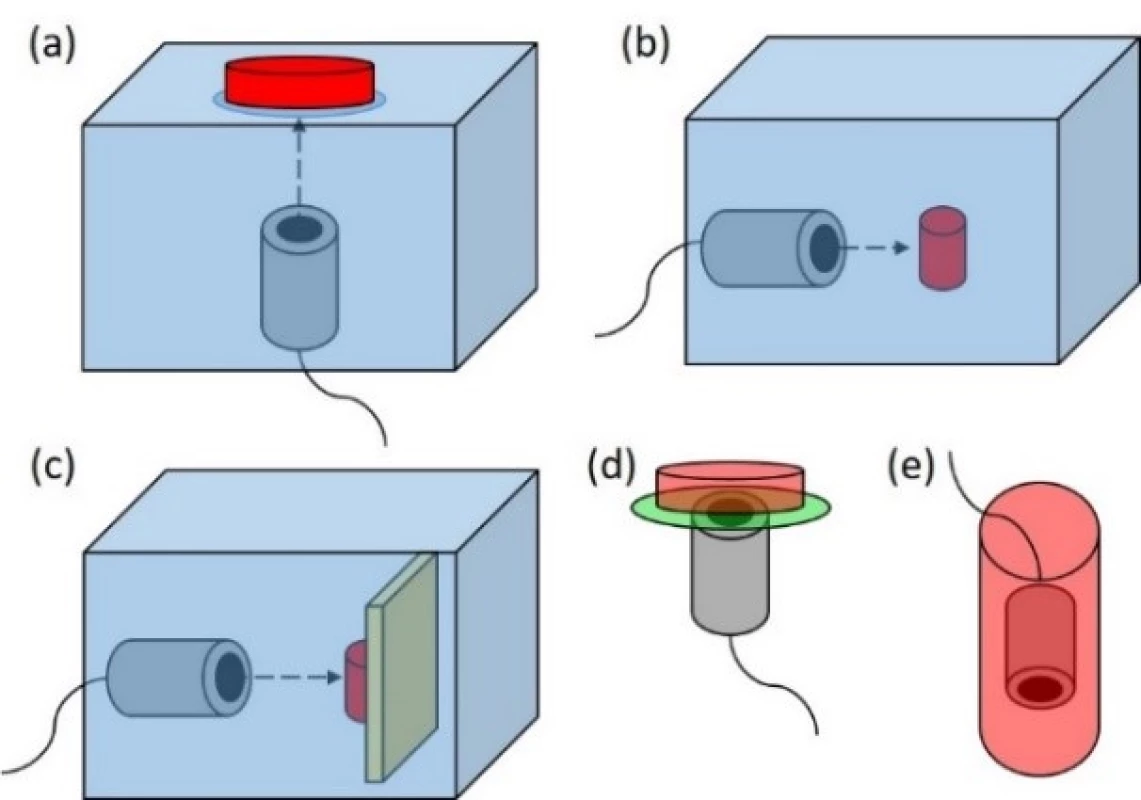
Each of these set-ups meets some of the aforementioned effects influencing the final ultrasound dose experienced by the sonicated sample.
Standing waves may occur either between waterair boundary and the bottom of the laboratory material (Fig. 1a and 1d), or between the front and back walls of laboratory material (Fig. 1b and 1c) or between wall of laboratory material and transducer (Fig. 1a–1e).
Streaming and cell mixing affects ultrasound field parameters received by particular cells during sonication of cell suspensions. Streaming may also cause mechanical stress to cells adhering to LGP (especially Fig. 1e).
LGP affect the final ultrasound dose experienced by the sonicated sample in most of in vitro sonication set-ups (Fig. 1a–1e) either by reflecting or absorbing the incidental ultrasound energy.
Placing the sonicated sample into strongly non-homogeneous ultrasound near field area also increases the uncertainty of ultrasound dose experienced by the sonicated sample across the area (Fig. 1d and 1e).
LGP play important role in majority of in vitro sonication experiments. Therefore, the main aim of this study is to assess the influence of common LGP on the final dose of ultrasound experienced by the sonicated sample.
Materials and methods
Experimental set-up
The sonication scheme we used is shown in Fig. 2. All measurements were performed in the Ultrasonic measurement tank (Precision Acoustics, Dorchester, UK) filled with degassed water. The dimensions of measurement tank are following: width of 50 cm, height of 50 cm and length of 100 cm. The ultrasound field was generated by circular plane piston transducer s/n: PA192 with a nominal frequency of 3.5 MHz (Precision Acoustics, Dorchester, UK). Active element had diameter of 19 mm and was driven in continuous mode at power 0.1 W. The bottom of LGP tested was placed vertically to the last axial maximum of the ultrasound field by using homemade holder. The holder did not reach the sonicated area of LGP. We used a spirit level to adjust the position of LGP accurately. The ultrasound field parameters were measured
by 0.5 mm needle hydrophone SN: 1057 (Precision Acoustics, Dorchester, UK) using 3D positioning system (accuracy of movement 0.01 mm) which is part of measurement tank. The hydrophone was lead through ultrasound absorbing material HAM A (Precision Acoustics, Dorchester, UK) to minimize the influence of standing waves. Signal acquired by the hydrophone was registered by oscilloscope WaveRunner 62Xi (LeCroy, Chestnut Ridge, New York, USA) and transmitted to computer for further analysis.2. Experimental set-up shown in correlation with ultrasound field distribution along z axis. LAM: last axial maximum. 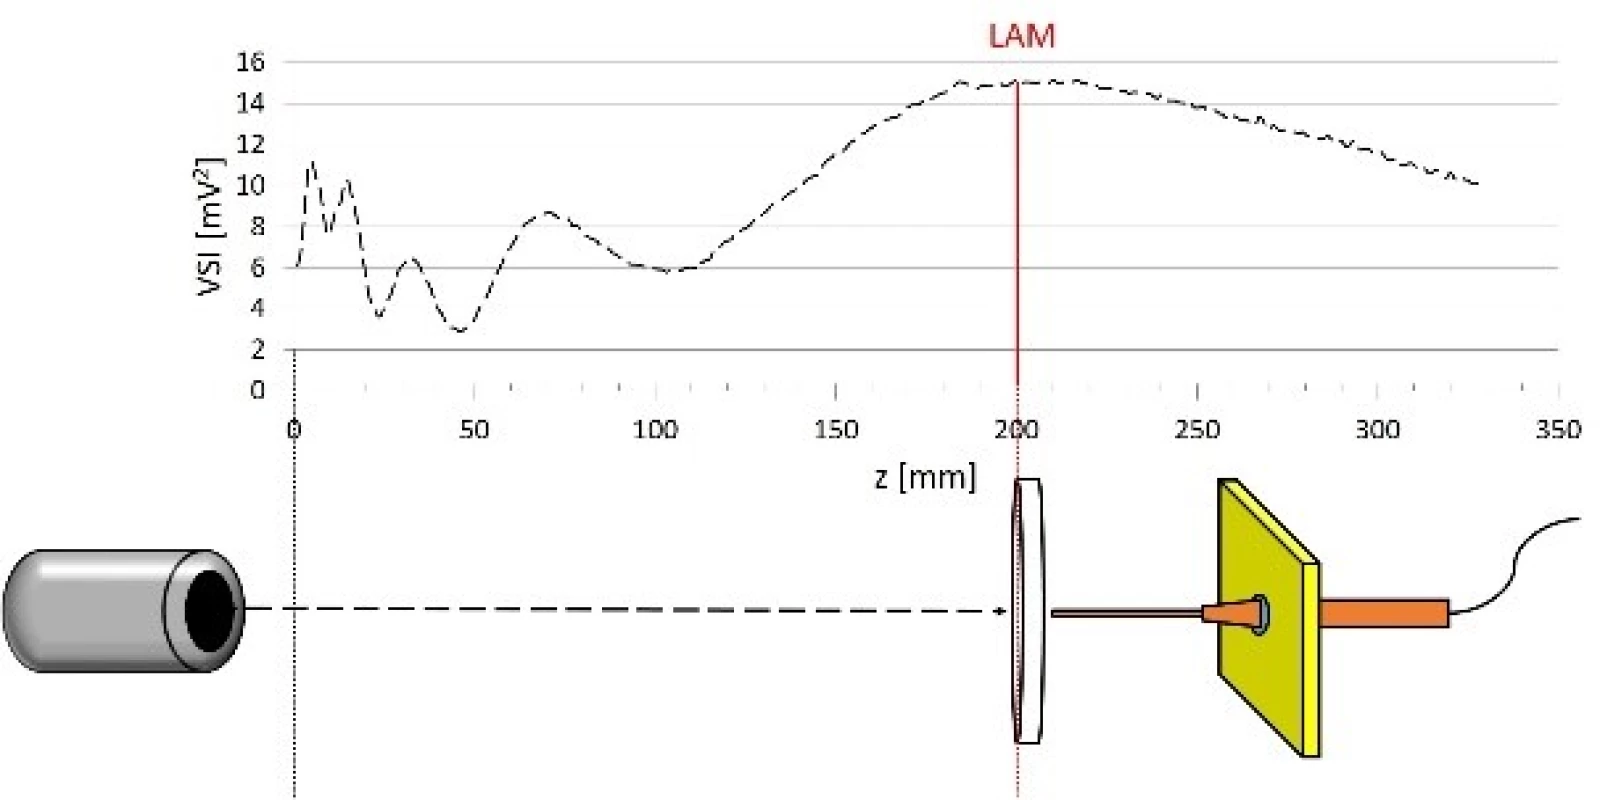
Laboratory glass and plastics tested
Table 1 shows an overview of LGP tested. Abbreviations used in following graphs, manufacturers and product numbers or specification of LGP are also included.
1. Laboratory glass and plastics tested. 
Scans
We used several types of scans while measuring the ultrasound field parameters behind tested objects. They are represented in Fig. 3.
3. Examples of scans used. (a) the representtation of xyz axes (b) linear scan along z axis (c) orthogonal cross xy scan (d) planar xy scan. 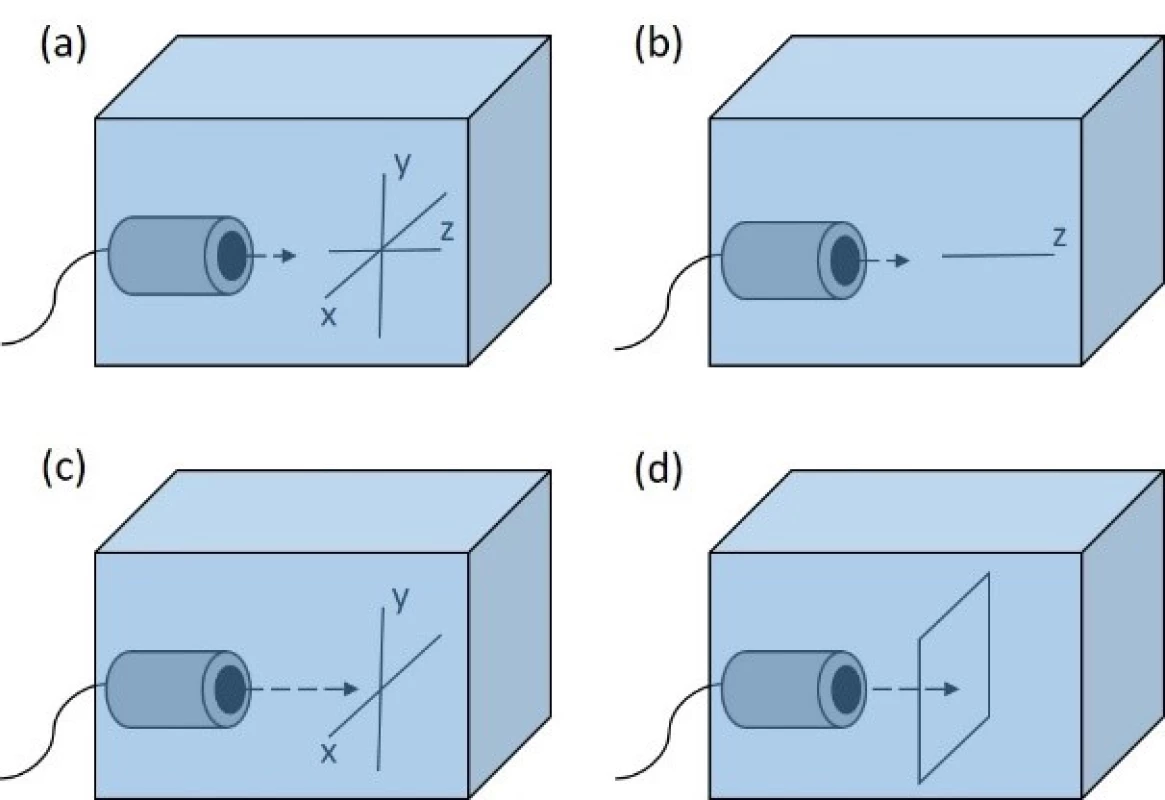
Linear scan—this scan is conducted by performing a measurement of a line of points along one axis (usually z axis).
Orthogonal cross scan—this scan is a combination of two linear scans which are perpendicular to each other.
Planar scan—this is a measurement of a net of points defined by two of xyz axes (usually xy axes).
Orthogonal cross scans were made three times and values measured were averaged. Planar scans were conducted once.
At every measured point we recorded time course of voltage generated by the hydrophone. This time course was an average of 100 consecutive sweeps. The measured point was then characterized by voltage squared integral (VSI) which is calculated as a sum of squares of instantaneous voltage values. The value of VSI is directly proportional to the acoustic energy. Therefore, this parameter is sufficient for relative measurements of ultrasound intensity.
Measurement procedure
First of all, we calculated LAM to be at distance of 21.3 cm at 20 °C. We aligned the ultrasound transducer and hydrophone on the beam axis by comparing two orthogonal cross scans in ultrasound far field region. To prevent damage of hydrophone the point corresponding to z = 0 mm was chosen to be at distance of 1 cm in front of the transducer.
Then a linear scan along z axis was performed to find last axial maximum. We placed the bottom of tested laboratory material to the last axial maximum.
We divided LGP into three groups: 1. culture dishes, 2. culture plates and 3. sample test tubes. Centre of each dish / well was placed on the z axis corresponding to the line joining centre of transducer and tip of hydrophone (see Fig. 2). All scans were made with 1 mm step between points.
- The bottom of culture dish was placed to the last axial maximum (z= 200 mm) and parameters of ultrasound field were measured behind each culture dish at distance of z = 210 mm. Orthogonal cross xy scans 21×21 mm and planar xy scan 21×21 mm were performed.
- The bottom of well of culture plate was placed to the last axial maximum (z= 200 mm) and parameters of ultrasound field were measured behind each culture dish at distance of z = 230 mm. Orthogonal cross xy scans 21×21 mm and planar xy scan 21×21 mm were performed.
- The curved laboratory materials were cut lengthwise and the top of the front wall was placed to the last axial maximum. This is represented in Fig. 4. Subsequently we performed orthogonal cross xy scans 21×21 mm and planar xy scan 21×21 mm behind tested object at distance of z = 211 mm. Also we conducted planar xz scan 21×25 mm at z= 211–235 mm.
4. Sonication of curved laboratory materials. 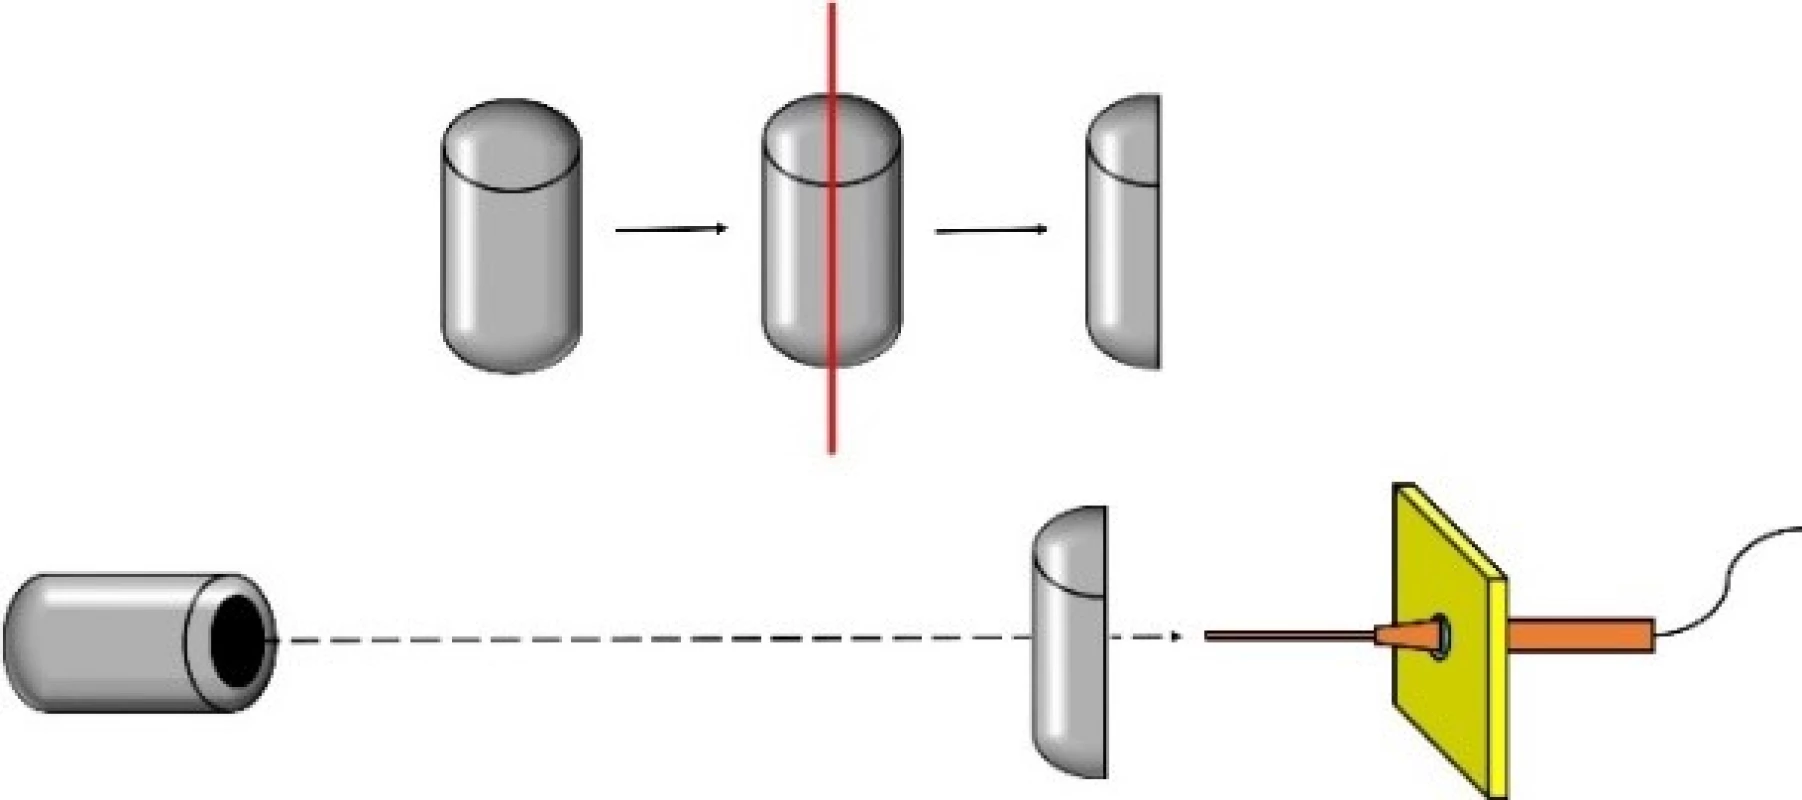
For all aforementioned scans there was a reference scan made in free ultrasound field, where there was no obstacle between ultrasound transducer and hydrophone. Reference scans and scans behind each tested object were compared. Also we conducted orthogonal cross xy scans 21×21 mm and planar xy scan 21×21 mm at distance of z = 200 mm (= last axial maximum).
In all graphs present point x = 0 mm and y = 0 mm refers to the centre of ultrasound field (= beam axis).
All graphs were displayed using Microsoft Excel 2016.
Results
Last axial maximum
Last axial maximum was found to be at distance of z = 200 mm. This is shown in Fig. 5.
5. Linear scan along z (beam) axis. 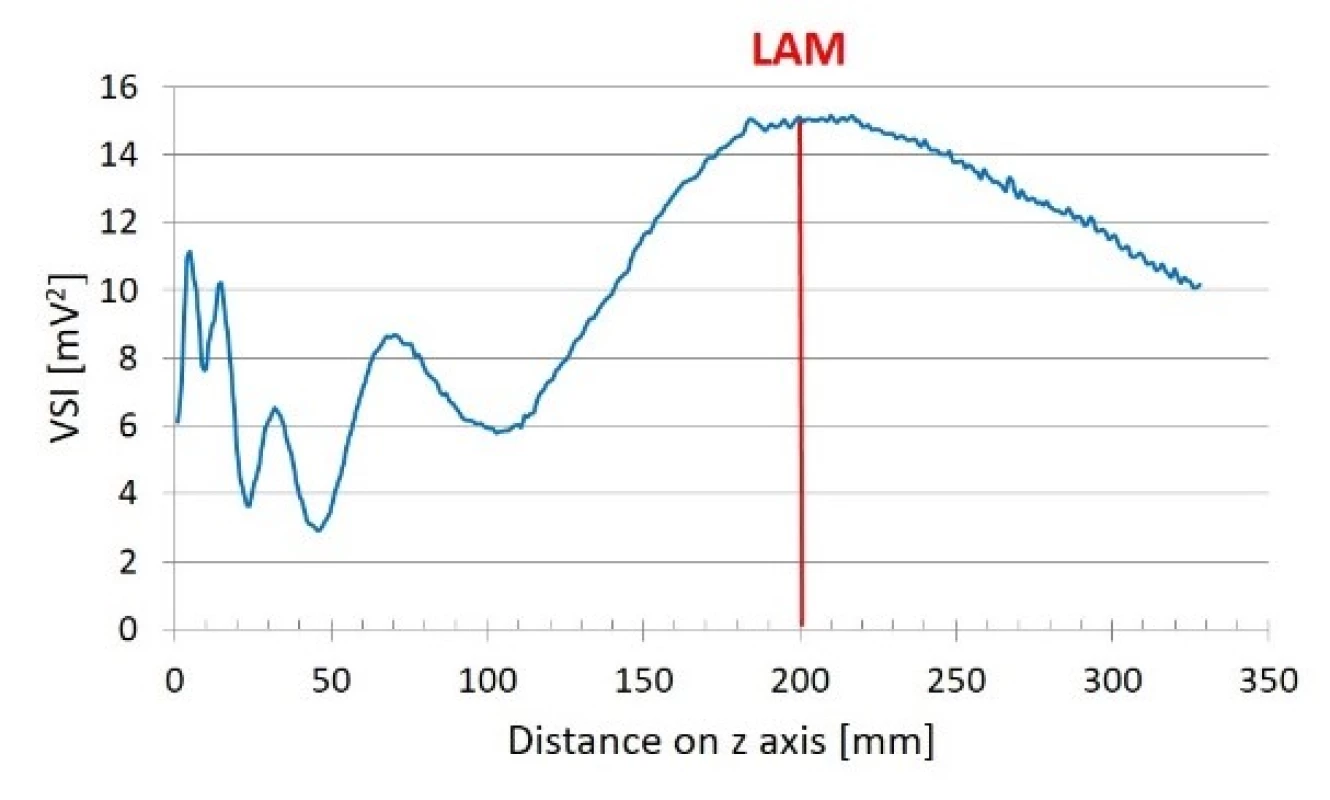
Reference scans
Fig. 6 shows two examples of reference planar scans.
6. Examples of reference planar scans made. (a) planar xy scan at z = 211 mm, (b) planar xz scan at z = 200–328 mm. 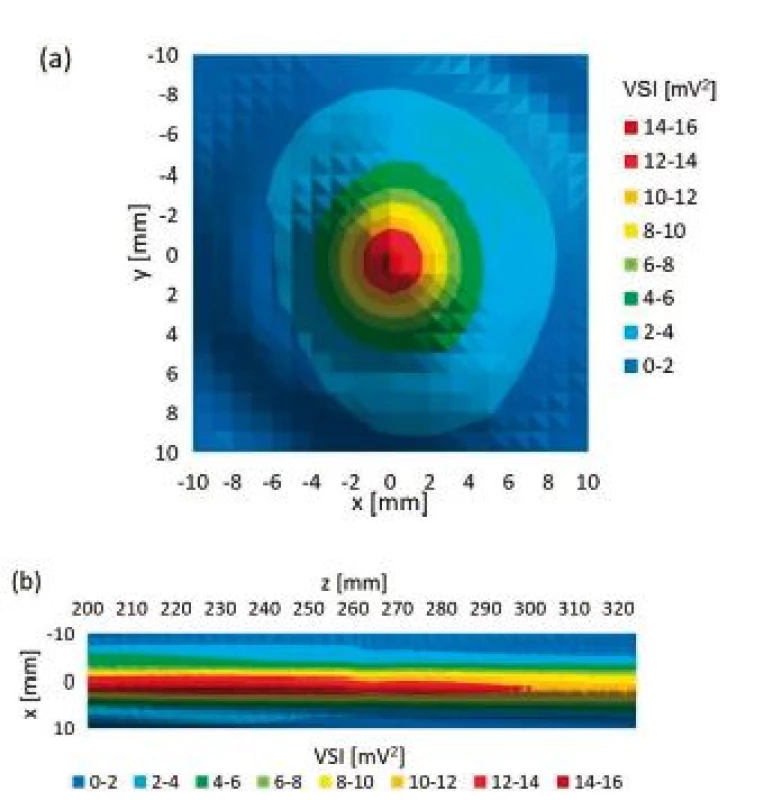
Culture dishes
Fig. 7 compares values measured behind culture dishes during orthogonal cross xy scans. Table 2 represents relative ratios of maximum ultrasound field
intensity measured behind particular culture dish and maximum intensity measured during reference scan. Fig. 8 shows local ultrasound intensity distribution in planar xy scans of glass culture dish (Fig. 8a) and plastic culture dish of 40 mm diameter (Fig. 8b).2. Final maximum ultrasound intensity behind several types of culture dishes. 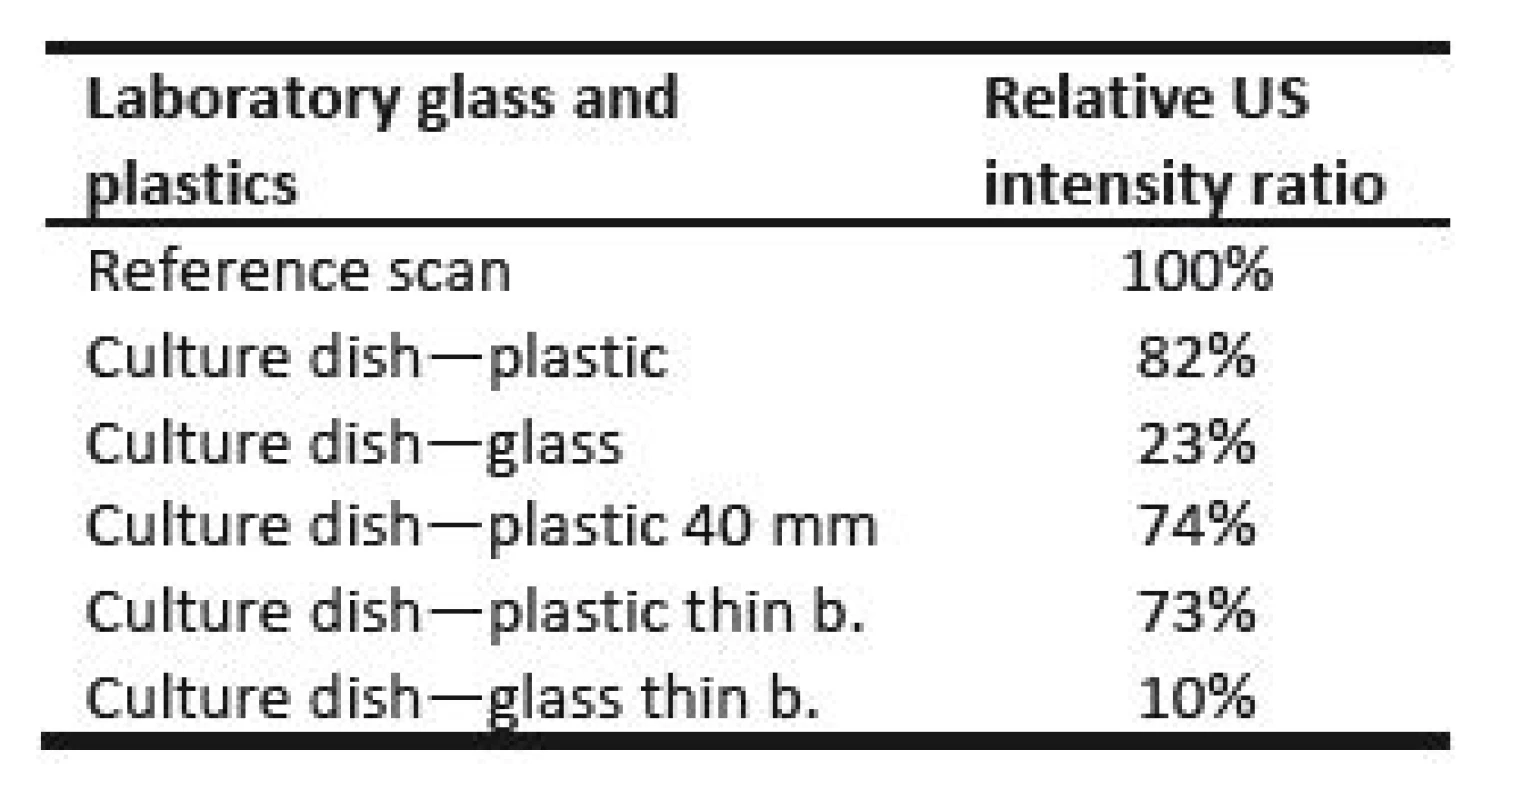
7. Orthogonal cross xy scans behind particular culture dishes. Ref 210 mm: reference scan at z = 210 mm. (a) compared values measured on x axis (b) compared values measured on y axis. 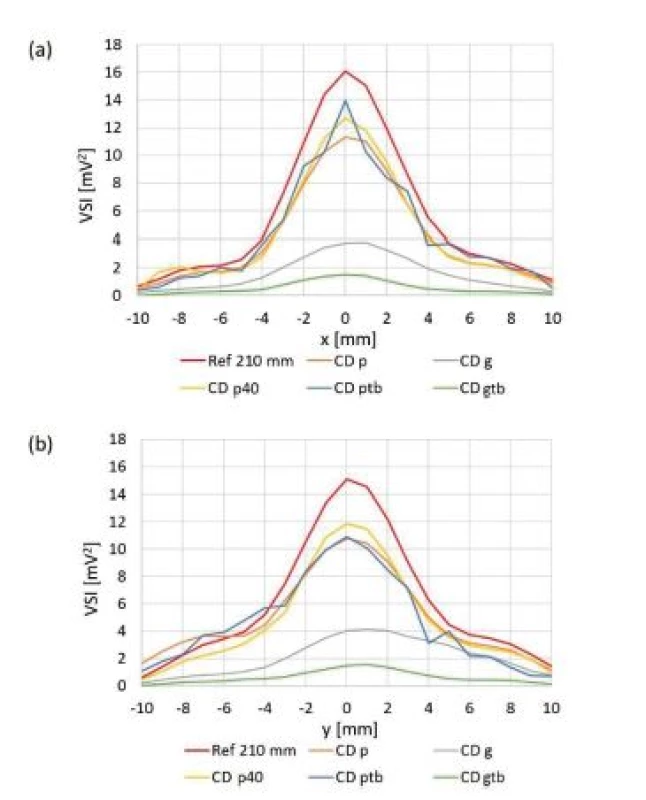
8. Planar xy scan behind particular culture dish (a) glass culture dish, (b) plastic culture dish (40 mm diameter). 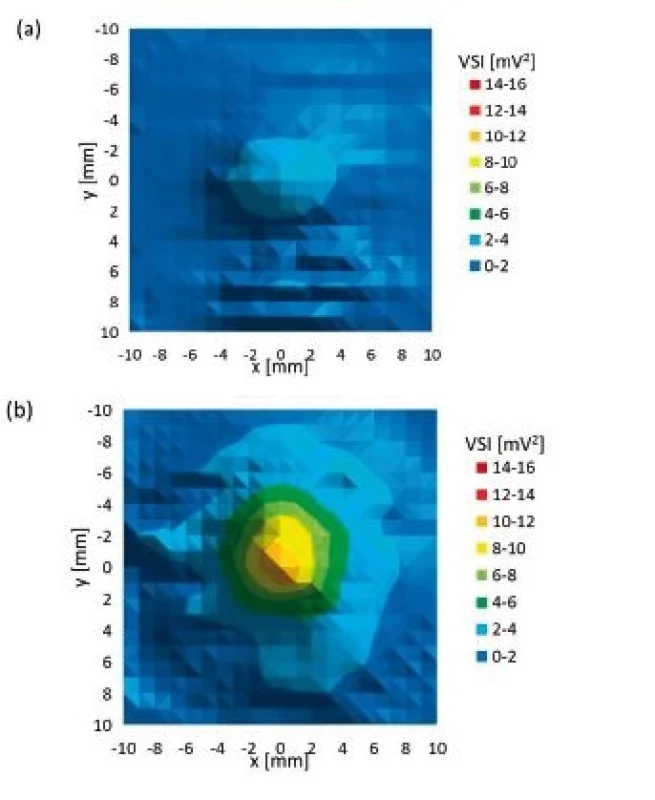
Culture plates
9. Orthogonal cross xy scans behind particular culture plates. Placement of centre of well of 96-well plate on the beam axis was technically difficult and values obtained are not reliable. Ref 230 mm: reference scan at z = 230 mm, (a) compared values measured on x axis, (b) compared values measured on y axis. 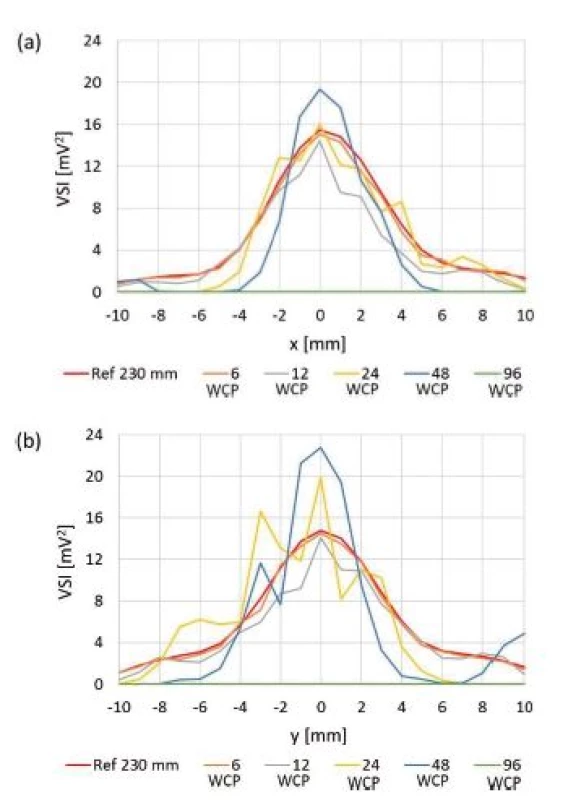
Fig. 9 compares values measured for culture plates during orthogonal cross xy scans. Table 3 represents relative ratios of maximum ultrasound field intensity measured behind particular culture plate and maximum intensity measured during reference scan. Fig. 10 shows local ultrasound intensity distribution in planar xy scans behind 6-well plate (Fig. 10a) and 48-well plate (Fig. 10b).
3. Final maximum ultrasound intensity behind several types of culture plates. 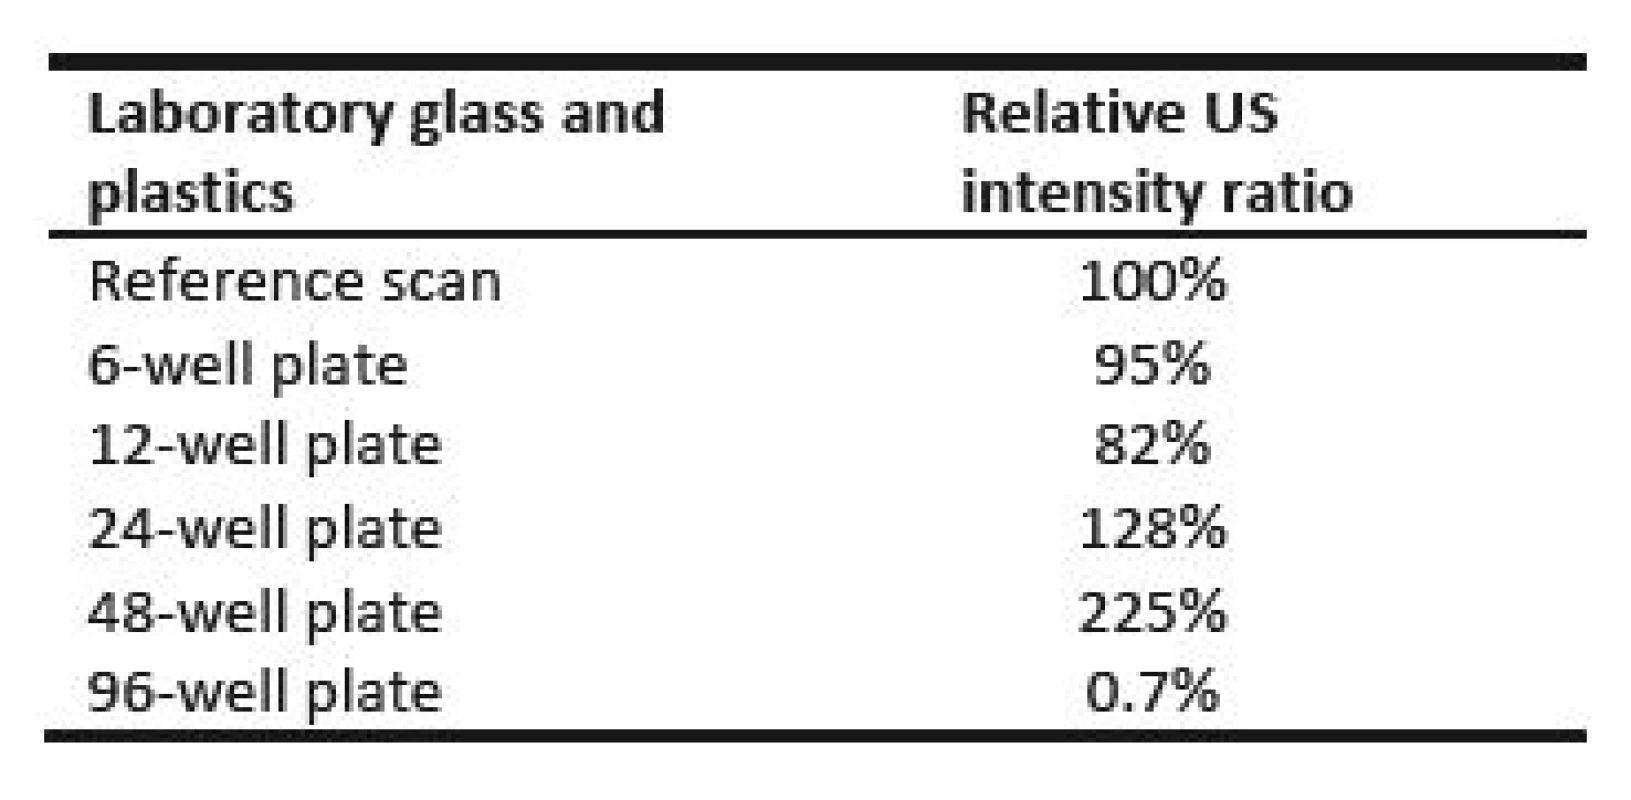
10. Planar xy scan behind particular culture plate (a) 6-well plate, (b) 48-well plate. 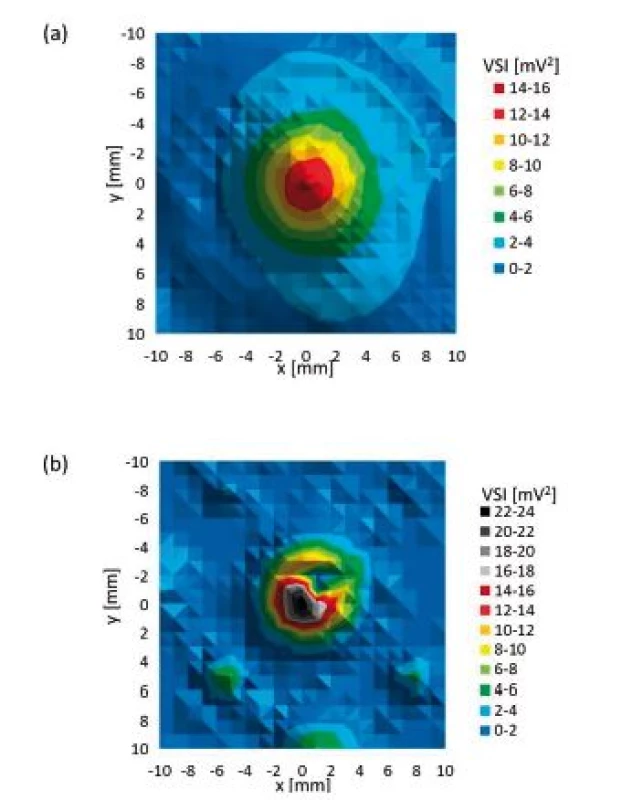
Curved surfaces
Comparison of intensities measured during orthogonal cross xy scans behind sample test tubes is shown in Fig. 11. Table 4 represents relative ratios of maximum ultrasound field intensity measured behind particular sample test tube and maximum intensity measured during reference scan. Fig. 12 shows local ultrasound intensity distribution in planar xy and xz scans behind Eppendorf test tube (Fig. 12a and 12b respectively). A linear z scan behind Eppendorf tube on the beam axis is shown in Fig. 13
4. Final maximum ultrasound intensity behind several types of sample test tubes. 
11. Orthogonal cross xy scans behind LGP with curved surface. Ref 211 mm: reference scan at z = 211 mm, (a) compared values measured on x axis, (b) compared values measured on y axis. 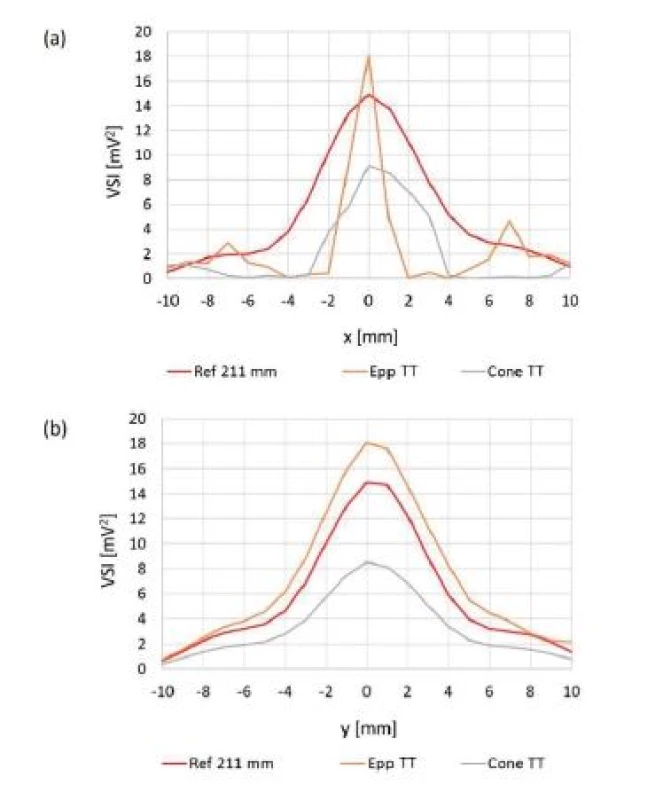
12. (a) planar xy scan behind Eppendorf test tube, (b) planar xz scan behind Eppendorf test tube. 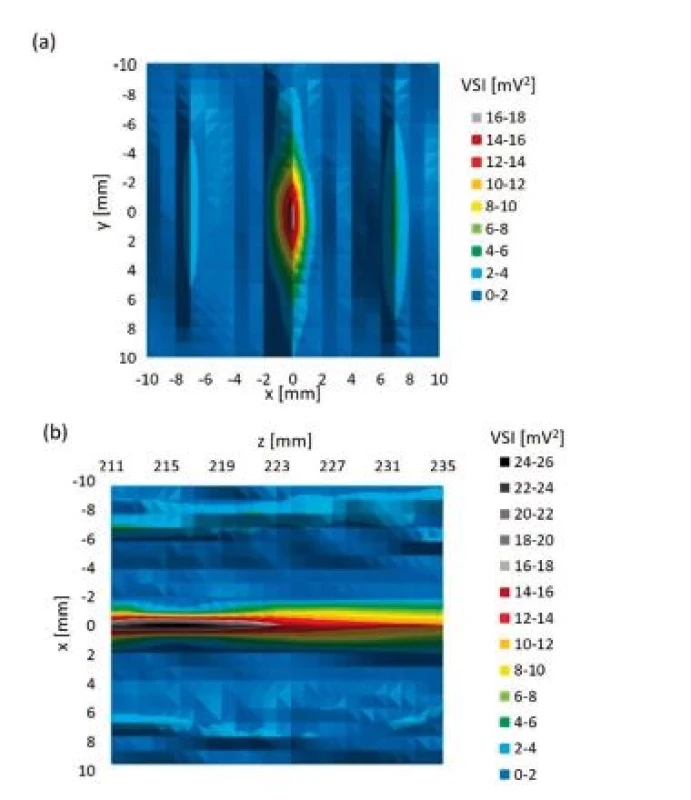
13. Linear z scan behind Eppendorf test tube. 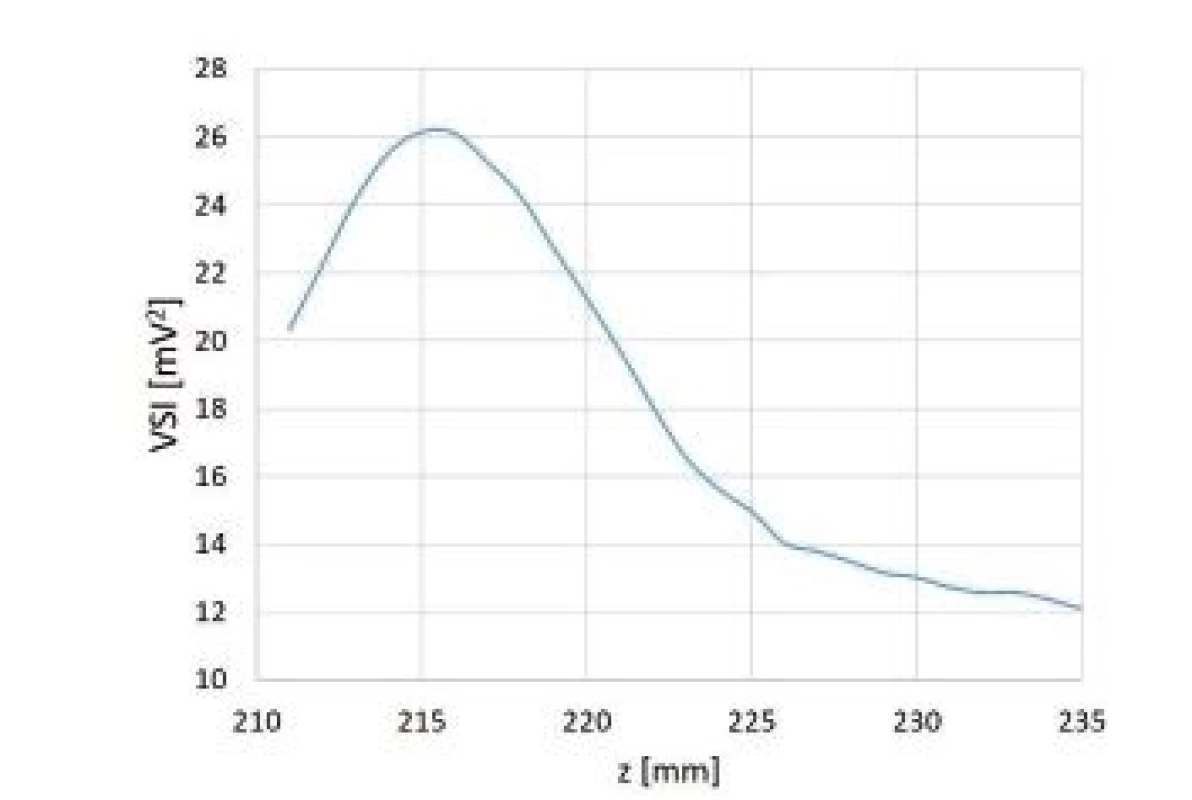
Discussion
Our results show that majority of LGP we tested influenced the final ultrasound field parameters either by locally increasing or decreasing ultrasound intensity by tens of percent and in some cases also by affecting the final shape of ultrasound field.
Reference scans showed typical ultrasound field distribution. Last axial maximum was found at z = 200 mm which corresponds to our calculation (z = 0 mm was chosen to be 1 cm in front of the transducer). Z = 0–200 mm region represents non-homogeneous near field whereas far field region is present in region z = 200–328 mm (Fig. 5). Reference planar xy and xz scans (Fig. 6) show circular ultrasound field distribution with lowest intensity in peripheral parts and gradually increasing intensity when moving to the centre of the field. The ultrasound intensity was slightly decreasing when increasing distance from transducer on the z axis in the far field region. Intensity decreasing in the far field region was less than 4% corresponding to 30 mm distance on z axis. Rest of reference scans showed no abnormalities. Relative variability of the data measured during reference orthogonal cross xy scans was assessed by calculation of variation coefficient. The variation coefficient ranged from 4.05% to 0.02%. The variation coefficients around [0,0] point were much lower than the variation coefficients in peripheral parts of orthogonal cross scans of all reference scans. This happened because the signal-to-noise ratio is much lower in the peripheral parts of ultrasound field produced by circular plane piston transducer. Therefore, we also chose the maximum ultrasound field intensity measured during reference scan and maximum ultrasound field intensity behind particular LGP for expression of relative US intensity ratio. Relative variability of the data measured during orthogonal cross xy scan behind particular LGP was also assessed by calculation of variation coefficient. The variation coefficients around beam axis were similar to the ones calculated for reference scans.
All culture dishes reduced final ultrasound field intensity. Plastic culture dishes reduced final maximum ultrasound intensity to 73–82% of maximum ultrasound intensity of reference scan, whereas glass culture dishes reduced final maximum ultrasound intensity to 10–23% of maximum ultrasound intensity of reference scan. The difference between acoustic impedances of plastic material and degassed water is smaller than the difference between acoustic impedances of glass and degassed water. Therefore, we measured much lower ultrasound intensities behind glass culture dishes than behind plastic culture dishes. The shape of ultrasound field remained almost unaffected by all culture dishes (Fig. 8). Rest of planar scans conducted behind particular culture dishes also did not show any big alteration of ultrasound field shape. The bottom of culture dishes is probably not perfectly fabricated. Thus minute variations of bottom thickness across area may have appeared and some small ultrasound field shape alterations may have occurred, i.e. Fig. 8b shows not perfectly circular ultrasound field shape. However, we can conclude that apart from minute ultrasound field shape changes, the symmetry of all planar and orthogonal cross scans behind all culture dishes was preserved.
6-well plate showed reduction of maximum intensity to 95% of maximum ultrasound intensity of reference scan and also did not show any significant alteration of ultrasound field shape (Fig. 9 and Fig. 10a). We think that in this case the ratio between bottom thickness and ultrasound wavelength was ideal for ultrasound transmission. However, this needs to be confirmed by measurements undertaken at different frequencies, intensities and bottom thicknesses. The maximum ultrasound intensity was locally increased behind 24 - and 48-well plates to 128% and 225% of maximum ultrasound intensity of reference scan respectively (Fig. 10b and Tab. 3). Focusing probably appeared because the diameter of well was smaller than diameter of the main lobe of ultrasound beam. Our hypothesis is shown in Fig. 14. The ultrasound field is diverging when increasing the distance from the transducer in the ultrasound far field region. However, if particular diverging ultrasound beam (beams 1,2 and 3 in Fig. 14) reaches an interface represented by wall of LGP (yellow cylinder in Fig. 14), then part of ultrasound energy is either absorbed or transmitted through the wall of LGP. A slight scattering of ultrasound beam may also occur because of minute irregularities of LGP wall. However, not negligible part of ultrasound energy could be reflected back to centre parts of the ultrasound field. Therefore, the local ultrasound intensity may be increased (red cylinder area in Fig. 14). This is one possible explanation of focusing. However, this phenomenon also deserves future study.
14. Hypothesis explaining focusing of ultrasound energy. 
If the dimension of particular well is smaller than diameter of the main lobe of original ultrasound field, then diameter of ultrasound field measured behind that well corresponds to the dimension of that well. However, the shape of ultrasound field remains circular and symmetrical (Fig. 10b). However, like in case of culture dishes there could have occurred some tiny irregularities concerning ultrasound field circularity because of small irregularities of LGP tested. Tiny inclination in any axis of LGP may have also caused some alterations in terms of symmetry of ultrasound field shape. Placement of centre of well of 96-well plate on the beam axis was technically difficult and values obtained are not reliable. Therefore, the measurement of 96-well plate should not be taken into any further consideration.
The ultrasound energy was focused by both test tubes. (Fig. 12). Concerning cone test tube we did not see the focus itself because it was laying behind tested region but beam converging was apparent. Therefore, the maximum intensity behind cone test tube may differ.
To avoid any unpredictable error, we previously confirmed the stability of transducerhydrophone set-up by conducting 3 consecutive linear scans along z axis within 12 hours. Relative variability of the data measured was assessed by calculation of variation coefficient. The variation coefficient ranged from 6.55% to 0.06%. The values registered by the hydrophone showed no anomaly over time. According to the manufacturer´s instructions transducer and hydrophone were left in the tank for 30 minutes before the measurements were taken. Also according to the manufacturer´s instructions the transducer was switched on at power 0.01 W for 30 minutes to warm up before the measurement. The temperature ranged from 20.7 °C to 21.1 °C during all measurements.
Our experiment encounters some limitations. We performed our measurements only at power 0.1 W. Therefore, no extrapolation neither to higher nor to lower output values can be done. We see another limitation in the fact that all measurements were performed in continuous mode. Thus standing waves formation could not have been completely avoided, even though we lead hydrophone through ultrasound absorbing material. Standing waves might have influenced our results to some extent. However, many in vitro sonication experiments are also performed in continuous mode. But our results still cannot be implied on sonication experiments using short ultrasound pulses where standing waves formation can be avoided by selecting proper ultrasound pulse duration.
We think that proper combination of ultrasound frequency and intensity, material and thickness of bottom of ultrasound exposure device can lead to minimizing the influence of LGP on ultrasound dose experienced by sonicated samples.
In vitro studies are important method to assess effects of therapeutic ultrasound. However, nowadays sonicating is a complex problem. Even though some scientific works dealing with sonication issues start to emerge [10], there still does not exist any standardized sonication protocol. In literature there exists only a limited amount of recommendations of how to expose the tested samples to ultrasound in vitro in order to achieve higher reproducibility of achieved results and to specify exactly the ultrasound dose experienced by the sonicated samples [11].
Conclusion
Sonication protocols and methods still need to be optimised. At this moment sonicated samples are exposed to different ultrasound field parameters compared to those which are declared in many present scientific articles. Based on our experiments we can conclude that labware made of plastic material is less likely to attenuate ultrasound energy than labware made of glass. Shape of LGP in relation to ultrasound field may also influence the ultrasound dose experienced by sonicated samples significantly. However, we did not test all LGP commercially available. Therefore, we encourage research teams performing sonication experiments in vitro to assess the influence of LGP during their experiments. Rest of factors influencing ultrasound field parameters (see Introduction), that were not analysed in this study, also need to be assessed in detail.
Acknowledgements
This work was supported by the Grant Project IGA_LF_2017_021.
MUDr. Martin Snehota
Department of Medical Biophysics
Faculty of Medicine and Dentistry
Palacky University Olomouc
Hnevotinska 3, Olomouc, 775 15, Czech Republic
E-mail: m.snehota@email.cz
Sources
1. Yu, T., Wang, Z., & Mason, T. J.: A review of research into the uses of low level ultrasound in cancer therapy. Ultrasonics sonochemistry, 2004, vol. 11, no. 2, p. 95–103.
2. Mason, T. J.: Therapeutic ultrasound an overview. Ultrasonics sonochemistry, 2011, vol. 18, no. 4, p. 847–852.
4. Wood, A. K., & Sehgal, C. M.: A review of low-intensity ultrasound for cancer therapy. Ultrasound in medicine & biology, 2015, vol. 41, no. 4, p. 905–928.
5. Miller, D. L., Smith, N. B., Bailey, M. R., Czarnota, G. J., Hynynen, K., & Makin, I. R. S. (2012): Overview of therapeutic ultrasound applications and safety considerations. Journal of Ultrasound in Medicine, 2012, vol. 31, no. 4, p. 623–634.
6. Alassaf, A., Aleid, A., & Frenkel, V.: In vitro methods for evaluating therapeutic ultrasound exposures: present-day models and future innovations. Journal of therapeutic ultrasound, 2013, vol. 1, no. 1, p. 21.
7. Leskinen, J. J., & Hynynen, K.: Study of factors affecting the magnitude and nature of ultrasound exposure with in vitro set-ups. Ultrasound in medicine & biology, 2012, vol. 38, no. 5, 8. Kinoshita, M., & Hynynen, K. (2007): Key factors that affect sonoporation efficiency in vitro settings: the importance of standing wave in sonoporation. Biochemical and biophysical research communications, 2007, vol. 359, no. (4), p. 860–865.
9. Secomski, W., Bilmin, K., Kujawska, T., Nowicki, A., Grieb, P., & Lewin, P. A.: In vitro ultrasound experiments: Standing wave and multiple reflections influence on the outcome. 10. Hensel, K., Mienkina, M. P., & Schmitz, G.: Analysis of ultrasound fields in cell culture wells for in vitro ultrasound therapy experiments. Ultrasound in medicine & biology, 2011, vol. 37, no. 12, p. 2105–2115.
11. Patel, U. S., Ghorayeb, S. R., Yamashita, Y., Atanda, F., Walmsley, A. D., & Scheven, B. A.: Ultrasound field characterization and bioeffects in multiwell culture plates. Journal of therapeutic ultrasound, 2015, vol. 3, no. 1, p. 8.
Labels
Biomedicine
Article was published inThe Clinician and Technology Journal

2017 Issue 4-
All articles in this issue
- ANALYSIS OF ULTRASOUND FIELD PARAMETERS DURING SONICATION EXPERIMENTS IN VITRO - INFLUENCE OF LABORATORY GLASS AND PLASTICS
- SENSITIVITY OF AUDITORY PERCEPTION TO CHANGES IN PHASE SPECTRUM
- CHARACTERIZATION OF THE BIAS BETWEEN OXYGEN SATURATION MEASURED BY PULSE OXIMETRY AND CALCULATED BY AN ARTERIAL BLOOD GAS ANALYZER IN CRITCALLY ILL NEONATES
- PAIN AND STRESS MEASUREMENT DURING GENERAL ANESTHESIA USING THE RESPIRATORY SINUS ARRHYTHMIA
- QUANTIFYING CARDIORESPIRATORY THORAX MOVEMENT WITH MOTION CAPTURE AND DECONVOLUTION
- The Clinician and Technology Journal
- Journal archive
- Current issue
- Online only
- About the journal
Most read in this issue- ANALYSIS OF ULTRASOUND FIELD PARAMETERS DURING SONICATION EXPERIMENTS IN VITRO - INFLUENCE OF LABORATORY GLASS AND PLASTICS
- CHARACTERIZATION OF THE BIAS BETWEEN OXYGEN SATURATION MEASURED BY PULSE OXIMETRY AND CALCULATED BY AN ARTERIAL BLOOD GAS ANALYZER IN CRITCALLY ILL NEONATES
- SENSITIVITY OF AUDITORY PERCEPTION TO CHANGES IN PHASE SPECTRUM
- QUANTIFYING CARDIORESPIRATORY THORAX MOVEMENT WITH MOTION CAPTURE AND DECONVOLUTION
Login#ADS_BOTTOM_SCRIPTS#Forgotten passwordEnter the email address that you registered with. We will send you instructions on how to set a new password.
- Career

