-
Medical journals
- Career
THE FRACTAL DIMENSION-BASED DESCRIPTOR OF THE MICROVASCULAR PATTERN ON THE HISTOLOGICAL SECTION
Authors: Jaromír Šrámek; Aneta Pierzynová; Tomáš Kučera
Authors‘ workplace: Institute of Histology and Embryology, 1st Faculty of Medicine, Charles University, Prague, Czech Republic
Published in: Lékař a technika - Clinician and Technology No. 3, 2019, 49, 83-86
Category:
Overview
The microvascular pattern in the histological section, i.e. the point-pattern composed of capillaries perpendicular to the plane of section, contains information about the three-dimensional structure of the capillary network. Histological processing is followed by the shrinkage of tissue of uncertain magnitude. In order to obtain relevant information, the scale-independent analysis is necessary. We used an approach based on the Minkowski cover of measured set. The true fractal dimension of the point pattern is obviously of zero, but the artificial result of the algorithm can be related to the complexity of shape. We fitted the log-log plot by the modified rounded ramp function and the slope of the oblique part was used as the fractal based descriptor. We demonstrated on histological samples of the heart that this fractal-based parameter has the property of scale and rotation invariance.
Keywords:
histopathology – biomedical image analysis – fractal analysis – point-pattern analysis
Introduction
Main approach to the analysis of tissues under both physiological and pathological conditions is usually based on the analysis of two-dimensional sections. Tissue processing for the histological analysis is accompanied by some artifacts including shrinkage. The magnitude of shrinkage depends on the composition of the tissue [1, 2]. Obviously, the shrinkage affects quantitative analysis of the structure of tissues.
The microvascular density, i.e., the surface density of capillaries on the two-dimensional histological section, is commonly used to description of the microvascular network. Changes of the microvascular network are associated with several pathologies including cardiovascular diseases [3], metabolic syndrome [4], and tu-mors [5].
The fractal dimension is the scale invariant descriptor by nature. There are plenty of methods of estimation of the fractal dimension in digitalized images [6]. Results of these algorithms are assumed to be scale invariant with certain limitations [7]. The estimated fractal dimension of the non-fractal object can be also noninteger. As demonstrated by Carlin [8], the result can be related to the complexity of the shape. This observation makes the fractal dimension attractive for biology because it allows to quantify irregularity of the shape by the scale-invariant manner. Unfortunately, this property can be lost [7]. Moreover, there are several terms denoted as the "fractal dimension". In this paper, the Minkowski-Bouligand fractal dimension [9] is used.
The differential box-counting algorithm is commonly used method for estimation of the fractal dimension [7]. Modification of this algorithm in order to analyze the point-pattern is straightforward and also sometimes used, but this approach has substantial disadvantages [10]. Indeed, if we tested the scale invariance of the box-counting algorithm used to analysis of the microvascular patter, but the result was unsatisfactory [11].
Instead of the regular mesh, which is probably the root of disadvantages of the box-counting algorithm, we have focused on the measurement based on the Minkowski cover [9].
Methods
The Descriptor Main derivation of the fractal dimension is described in the paper [9], we briefly recall important steps. The Minkowski cover E(ε) of a set E assumed to be the subset of the Euclidean space R2 is defined as follows:
where B_ε (x) is a ball of radius ε centered on the point x. Let |o|2 denotes the area of given object in the Euclidean space R2. The Minkowski-Bouligand dimension of the set E is defined as follows:
For estimation using finite-sized covering balls, the following linear relationship between parameters has been derived:
By their definition, balls B_ε (x) should be any geo-metric structure with diameter ε, the only one require-ment is that the closure of the ball ¯(B_ε (x) ) must be homeomorphic to the disc. In this work, squares were used. Main advantage of squares is their simplicity in digital geometry, main disadvantage is their rotational asymmetry. The disc is seemingly better due to the symmetry of their shape. Unfortunately, the errors associated with description of the disk in digital plane can lead to the worse result [12].
The log-log plot (Equation 3) describes the line only in the case of the fractal object. The finite set of points in the plane has the fractal dimension of zero by its definition. Indeed, if the diameter of the covering balls is too small or too big, the incline of the log-log plot is zero. The log-log plot has therefore the sigmoidal shape. For reasonable small diameters of covering balls, the shape of the fitting curve looks rather like the ramp. The fractal dimension-based descriptor, simply the fractal dimension, can be estimated as the oblique asymptote of the fitting function. We modified the rounded ramp function described by Lagerlöf [10]:
Lagerlöf proposed this function as possible alternative to splines. We modified the rounded ramp function in order to obtain independent parameters of shape and position. We also respected basic shape of the log-log plot (Equation 3). The result is as follows:
The oblique asymptote of the rounded ramp function can be assessed using the technique well known from the elementary calculus. Generally, the slope of the oblique asymptote (FD) is as follows:
Analytical solution of this limit is as follows:
Parameters A, B, C, D in the equations above are not necessarly from the set of real numbers. In order to keep the shape and orientation of the ramp function and with respect to the pixel-based nature of distances and areas, both A and B are greater than zero and both C and D are lesser than zero in all cases. This ensures that the estimated fractal dimension is greater than zero.
Histological samples
We used samples of the myocardial tissue harvested during the cardiac surgery. These samples were used in our previous research, informed content allows also this use. We used one sample from the left ventricle and one sample from the right ventricle.
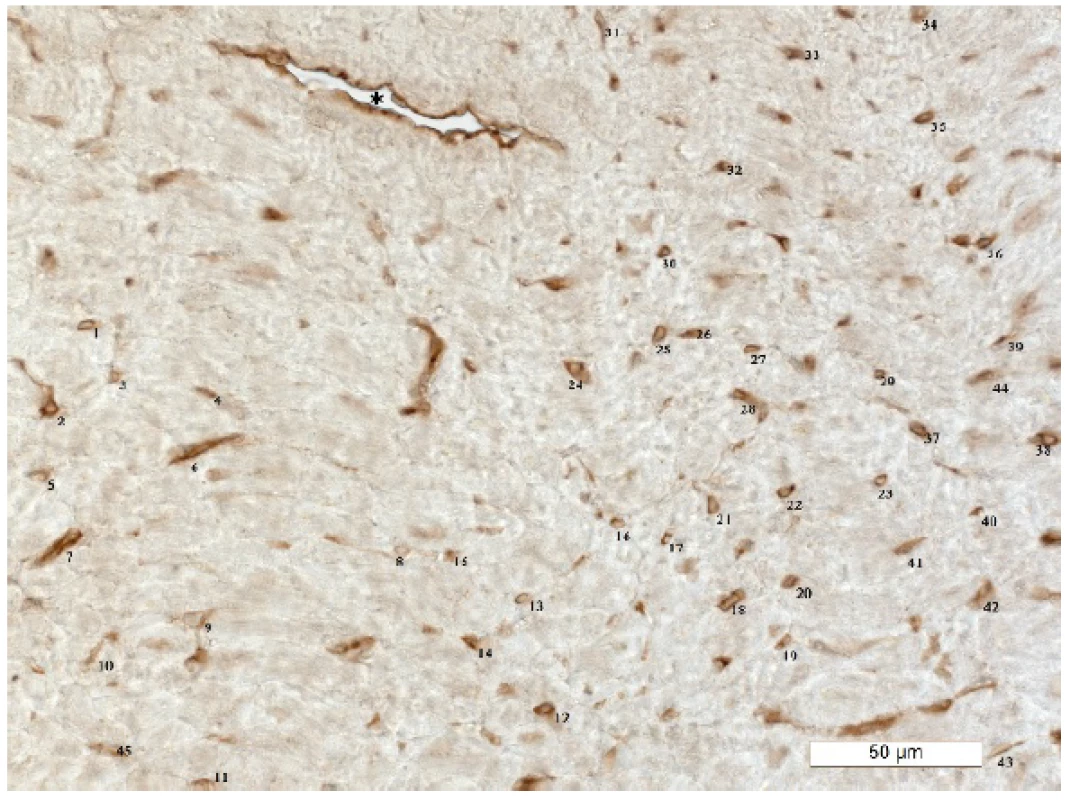
Samples of tissue were fixed in the 4% formalin, embedded into the paraffine-wax, and cut to the 5 μm thick sections. For visualization of the capillaries, immunohistochemical staining with antibodies targeted to CD31 protein was used. From each slide, one representative image under high magnification (400×) was obtained. Capillaries perpendicular to the plane of section were selected manually as the center point in the visible lumen. Example of histological staining and manual counting is on Figure 1. Files with coordinates of the center points were used for further analysis. For the analysis of the numerical stability of the algorithm, numerically scaled and rotated data were used.
1. The result of immunostaining (anti-CD31) and manual counting of capillaries perpendicular to the plane of section of myocardium (numbers). Note that only microvessels, i.e., precapillary arterioles, capil-laries, and postcapillary arterioles, were taken into account. Bigger vessels(*) were omitted. Scale is inserted. 
Implementation and analysis
In order to calculate the covered area, we wrote the straightforward implementation of the covering in the C language (gcc 7.3.0). The coordinates of the capil-laries were used as centerpoints of boxes with sub-sequently higher and higher size. For each size of boxes, total covered area was assessed and both the covered area and diameter of the disc were used to calculate points of the log-log plot according to the Equation 3. Fitting of the log-log plot was performed in the R language (3.4.4) using the standard function nls (nonlinear least-squares). With respect to previously published works [12], we used half of the length of the shortest side of the source image as maximal length of side of the covering box. The smallest box has the length 21 pixels and the step of increase of the side of the covering boxes was 2 pixels. In the case of scaled and rotated data, the size of the image was also scaled.
We used two samples of the myocardium, the left and right ventricle. From each sample, one representative image was taken for further analysis. Numerically shrunk (scale 0.5 to 1.5, step 0.1) and rotated (from 0 to 90 degrees, 11 steps) images were used for analysis of the quality of the scale and rotational invariance.
Results
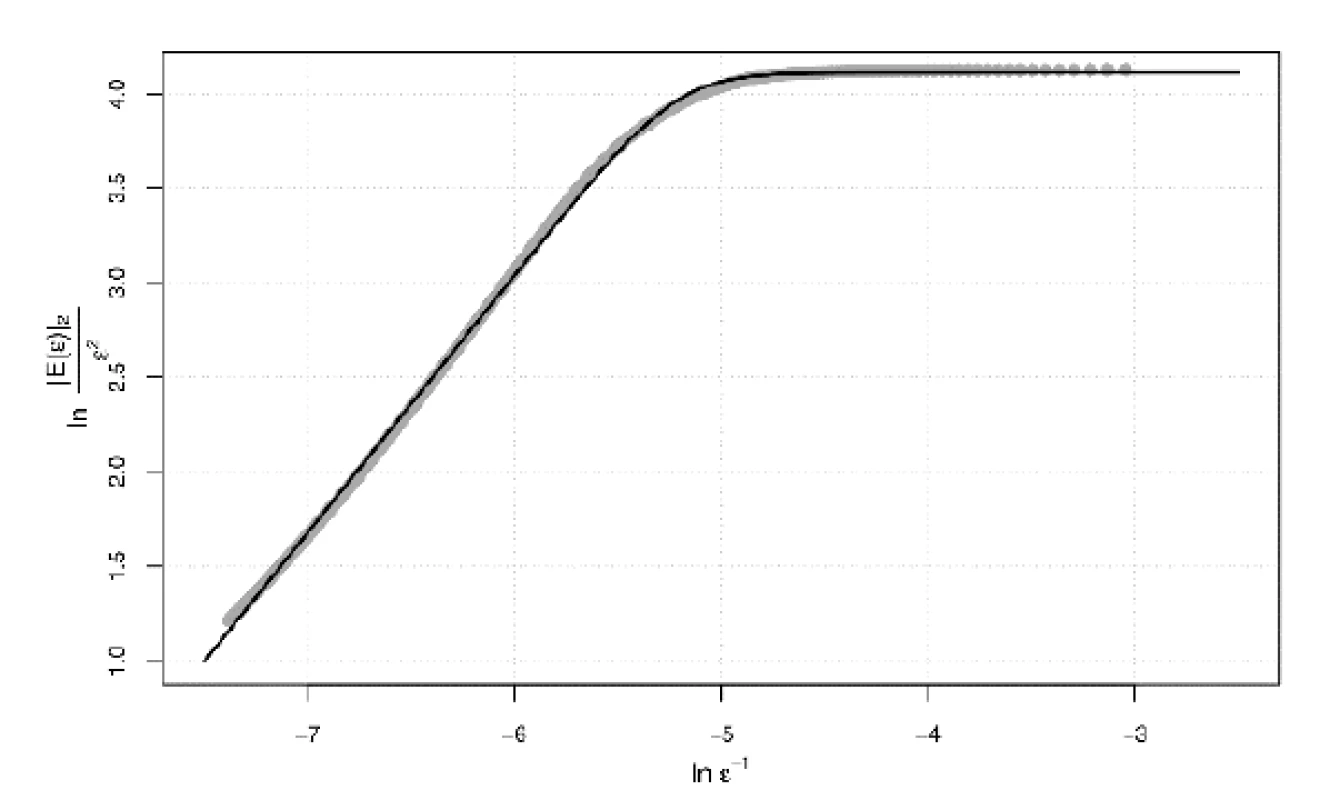
For all data, the convergence of the non-linear least square method (nls function) was obtained. In all cases, the value of all parameters of the model was significant with p-value below 0.001. Example of the fitting curve is on Figure 2.
2. Example of the log-log plot: left ventricle, unchanged size. Obtained points are highlighted as the gray discs, the black line is the fitting curve. Parameters of the fitting curve are: A=4.1138345, B=0.2065032, C=-6.5946840, D=-5.2105270, the slope of the oblique asymptote is 1.3618233. 
Results are summarized in Table 1 as the mean value and standard deviation. The algorithm shows very good stability with respect to the change of the scale, the variational coefficient is 0.01% for both samples. The algorithm shows good stability with respect to the rota-tion, the variational coefficient is 0.82% for the left ventricle and 0.74% for the right ventricle.
1. Mean values and variations of scaled and rotated data. Format is mean value (one significant digit of standard deviation). 
Discussion
Our approach seems to be sufficiently invariant with respect to scale and rotation. The distance of results, at least at our training samples, is sufficient to discriminate between the microvascular pattern of both samples irrespectively to the changes of the scale. This result has the biomedical importance. Scale invariance allows to compare samples obtained or processed by different ways. The assumption that the shrinkage of the tissue during the processing is homogeneous in different settings of processing of the tissue is significantly weaker than the assumption that the magnitude of the shrinkage is the same in different settings.
The advantage consisting in the scale invariance is counterbalanced by the loss of information about number of capillaries. The fractal dimension is related rather to the regularity of the distribution of the capillaries over the plane of section. This statement is related to Carlin's conclusion that the estimated "fractal dimension" is related to the complexity of the non-fractal object [8].
Conclusion
Main goal of our work was to try that the fractal-based descriptor of the point-pattern of the microvascular network on the histological section can be used as the scale invariant descriptor. Further step will be the analysis of different healthy and diseased tissues in order to detect or to compare changes in the microvascular network in the tissue during the pathogenesis.
Acknowledgement
The work has been supported by grants AZV 17-28784A and PROGRES Q25.
MUDr. Jaromír Šrámek
Institute of Histology and Embryology
1st Faculty of Medicine Charles University
Albertov 4,
CZ-128 00 Praha
E-mail: jsram@lf1.cuni.cz
Phone: +420 224 968 118
Sources
- Wehrl HF, Bezrukov I, Wirht S, Lehnhoff M, Fuchs K, Mannheim JG, Quintanilla-Martine L, Karlhoffer U, Kneilling M, Pichler BJ, Sauter AW. Assessment of murine brain tissue shrinkage caused by different histological fixatives using mag-netic resonance and computed tomography imaging. Histology and histopathology. 2015 May;30(5):601–13.
- Park HS, Lee S, Haam S, Lee GD. Effect of formalin fixation and tumour size in small-sized non-small-cell lung cancer: a prospec-tive, single-centre study. Histopathology. 2017 Sep;71(3):437–45. DOI: 10.1111/his.13237
- Smorodinova N, Lantová L, Bláha M, Melenovský V, Hanzelka J, Pirk J, Kautzner J, Kučera T. Bioptic Study of Left and Right Atrial Interstitium in Cardiac Patients with and without Atrial Fibrillation: Interatrial but Not Rhythm-Based Differences. PLOS ONE. 2015 Jun 12;10(6):e0129124. DOI: 10.1371/journal.pone.0129124
- Machado MV, Vieira AB, da Conceição FG, Nascimento AR, da Nóbrega ACL, Tibirica E. Exercise training dose differentially alters muscle and heart capillary density and metabolic functions in an obese rat with metabolic syndrome. Experimental physiology. 2017 Dec 1;102(12):1716–28. DOI:10.1113/EP086416
- Ruiz-Saurí A, García-Bustos V, Granero E, Cuesta S, Sales MA, Marcos V, Llombart-Bosch A. Distribution of Vascular Patterns in Different Subtypes of Renal Cell Carcinoma. A Morphometric Study in Two Distinct Types of Blood Vessels. Pathology & oncology research. 2018 Jul;24(3):515–24. DOI: 10.1007/s12253-017-0262-y
- Lopes R, Betrouni N. Fractal and multifractal analysis: a review. Medical image analysis. 2009 Aug;13(4):634–49. DOI: 10.1016/j.media.2009.05.003
- Soille P, Rivest J-F. On the validity of fractal dimension measurements in image analysis. Journal of visual communi-cation and image representation. 1996 Sep;7(3):217–29. DOI: 10.1006/jvci.1996.0020
- Carlin M. Measuring the complexity of non-fractal shapes by a fractal method. Pattern recognition letters. 2000 Oct;21(11): 1013–7. DOI: 10.1016/S0167-8655(00)00061-1
- Dubuc B, Quiniou JF, Roques-Carmes C, Tricot C, Zucker SW. Evaluating the fractal dimension of profiles. Physial review A, general physics. 1989 Feb 1;39(3):1500–12. DOI: 10.1103/PhysRevA.39.1500
- Agterberg FP. Fractals and spatial statistics of point patterns. Journal of earth science. 2013 Feb;24(1):1–11. DOI: 10.1007/s12583-013-0305-6
- Šrámek J, Kučera T, Melenovský V, Pirk J. The box-counting algorithm for scale and rotation invariant analysis of micro-vascular pattern on histological section – preliminary results. Presented at 50th International Congress of the Czech Anatomi-cal Society and 54th Lojda Symposium in Histochemistry - MORPHOLOGY; Pilsen, Czech Republic; 2017 Sep 10–12.
- Šrámek J, Pierzynová A, Kučera T. Fractal-based analysis of the microvascular pattern in the histological sample of the adipose tissue. Presented at XXVI International Symposium on Morphol-ogical Sciences; Prague, Czech Republic; 2018 Jul 5-7.
- Langerlöf RO. Interpolation with rounded ramp function. Communications of the ACM. 1974 Aug;17(8):476–79. DOI: 10.1145/361082.361101
Labels
Biomedicine
Article was published inThe Clinician and Technology Journal

2019 Issue 3-
All articles in this issue
- THE TIME DELAY OF AIR/OXYGEN MIXTURE DELIVERY AFTER THE CHANGE OF SET FIO2: AN IMPROVEMENT OF A NEONATAL MATHEMATICAL MODEL
- THE FRACTAL DIMENSION-BASED DESCRIPTOR OF THE MICROVASCULAR PATTERN ON THE HISTOLOGICAL SECTION
- GOLF SWING VARIABILITY IN ELITE FEMALE JUNIOR GOLFERS
- APPLICATION OF THE ARTEC EVA SCANNER FOR ORTHOTICS IN PRACTICE
- EFFECT OF AGE AND GENDER ON ARTICULATION OF VOICED AND VOICELESS STOP CONSONANTS IN CZECH
- The Clinician and Technology Journal
- Journal archive
- Current issue
- Online only
- About the journal
Most read in this issue- THE TIME DELAY OF AIR/OXYGEN MIXTURE DELIVERY AFTER THE CHANGE OF SET FIO2: AN IMPROVEMENT OF A NEONATAL MATHEMATICAL MODEL
- GOLF SWING VARIABILITY IN ELITE FEMALE JUNIOR GOLFERS
- EFFECT OF AGE AND GENDER ON ARTICULATION OF VOICED AND VOICELESS STOP CONSONANTS IN CZECH
- APPLICATION OF THE ARTEC EVA SCANNER FOR ORTHOTICS IN PRACTICE
Login#ADS_BOTTOM_SCRIPTS#Forgotten passwordEnter the email address that you registered with. We will send you instructions on how to set a new password.
- Career


