-
Články
- Vzdělávání
- Časopisy
Top články
Nové číslo
- Témata
- Kongresy
- Videa
- Podcasty
Nové podcasty
Reklama- Kariéra
Doporučené pozice
Reklama- Praxe
The optical method of measurement of sizes and the refractive index of nanoparticles Ag@Fe3O4
Optická metoda měření velikosti a refrakčního indexu nanočástic Ag@Fe3O4
Spektrofotometrická metoda a elektronový mikroskop byly užity pro určení distribuční funkce nanočástic Ag@Fe3O4 podle velikosti ak měření jejich komplexního refrakčního indexu. Částice byly syntetizovány jako složka magneticky kontrolovaných léčiv s antibakteriálními vlastnostmi. Byl navržen algoritmus zpracování výsledků pokusu ke změření velikostí nanočástic (1 až 100 nm).
Klíčová slova:
nanočástice • velikost • měření • spektrum • ztenčení
Authors: Ya. Y. Levitin; V. A. Timanuyk; T. M. Chan; O. S. Kryskiv
Authors place of work: National University of Pharmacy 53, Pushkinska st., 61002 Kharkiv, Ukraine
Published in the journal: Čes. slov. Farm., 2016; 65, 171-175
Category: Původní práce
Summary
The spectrophotometric method and the electron microscope have been used to determine the distribution function of Ag@Fe3O4 nanoparticles by sizes and to measure their complex refractive index. These particles have been synthesized as acomponent of magnetically controlled drugs with antibacterial properties. The algorithm of processing the results of the experiment has been designed to measure the sizes of nanoparticles (1–100 nm).
Key words:
nanoparticle • sizes • measuring • spectrum • attenuationIntroduction
When solving various problems in physics, chemistry, biology, ecology and engineering, the size and optical properties of solid or liquid particles should be determined. Aerosols and water droplets in the atmosphere, emulsions and suspensions in liquids, bacteria, biological cells, etc., can be such particles.
To date the methods of microscopy1, 2), sedimentation3) and others are used for solving these problems.
The optical methods are the most common ones4–8). The optical beam is directed to the test volume containing particles. A photodetector records the parameters of the passed or diffused light such as its intensity, phase, and polarization. The mathematical processing of the signal from the photodetector allows determining parameters of particles9–11).
The optical methods for determination of particle parameters can be divided into two large groups. In one group the indicatrix shape and the polarization parameters of the scattered particle radiation are measured, in another group the spectral dependence of the intensity of radiation transmitted through a medium is studied12). To measure the parameters of nanoparticles, the latter methods find greater application. Their advantages are less sensitivity to the shape of particles than in the methods associated with the measurement of scattering indicatrix and the ability to measure dimensions of very small particles (with the radius of several nanometers). The mathematical basis of the methods is the Bouguer‘s law:
I = I0e-αl [1]
where I – is the intensity of the light transmitted through a medium containing absorbing and scattering particles, I0 – is the intensity of the incident light, l – is the thickness of the layer containing particles, α – is the attenuation coefficient.
If the environment contains N identical particles per unit volume, then neglecting the effect of multiple scattering of radiation (αl < 15) the attenuation coefficient is determined as follows:
α (r, m, N, λ) = NQ(r, m, λ)πr2 [2]
where Q – is the efficiency factor of attenuation. The attenuation coefficient depends on the particle size r, their complex refractive index m = n – iκ, and the radiation wavelength λ.
If distribution of particles in size is described by the function f(r), then:
By measuring the dependence of the attenuation coefficient on the wavelength and knowing the form of the function Q(κ, r,m,λ) the average particle size can be determined using formula [2], whereas when using formula [3] the function of their distribution by size can be found.
Experimental Part
Materials and methods
The object of the measurements was the suspension of Ag@Fe3O4 nanoparticles obtained by the original single-phase method of chemical co-precipitation in water13, 14).
UV-transmission spectra were recorded with a SPEKOL-11 spectrophotometer (Carl Zeiss Jena, Germany) in cells with the layer thickness of 10 mm. The material of cells was colorless optical glass K-8; the wall thickness, 3 mm.
Experiment
Using a spectrophotometer, the transmission spectrum of the cell with a 1 mL suspension (obtained as the result of synthesis13, 14)) was measured in the wavelength range of λ0 = 0.400–0.840 µm (in the air). According to the formula
which follows from the ratio (l), the attenuation coefficient was calculated. Here T = l/l0 – is the luminous transmittance by the cell.
Figure 1 presents the graph of one of the dependences α(λ) where the abscissa axis shows the wavelengths of radiation in water.
Fig. 1. The attenuation spectrum of the suspension of Ag@Fe<sub>3</sub>O<sub>4</sub> nanoparticles 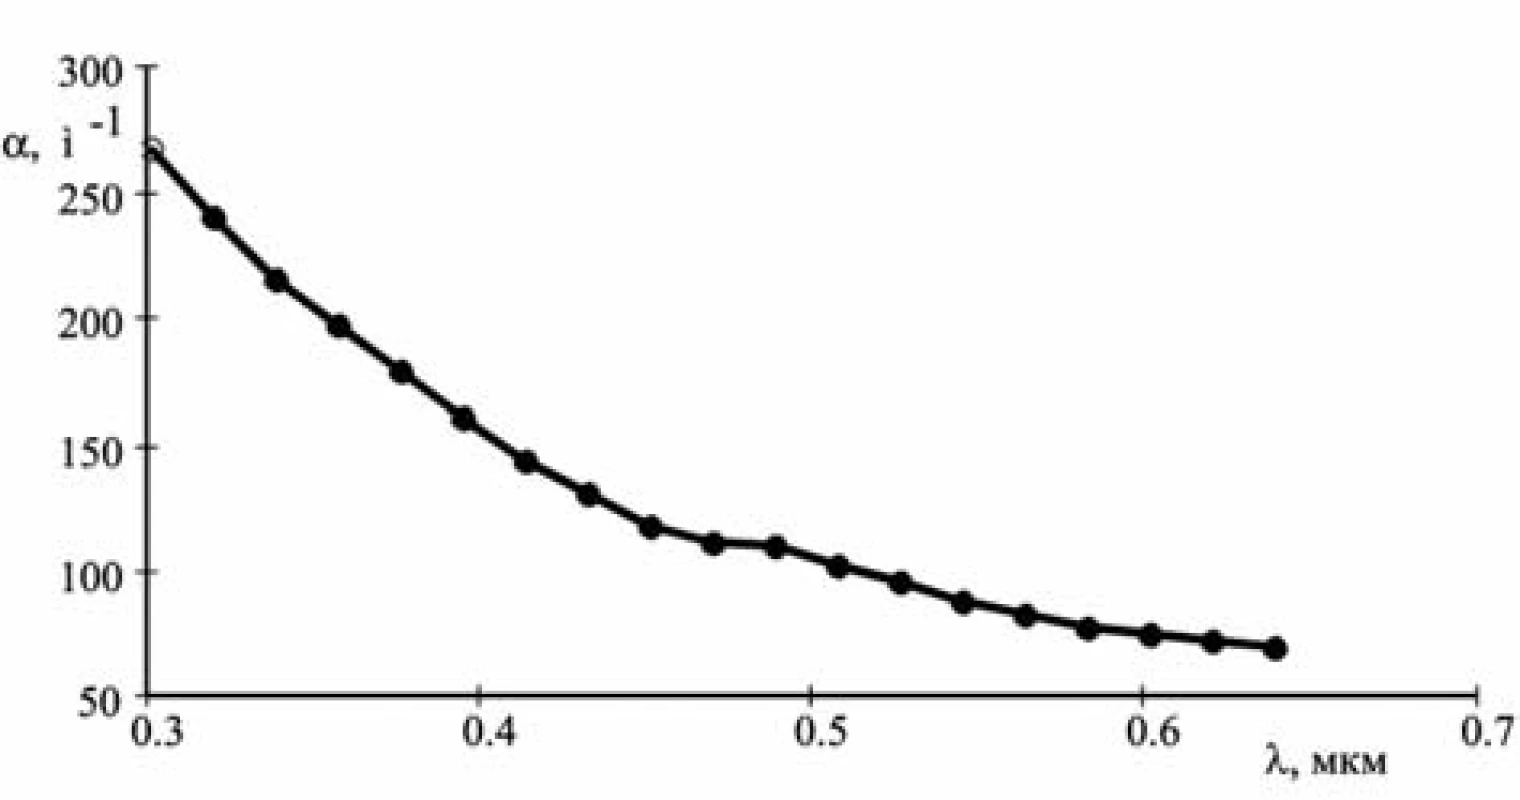
Results and discussion
Data processing was carried out in three stages.
1. Measurement of the average particle size by the method of the power function
Based on the theory of light scattering by small particles15), the dependence α(λ) is known to be described by the power function:
where А – is the coefficient depending on the particle concentration, size and the refraction index. The index of power q depends on the ratio between the particle radius r and the wavelength of light λ. If r<<λ and the particles are nonabsorbing, then q = 4 (Rayleigh law). Increasing the particle size, the value q decreases. For very small absorbing particles q = 1 and when increasing the particle size, at first the value q increases, and then it decreases.
The index of power q can be determined from experimental data as follows. After taking the logarithm of formula (5), one can get a linear dependence (Fig. 2).
lnα = lnA – qlnλ. [6]
The value q here is the angular coefficient. It can be found using the least square method.
Fig. 2. The dependence α(λ) after taking the logarithm from the equation of a straight line, one gets that q = 1.826 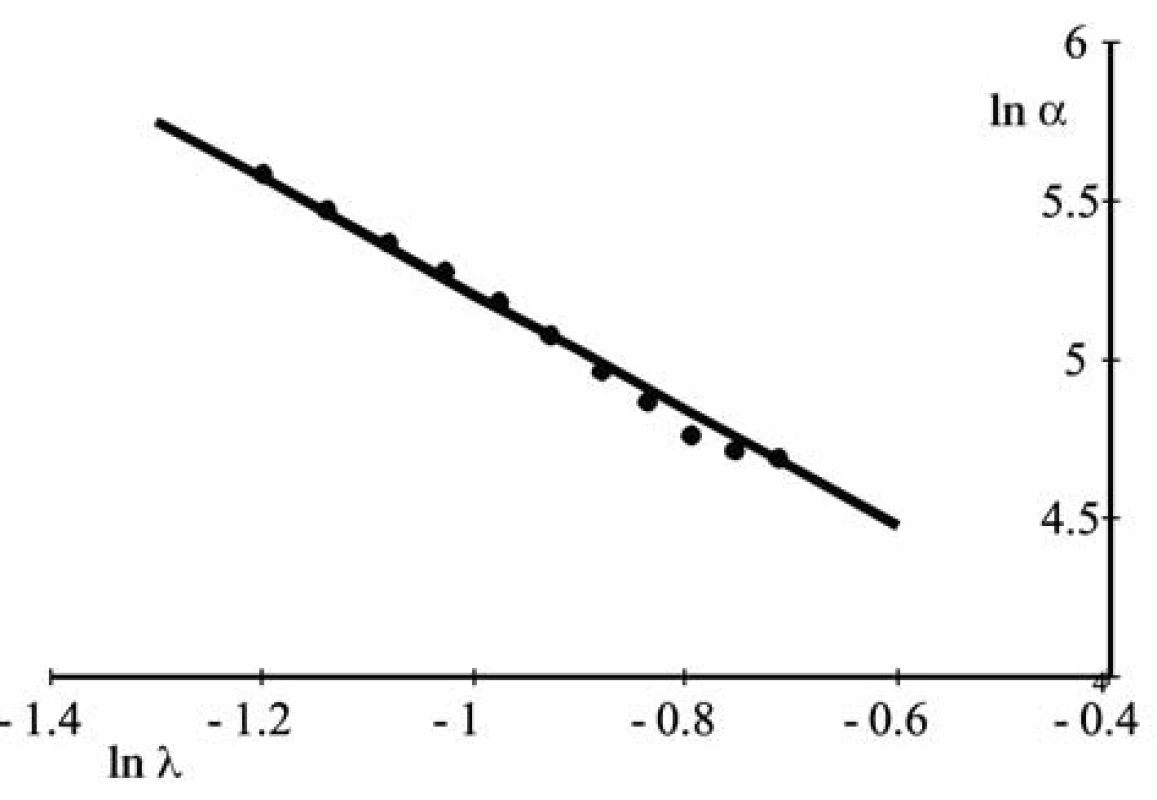
Combining formulas [2] and [5] we find that:
where ρ = πd/λ.
This equation relates the values q and ρ. Having determined the index of power q, it is possible to find the value ρ and particle sizes. When calculating the function Q(m,ρ), one can use formulas for the sphere16–18), which give good results in the case of light scattering on the arrays of randomly distributed particles of the irregular shape:
where
ψ1(z) and ζ1(z) – are Bessel - Riccati functions, the sign′ means derivative of the function throughout the argument.
For calculations one should know the complex refractive index of the particle substance. The nanoparticles of magnetite and silver are present in the suspension. According to the literature data19–20), their refractive indices in the air at the wavelength of 0.5 μm are as follows:
magnetite – m0 = 2 – 0.04i [11]
silver – m0 = 0.05 – 3.09i [12]
The calculations by formulas [8–10] show that efficiency of the attenuation coefficient for silver nanoparticles is much greater than in magnetite nanoparticles; therefore, mainly these particles affect scattering and absorption of light in the cell. Hence, the value of the refractive index [12] should be used in calculations by formula [6].
The graph of q(ρ) function calculated according to these data is shown in Figure 3.
Fig. 3. The graph of q(ρ) function 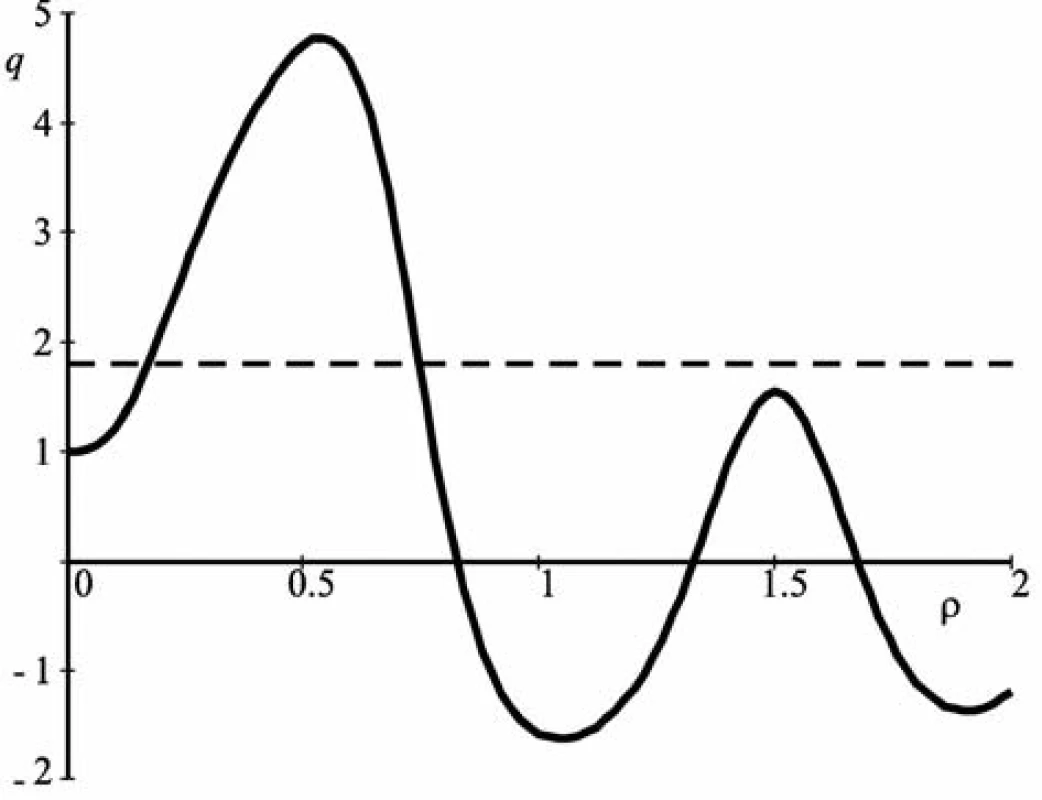
The horizontal dashed line is drawn at the level of the value q = 1.825. Two values of the parameter ρ correspond to it: ρ1 = 0.18 and and ρ2 = 0.74.
The value ρ2 should be omitted since the value of the particle size corresponding to it is not found in the nanometer range since it is in the micrometer range.
The particle diameter is determined by the ratio: d = ρλav/π = 27 nm.
The value of the average wavelength in the working range λav = 470 nm was used.
2. Measurement of parameters of particles by the method of spectral transparency
The idea of the method consists in selecting such values of the parameters N, r, n, κ in equation [2] when the theoretical dependence α(λ) coincides well with the experimental one. The function type Q (r, n, κ, λ) must be known. For this purpose formulas [6–8] are used.
The number of unknowns in formula [2] is four. Their number can be reduced by using the attenuation values ααi and ααj at wavelengths λi and λj, as well as dividing equation [2] one upon the other:
To find the unknowns r, n, κ, it is sufficient to take three equations [13]. The following values of dependence α(λ) obtained in the experiment were used (see Fig. 1):
To solve the resulting system of equations, the MATHCAD program was used. As the initial approximations, the values obtained above were taken: r = 13.5 nm, n = 0.05, κ = 3.09.
The results of the solution are as follows: r = 17.5 nm, n = 1.65, κ = 5.11.
Such values of the parameters obtained indicate that the value of the particle radius by the previous method has been found to be close to the true value. The differences may be due to the fact that when calculating the particle size the average value of the wavelength λav = 470 nm was used. From the graph in Figure 2 it is seen that when using another spectral range (e.g., from 500 to 700 nm) there would be other values λav, and the particle size would be different. This is a drawback of the previous method. But it is suitable to determine the initial value of the particle size when solving the system of equations [13].
The values of the optical constants obtained (n = 1.65, κ = 5.11) show that the refractive index n is determined by magnetite particles, and the absorption index, by silver particles. For air, these values are as follows: n0 = 2.19, κ0 = 6.80
Using formula [2], the concentration of particles in the medium is determined:
Figure 4 shows the curve calculated by formula [2] using the values r, n, κ, N obtained. It is apparent that it passes through the array of experimental points. This suggests that these values are close to true values.
Fig. 4. Approximation of the experimental data of the theoretical curve 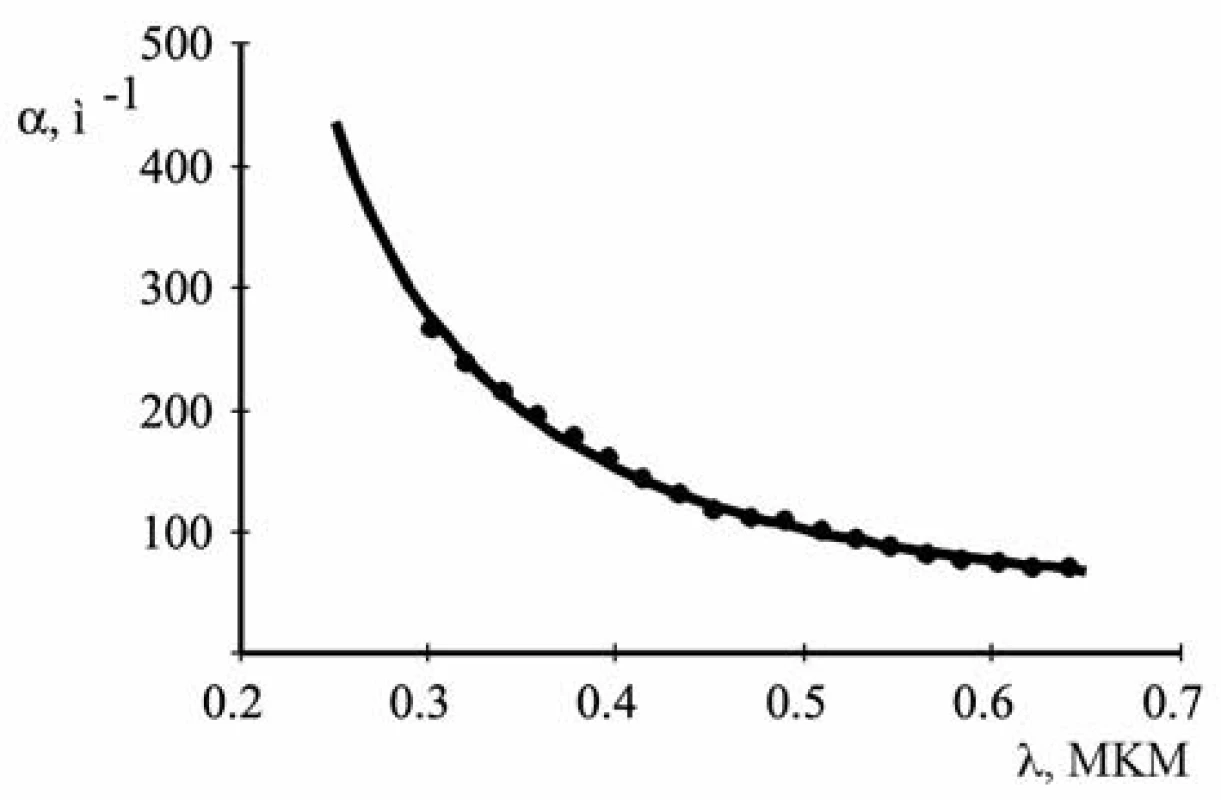
3. Measurement of the function of particle size distribution
In order to determine the function of particle size distribution f(r) the integral equation [3] should be solved. This is Fredholm equation of the first kind. It is very sensitive to errors in the initial data – the function α(λ)21). Therefore, when solving it the method of parameterization is often used – the formula for the function f(r) is given, and the values of its parameters, which the calculated function α(λ) most closely corresponds to the experimental results, are found.
The disadvantage of the method of parameterization is the need for a priori assignment of the distribution function f(r). However, often the error in the solution of the integral equation [3] in general is so great that it makes equal the validity of the results obtained by those methods and the method of parameterization.
The function of particle size distribution was given in the form of the Gaussian function:
Here rm is the most probable the value of the particle radius. The standard deviation Δr characterizes the value of particle size distribution.
Such function according to the literature data9) describes well the distribution of particles with sizes in the range from 0.01 to 100 μμm and a small variation in size.
The attenuation coefficient α was calculated as the integrated sum by the method of trapezoids with a fixed number of intervals – 40.
Parameters rm, Δr and N were determined by the least square method. For this purpose the minimum of the function was found:
where αi – are the experimental values of the attenuation coefficient at wavelengths λi.
The initial values of parameters rm, Δr, N were set as those obtained at the second stage of calculations.
The following parameters of the function f(r) were obtained: r = 17 nm, Δr = 8 nm.
The graph of the function of particle size distribution is given in Figure 5. The abscissa axis shows the values of the particle diameter in nanometers, the ordinate axis demonstrates the values of the function f(r) normalized to the maximum value.
Fig. 5. The function of particle size distribution 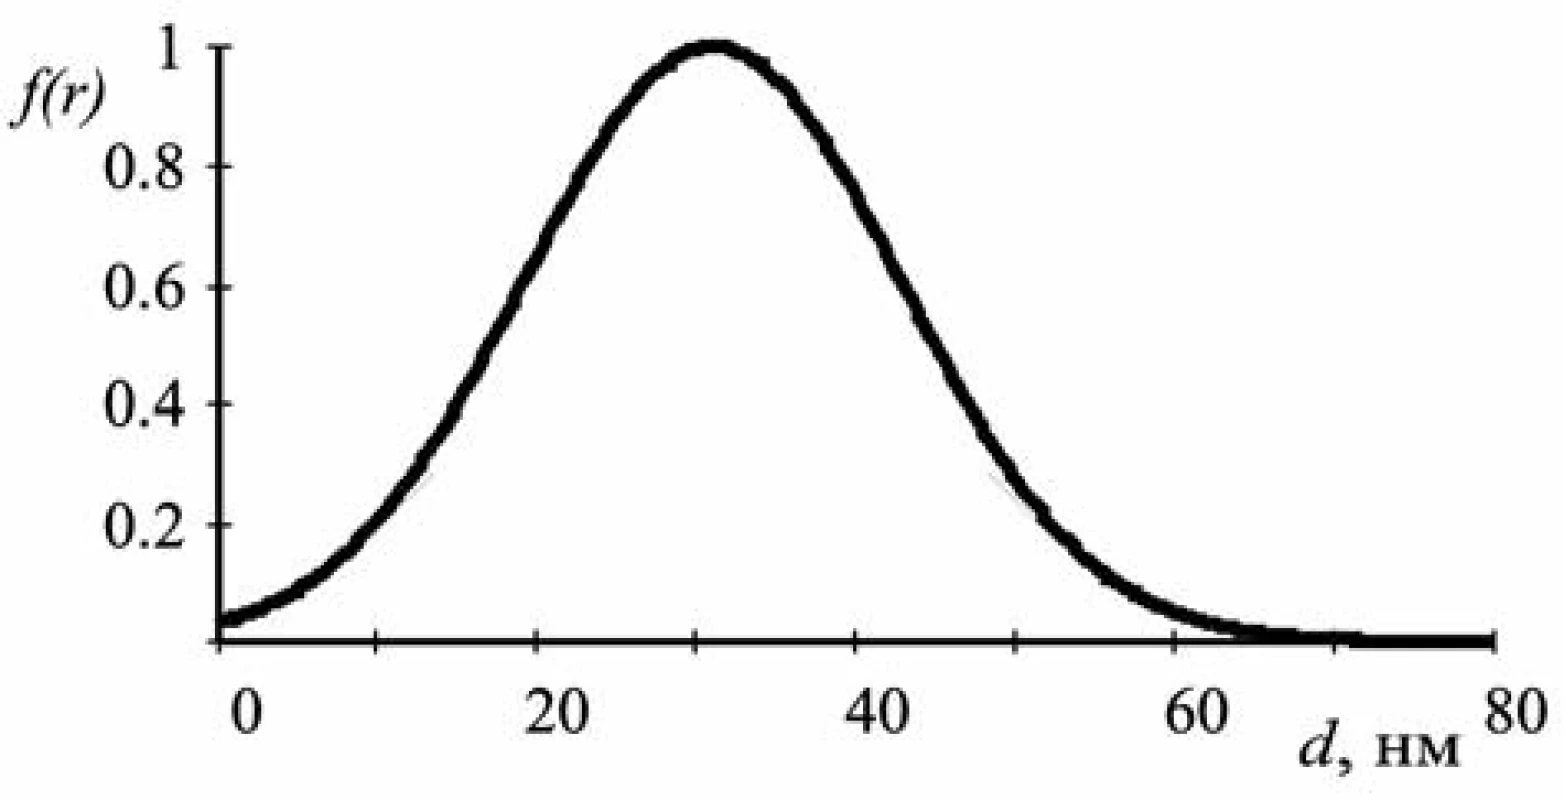
The data obtained by the computational methods proposed are in good agreement with the results of similar studies by electron microscopy (Fig. 6)13–15).
Fig. 6. A picture of Ag@Fe<sub>3</sub>O<sub>4</sub> nanoparticles using an electron microscope 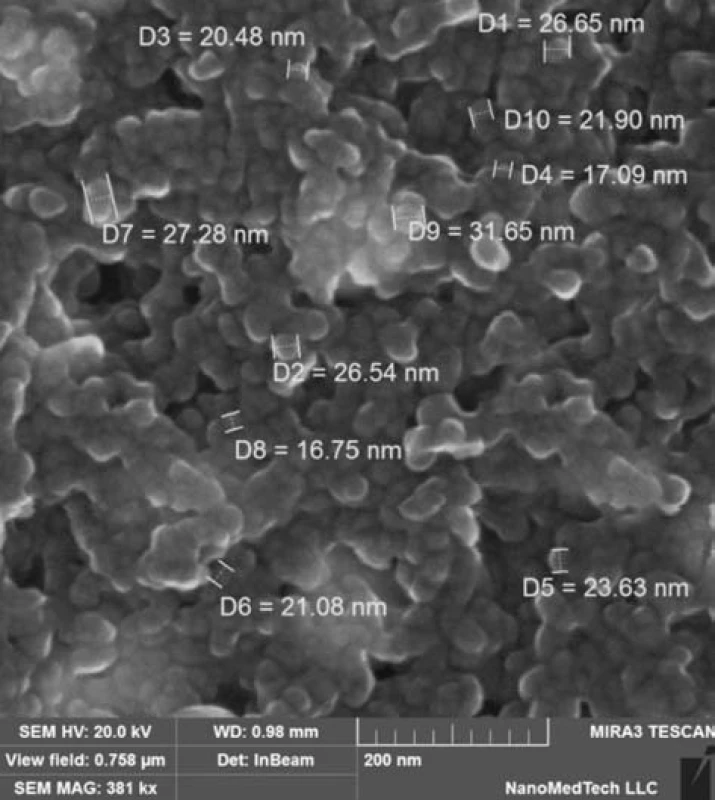
Conclusions
Methods of measurement of size and optical properties of Ag@Fe3O4 nanoparticles based on the treatment of the light attenuation spectrum (such as determining the average particle size by the method of the power function, measuring the parameters of particles by the method of spectral transparency and the function of particle size distribution) give results consistent with the observations of particles using an electron microscope.
Conflicts of interest: The authors have declared that there are no financial relationships with any organizations that might have an interest in the submitted work, nor any other relationships or activities that could appear to have an influence on the submitted work.
Conflict of interest: none.Received April 7, 2016 / Accepted May 31, 2016
Mykola G. Kokodiy
National University of Pharmacy
53, Pushkinska st., 61002 Kharkiv, Ukraine
V. N. Karazin Kharkiv National University
4, Svobody Sq., 61022 Kharkiv, Ukraine
e-mail: Kokodiy.N.G@gmail.com
Zdroje
1. Clarke A. R., Eberhardt C. N. Microscopy Techniques for materials science. Woodhead Publishing: CRC Press 2002.
2. Lacey A. J. (ed.). Light Microscopy in Biology: A practical approach. Second Edition. USA: Oxford University Press 1999.
3. Rovinskiy L. A. Sedimentatsiya suspenziy. Moskva: Sputnik 2003.
4. di Stasio S. Feasibility of an optical experimental method for the sizing of primary spherules in submicron agglomerates by polarized light scattering. Appl. Phys. 2000; 1370, 635–643.
5. Ivanov L. A., Kizevetter D. V., Kiselev N. N., Slugin V. A., Malyugin V. I. Measurements of the retroreflection from glass microbeads and retroreflective coating quality prediction. Opt. Zh. 2006; 73(1), 35–40.
6. Kizevetter D. V. Malyugin V. I. Simultaneous measurement of moving particle size and velocity. Tech. Phys. 2009; 54(2), 253–258.
7. Ershov A. E., Isaev I. L., Semina P. N., Markel V. A., Karpov S. V. Effects of size polydispersity on the extinction spectra of colloidal nanoparticle aggregates. Phys. Rev. B. 2012; 85(4), 045421.
8. Karpov S. V., Isaev I. L., Gavrilyuk A. P. Optical spectra of silver colloids from the viewpoint of the physics of fractals. Kolloidn. Zh. 2009; 71(3), 314–329.
9. Pramod Kulkarni, Paul A. Baron, Klaus Willeke (eds). A erosol Measurement: Principles, techniques, and applications. 3rd Edition. New Jersey: Wiley Hiboken 2011.
10. Xu R. Particle characterization: light scattering methods. Beckom Coulter, Miami, USA, Kluwer Academic Publishers, N.Y., Boston, Dordrecht, London, Moscow 2001.
11. Mulholland C. W., Donnelly M. K., Hadwood Ch. W., Kukuck S. R., Hackly V. A., Pui D. Y. H. Measurement of 100 nm and 60 nm particle standards by differential mobility analysis. J. Res. Nat. Inst. Stand. Technol. 2006; 111(4), 257–312.
12. Kokodii N. G., Lizogubenko S. V., Kaydash M. Measurement of size of micro-particles by optical method with digital processing of picture of light scattering. Radiophysics and electronics 2012; 3(17), 104–107.
13. Chan T. M., Levitin Ye. Ya., Kryskiv O. S., Vedernikova I. A. Characterization of Ag@Fe3O4 core-shell nanocomposites for biomedical applications. JOCPR 2015; 7(5), 816–819.
14. Levitin Ye. Ya., Chan T., Kryskiv O., Skoryk M. Obtaining of magnetic Ag@Fe3O4 nanocomposite with the “core-shell” structure for medical purpose. Scripta Scientifica Pharmaceutica 2015; 1, 39–45.
15. Klenin V. I., Schegolev S. Yu., Lavrushin V. I. Harakteristicheskie funktsii svetorasseyaniya dispersnyih chastits. Saratov: Izd-vo SGU 1977.
16. Vande Hyulst G. Rasseyanie sveta malyimi chastitsami. МMoskva: IL 1961.
17. Kerker M. The scattering of light and other electromagnetic radiation. N.Y., London: Academic Press 1969.
18. Deirmendjian D. Electromagnetic scattering on spherical polydispersions. New York, NY (USA): Elsevier Scientific Publishing 1969.
19. Ordal M. A., Long L. L., Bell R. J., Bell S. E., Bell R. R., Alexander Jr. R. W., Ward C. A. Optical properties of metals Al, Co, Cu, Au, Fe, Pb, Ni, Pa, Pt, Ag, Ti, and W in the infrared and far infrared. Applied Optics 1983; 22(7), 1099–1120.
20. Johnson P. B., Christy R. W. Optical constants of the noble metals. Physical Review B. 1972; 6(12), 4370–4379.
21. Verlan A. F., Sizikov V. S. Integralnyie uravneniya: metodyi, algoritmyi, programmyi. Kyiv: Naukova dumka 1978.
Štítky
Farmacie Farmakologie
Článek Nové knihy
Článek vyšel v časopiseČeská a slovenská farmacie
Nejčtenější tento týden
2016 Číslo 5- Psilocybin je v Česku od 1. ledna 2026 schválený. Co to znamená v praxi?
- Ukažte mi, jak kašlete, a já vám řeknu, co vám je
- Přerušovaný půst může mít významná zdravotní rizika
-
Všechny články tohoto čísla
- The optical method of measurement of sizes and the refractive index of nanoparticles Ag@Fe3O4
- The conscientious objection among pharmacists in the Slovak Republic
- Jews in European pharmacy from the seventh to the early twentieth centuries
-
Pracovní den sekce technologie léků
„Pokroky v lékových formách” - Výstava Léčivé rostliny a jejich dvojníci
- Prof. RNDr. Viliam Foltán, CSc. jubiluje
- Prof. RNDr. Luděk Beneš, DrSc. – in memoriam
- Nové knihy
- Česká a slovenská farmacie
- Archiv čísel
- Aktuální číslo
- Informace o časopisu
Nejčtenější v tomto čísle- The conscientious objection among pharmacists in the Slovak Republic
- Jews in European pharmacy from the seventh to the early twentieth centuries
- Prof. RNDr. Luděk Beneš, DrSc. – in memoriam
- The optical method of measurement of sizes and the refractive index of nanoparticles Ag@Fe3O4
Kurzy
Zvyšte si kvalifikaci online z pohodlí domova
Autoři: prof. MUDr. Vladimír Palička, CSc., Dr.h.c., doc. MUDr. Václav Vyskočil, Ph.D., MUDr. Petr Kasalický, CSc., MUDr. Jan Rosa, Ing. Pavel Havlík, Ing. Jan Adam, Hana Hejnová, DiS., Jana Křenková
Autoři: MUDr. Irena Krčmová, CSc.
Autoři: MDDr. Eleonóra Ivančová, PhD., MHA
Autoři: prof. MUDr. Eva Kubala Havrdová, DrSc.
Všechny kurzyPřihlášení#ADS_BOTTOM_SCRIPTS#Zapomenuté hesloZadejte e-mailovou adresu, se kterou jste vytvářel(a) účet, budou Vám na ni zaslány informace k nastavení nového hesla.
- Vzdělávání


